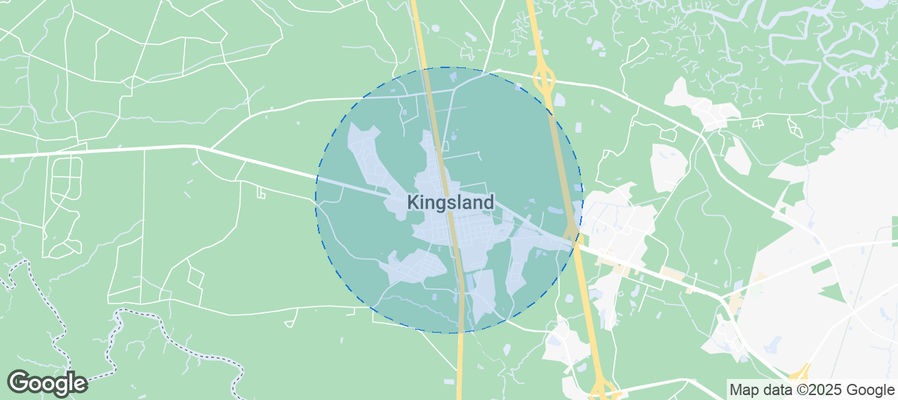
Kingsland Airbnb Market Analysis 2026: Short Term Rental Data & Vacation Rental Statistics in Georgia, United States
Is Airbnb profitable in Kingsland in 2026? Explore comprehensive Airbnb analytics for Kingsland, Georgia, United States to uncover income potential. This 2026 STR market report for Kingsland, based on AirROI data from February 2025 to January 2026, reveals key trends in the niche market of 20 active listings.
Whether you're considering an Airbnb investment in Kingsland, optimizing your existing vacation rental, or exploring rental arbitrage opportunities, understanding the Kingsland Airbnb data is crucial. Leveraging the low regulation environment is key to maximizing your short term rental income potential. Let's dive into the specifics.
Key Kingsland Airbnb Performance Metrics Overview
Monthly Airbnb Revenue Variations & Income Potential in Kingsland (2026)
Understanding the monthly revenue variations for Airbnb listings in Kingsland is key to maximizing your short term rental income potential. Seasonality significantly impacts earnings. Our analysis, based on data from the past 12 months, shows that the peak revenue month for STRs in Kingsland is typically July, while January often presents the lowest earnings, highlighting opportunities for strategic pricing adjustments during shoulder and low seasons. Explore the typical Airbnb income in Kingsland across different performance tiers:
- Best-in-class properties (Top 10%) achieve $4,871+ monthly, often utilizing dynamic pricing and superior guest experiences.
- Strong performing properties (Top 25%) earn $3,660 or more, indicating effective management and desirable locations/amenities.
- Typical properties (Median) generate around $2,431 per month, representing the average market performance.
- Entry-level properties (Bottom 25%) see earnings around $1,296, often with potential for optimization.
Average Monthly Airbnb Earnings Trend in Kingsland
Kingsland Airbnb Occupancy Rate Trends (2026)
Maximize your bookings by understanding the Kingsland STR occupancy trends. Seasonal demand shifts significantly influence how often properties are booked. Typically, Julysees the highest demand (peak season occupancy), while January experiences the lowest (low season). Effective strategies, like adjusting minimum stays or offering promotions, can boost occupancy during slower periods. Here's how different property tiers perform in Kingsland:
- Best-in-class properties (Top 10%) achieve 85%+ occupancy, indicating high desirability and potentially optimized availability.
- Strong performing properties (Top 25%) maintain 69% or higher occupancy, suggesting good market fit and guest satisfaction.
- Typical properties (Median) have an occupancy rate around 49%.
- Entry-level properties (Bottom 25%) average 26% occupancy, potentially facing higher vacancy.
Average Monthly Occupancy Rate Trend in Kingsland
Average Daily Rate (ADR) Airbnb Trends in Kingsland (2026)
Effective short term rental pricing strategy in Kingsland involves understanding monthly ADR fluctuations. The Average Daily Rate (ADR) for Airbnb in Kingsland typically peaks in November and dips lowest during April. Leveraging Airbnb dynamic pricing tools or strategies based on this seasonality can significantly boost revenue. Here's a look at the typical nightly rates achieved:
- Best-in-class properties (Top 10%) command rates of $265+ per night, often due to premium features or locations.
- Strong performing properties (Top 25%) achieve nightly rates of $197 or more.
- Typical properties (Median) charge around $148 per night.
- Entry-level properties (Bottom 25%) earn around $109 per night.
Average Daily Rate (ADR) Trend by Month in Kingsland
Get Live Kingsland Market Intelligence 👇
Explore Real-time Analytics
Airbnb Seasonality Analysis & Trends in Kingsland (2026)
Peak Season (July, June, March)
- Revenue averages $3,347 per month
- Occupancy rates average 62.0%
- Daily rates average $160
Shoulder Season
- Revenue averages $2,604 per month
- Occupancy maintains around 48.4%
- Daily rates hold near $169
Low Season (January, February, October)
- Revenue drops to average $2,062 per month
- Occupancy decreases to average 38.7%
- Daily rates adjust to average $170
Seasonality Insights for Kingsland
- The Airbnb seasonality in Kingsland shows highly seasonal trends requiring careful strategy. While the sections above show seasonal averages, it's also insightful to look at the extremes:
- During the high season, the absolute peak month showcases Kingsland's highest earning potential, with monthly revenues capable of climbing to $3,757, occupancy reaching a high of 63.0%, and ADRs peaking at $189.
- Conversely, the slowest single month of the year, typically falling within the low season, marks the market's lowest point. In this month, revenue might dip to $1,795, occupancy could drop to 32.3%, and ADRs may adjust down to $140.
- Understanding both the seasonal averages and these monthly peaks and troughs in revenue, occupancy, and ADR is crucial for maximizing your Airbnb profit potential in Kingsland.
Seasonal Strategies for Maximizing Profit
- Peak Season: Maximize revenue through premium pricing and potentially longer minimum stays. Ensure high availability.
- Low Season: Offer competitive pricing, special promotions (e.g., extended stay discounts), and flexible cancellation policies. Target off-season travelers like remote workers or budget-conscious guests.
- Shoulder Seasons: Implement dynamic pricing that balances peak and low rates. Target weekend travelers or specific events. Offer slightly more flexible terms than peak season.
- Regularly analyze your own performance against these Kingsland seasonality benchmarks and adjust your pricing and availability strategy accordingly.
Best Areas for Airbnb Investment in Kingsland (2026)
Exploring the top neighborhoods for short-term rentals in Kingsland? This section highlights key areas, outlining why they are attractive for hosts and guests, along with notable local attractions. Consider these locations based on your target guest profile and investment strategy.
| Neighborhood / Area | Why Host Here? (Target Guests & Appeal) | Key Attractions & Landmarks |
|---|---|---|
| St. Simons Island | A charming coastal island known for its beautiful beaches and golf courses. It attracts tourists looking for a relaxing beach retreat with a variety of outdoor activities. | St. Simons Island Lighthouse Museum, East Beach, Fort Frederica National Monument, Jekyll Island, Sea Island, Angelina's Pizzeria |
| Jekyll Island | A historic island with pristine beaches and well-preserved natural beauty. It attracts families and nature lovers looking for outdoor adventures and historical sites. | Jekyll Island Museum, Driftwood Beach, The Historic Jekyll Island Club, Summer Waves Water Park, St. Andrews Beach |
| Brunswick | A city with rich history and vibrant cultural scene, offering access to numerous nearby amenities and attractions. It appeals to travelers wanting a mix of urban experience and nature. | Historic District, Marshes of Glynn, Golden Isles Convention & Visitors Bureau, Blythe Island Regional Park, Brunswick Landing Marina |
| Sea Island | An exclusive barrier island with luxurious accommodations and beautiful beaches. It attracts affluent travelers seeking high-end relaxation and exceptional service. | Sea Island Golf Club, The Cloister at Sea Island, Beach Club, Five-Star Spa, Tennis Center |
| Cumberland Island National Seashore | Known for its unspoiled beaches and wild horses, this national park attracts adventurers and nature enthusiasts looking for a remote getaway. | Cumberland Island historic ruins, Wild Horses, Dungeness Ruins, Plum Orchard Mansion, Sea Turtles |
| Cumberland Island Ferry | Access point to Cumberland Island, providing a convenient location for tourists looking to explore the national seashore's beauty and history. | Ferry to Cumberland Island, Guided Tours to Historic Sites, Pavilion in St. Marys, Wildlife Viewing, Beach Access |
| The Retreat at Sutherland | A unique community with a retreat-style atmosphere, attracting visitors seeking peace and relaxation immersed in nature. | Sutherland Bluff Plantation, Nature Trails, Fishing Spots, Bird Watching, Historic Sites |
| Kingsland Historic District | A quaint historic area with Southern charm that attracts visitors interested in local history and Southern culture. | Historic buildings, Local shops, Restaurants, Community events, Annual festivals |
Understanding Airbnb License Requirements & STR Laws in Kingsland (2026)
While Kingsland, Georgia, United States currently shows low STR regulations, specific Airbnb license requirements might still exist or change. Always verify the latest short term rental regulations and Airbnb license requirements directly with local government authorities for Kingsland to ensure full compliance before hosting.
(Source: AirROI data, 2026, finding no licensed listings among those analyzed)
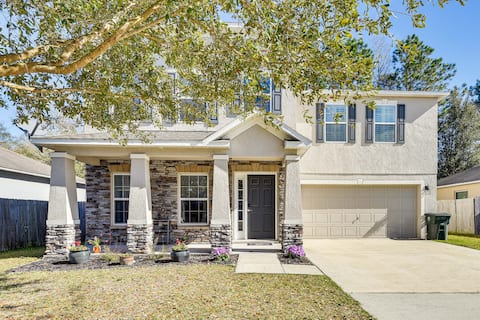
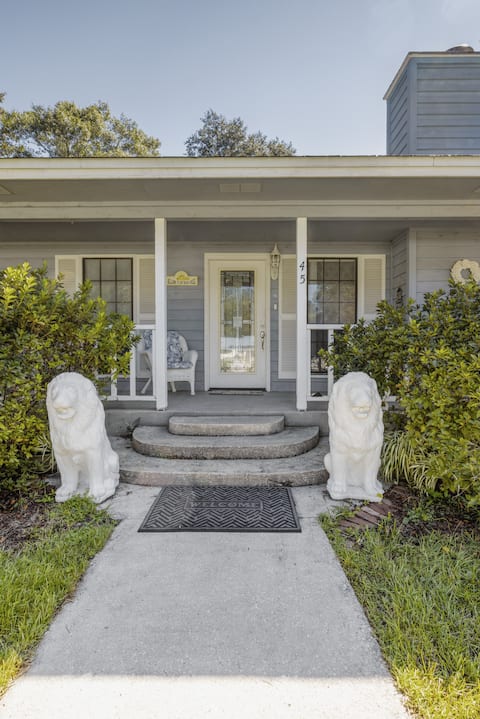
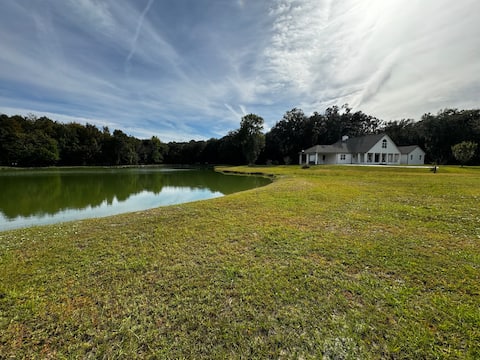
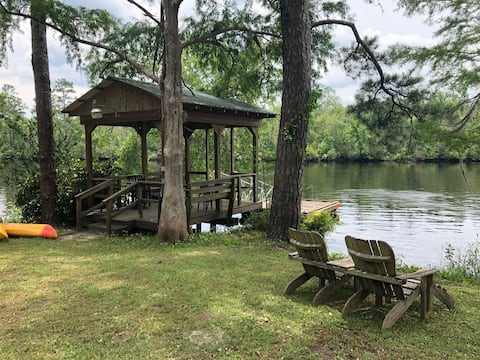
Top Performing Airbnb Properties in Kingsland (2026)
Benchmark your potential! Explore examples of top-performing Airbnb properties in Kingslandbased on Trailing Twelve Month (TTM) revenue. Analyze their characteristics, revenue, occupancy rate, and ADR to understand what drives success in this market.
Spacious Fun Vacation Rental
Entire Place • 4 bedrooms
Southern Hospitality in Georgia
Entire Place • 3 bedrooms
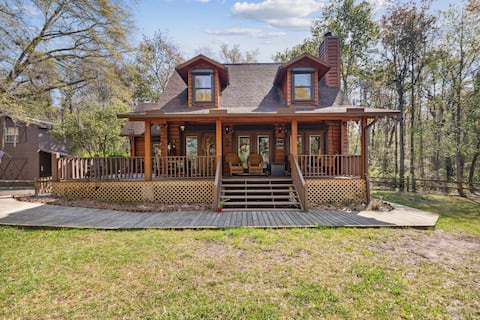
Saint Mary's Dream Cabin
Entire Place • 3 bedrooms
Tranquility 125 Ac in Georgia
Entire Place • 3 bedrooms

Modern Georgian | 6 min to I95 | Garage | Patio
Entire Place • 3 bedrooms
Tranquil river cabin with a 1950’s vibe
Entire Place • 1 bedroom
Note: Performance varies based on location, size, amenities, seasonality, and management quality. Data reflects the past 12 months.
Top Performing Airbnb Hosts in Kingsland (2026)
Learn from the best! This table showcases top-performing Airbnb hosts in Kingsland based on the number of properties managed and estimated total revenue over the past year. Analyze their scale and performance metrics.
| Host Name | Properties | Grossing Revenue | Stay Reviews | Avg Rating |
|---|---|---|---|---|
| Airless LLC | 1 | $60,948 | 64 | 4.97/5.0 |
| Catharine | 1 | $44,631 | 64 | 4.91/5.0 |
| Jeff And Lynn | 1 | $44,058 | 44 | 4.93/5.0 |
| Kyrylo | 1 | $40,808 | 33 | 4.85/5.0 |
| Adam And Victoria | 1 | $36,960 | 42 | 4.93/5.0 |
| Grace'S ABNB | 3 | $36,944 | 147 | 4.46/5.0 |
| Wendy | 1 | $32,993 | 240 | 4.99/5.0 |
| Skip | 1 | $31,542 | 43 | 4.95/5.0 |
| Sersie | 1 | $28,523 | 65 | 4.86/5.0 |
| Golden Isles Retreats | 1 | $26,404 | 27 | 4.52/5.0 |
Analyzing the strategies of top hosts, such as their property selection, pricing, and guest communication, can offer valuable lessons for optimizing your own Airbnb operations in Kingsland.
Dive Deeper: Advanced Kingsland STR Market Data (2026)
Ready to unlock more insights? AirROI provides access to advanced metrics and comprehensive Airbnb data for Kingsland. Explore detailed analytics beyond this report to refine your investment strategy, optimize pricing, and maximize your vacation rental profits.
Explore Advanced MetricsKingsland Short-Term Rental Market Composition (2026): Property & Room Types
Room Type Distribution
Property Type Distribution
Market Composition Insights for Kingsland
- The Kingsland Airbnb market composition is heavily skewed towards Entire Home/Apt listings, which make up 100% of the 20 active rentals. This indicates strong guest preference for privacy and space.
- Looking at the property type distribution in Kingsland, House properties are the most common (70%), reflecting the local real estate landscape.
- Houses represent a significant 70% portion, catering likely to families or larger groups.
Kingsland Airbnb Room Capacity Analysis (2026): Bedroom Distribution
Distribution of Listings by Number of Bedrooms
Room Capacity Insights for Kingsland
- The dominant room capacity in Kingsland is 3 bedrooms listings, making up 45% of the market. This suggests a strong demand for properties suitable for families or small groups.
- Together, 3 bedrooms and 4 bedrooms properties represent 65.0% of the active Airbnb listings in Kingsland, indicating a high concentration in these sizes.
- A significant 65.0% of listings offer 3+ bedrooms, catering to larger groups and families seeking more space in Kingsland.
Kingsland Vacation Rental Guest Capacity Trends (2026)
Distribution of Listings by Guest Capacity
Guest Capacity Insights for Kingsland
- The most common guest capacity trend in Kingsland vacation rentals is listings accommodating 8+ guests (30%). This suggests the primary traveler segment is likely larger groups.
- Properties designed for 8+ guests and 4 guests dominate the Kingsland STR market, accounting for 55.0% of listings.
- 60.0% of properties accommodate 6+ guests, serving the market segment for larger families or group travel in Kingsland.
- On average, properties in Kingsland are equipped to host 5.6 guests.
Kingsland Airbnb Booking Patterns (2026): Available vs. Booked Days
Available Days Distribution
Booked Days Distribution
Booking Pattern Insights for Kingsland
- The most common availability pattern in Kingsland falls within the 271-366 days range, representing 35% of listings. This suggests many properties have significant open periods on their calendars.
- Approximately 65.0% of listings show high availability (181+ days open annually), indicating potential for increased bookings or specific owner usage patterns.
- For booked days, the 91-180 days range is most frequent in Kingsland (30%), reflecting common guest stay durations or potential owner blocking patterns.
- A notable 35.0% of properties secure long booking periods (181+ days booked per year), highlighting successful long-term rental strategies or significant owner usage.
Kingsland Airbnb Minimum Stay Requirements Analysis
Distribution of Listings by Minimum Night Requirement
1 Night
3 listings
15% of total
2 Nights
5 listings
25% of total
3 Nights
2 listings
10% of total
4-6 Nights
5 listings
25% of total
30+ Nights
5 listings
25% of total
Key Insights
- The most prevalent minimum stay requirement in Kingsland is 2 Nights, adopted by 25% of listings. This highlights the market's preference for shorter, flexible bookings.
- A significant segment (25%) caters to monthly stays (30+ nights) in Kingsland, pointing to opportunities in the extended-stay market.
Recommendations
- Align with the market by considering a 2 Nights minimum stay, as 25% of Kingsland hosts use this setting.
- If feasible, allowing 1-night stays, especially midweek or during low season, could capture last-minute bookings, as only 15% currently do.
- Explore offering discounts for stays of 30+ nights to attract the 25% of the market seeking extended stays.
- Adjust minimum nights based on seasonality – potentially shorter during low season and longer during peak demand periods in Kingsland.
Kingsland Airbnb Cancellation Policy Trends Analysis (2026)
Flexible
4 listings
20% of total
Moderate
6 listings
30% of total
Firm
9 listings
45% of total
Strict
1 listings
5% of total
Cancellation Policy Insights for Kingsland
- The prevailing Airbnb cancellation policy trend in Kingsland is Firm, used by 45% of listings.
- There's a relatively balanced mix between guest-friendly (50.0%) and stricter (50.0%) policies, offering choices for different guest needs.
- Strict cancellation policies are quite rare (5%), potentially making listings with this policy less competitive unless justified by high demand or property type.
Recommendations for Hosts
- Consider adopting a Firm policy to align with the 45% market standard in Kingsland.
- Using a Strict policy might deter some guests, as only 5% of listings use it. Evaluate if potential revenue protection outweighs possible lower booking rates.
- Regularly review your cancellation policy against competitors and market demand shifts in Kingsland.
Kingsland STR Booking Lead Time Analysis (2026)
Average Booking Lead Time by Month
Booking Lead Time Insights for Kingsland
- The overall average booking lead time for vacation rentals in Kingsland is 39 days.
- Guests book furthest in advance for stays during October (average 84 days), likely coinciding with peak travel demand or local events.
- The shortest booking windows occur for stays in February (average 30 days), indicating more last-minute travel plans during this time.
- Seasonally, Fall (70 days avg.) sees the longest lead times, while Summer (37 days avg.) has the shortest, reflecting typical travel planning cycles.
Recommendations for Hosts
- Use the overall average lead time (39 days) as a baseline for your pricing and availability strategy in Kingsland.
- For October stays, consider implementing length-of-stay discounts or slightly higher rates for bookings made less than 84 days out to capitalize on advance planning.
- Target marketing efforts for the Fall season well in advance (at least 70 days) to capture early planners.
- Monitor your own booking lead times against these Kingsland averages to identify opportunities for dynamic pricing adjustments.
Popular & Essential Airbnb Amenities in Kingsland (2026)
Amenity Prevalence
Amenity Insights for Kingsland
- Essential amenities in Kingsland that guests expect include: Hot water, Air conditioning, TV, Kitchen, Wifi, Bed linens, Coffee maker, Dishes and silverware, Heating. Lacking these (any) could significantly impact bookings.
- Popular amenities like Microwave are common but not universal. Offering these can provide a competitive edge.
Recommendations for Hosts
- Ensure your listing includes all essential amenities for Kingsland: Hot water, Air conditioning, TV, Kitchen, Wifi, Bed linens, Coffee maker, Dishes and silverware, Heating.
- Prioritize adding missing essentials: Bed linens, Coffee maker, Dishes and silverware, Heating.
- Consider adding popular differentiators like Microwave to increase appeal.
- Highlight unique or less common amenities you offer (e.g., hot tub, dedicated workspace, EV charger) in your listing description and photos.
- Regularly check competitor amenities in Kingsland to stay competitive.
Kingsland Airbnb Guest Demographics & Profile Analysis (2026)
Guest Profile Summary for Kingsland
- The typical guest profile for Airbnb in Kingsland consists of primarily domestic travelers (95%), often arriving from nearby Atlanta, typically belonging to the Post-2000s (Gen Z/Alpha) group (50%), primarily speaking English or Spanish.
- Domestic travelers account for 95.3% of guests.
- Key international markets include United States (95.3%) and United Kingdom (1.6%).
- Top languages spoken are English (74.7%) followed by Spanish (12%).
- A significant demographic segment is the Post-2000s (Gen Z/Alpha) group, representing 50% of guests.
Recommendations for Hosts
- Target domestic marketing efforts towards travelers from Atlanta and Jacksonville.
- Tailor amenities and listing descriptions to appeal to the dominant Post-2000s (Gen Z/Alpha) demographic (e.g., highlight fast WiFi, smart home features, local guides).
- Highlight unique local experiences or amenities relevant to the primary guest profile.
- Consider seasonal promotions aligned with peak travel times for key origin markets.
Nearby Short-Term Rental Market Comparison
How does the Kingsland Airbnb market stack up against its neighbors? Compare key performance metrics like average monthly revenue, ADR, and occupancy rates in surrounding areas to understand the broader regional STR landscape.
| Market | Active Properties | Monthly Revenue | Daily Rate | Avg. Occupancy |
|---|---|---|---|---|
| St. Johns County | 12 | $6,964 | $592.43 | 47% |
| Ponte Vedra Beach | 224 | $5,720 | $574.75 | 43% |
| Vilano Beach | 173 | $5,571 | $442.95 | 45% |
| St. Simons | 91 | $4,162 | $379.84 | 42% |
| Jacksonville Beach | 763 | $4,123 | $328.32 | 49% |
| Saint Augustine | 1,749 | $3,586 | $287.24 | 46% |
| Montgomery | 11 | $3,557 | $246.45 | 54% |
| Saint Simons | 902 | $3,532 | $375.60 | 38% |
| Isle of Hope | 32 | $3,502 | $271.42 | 46% |
| Hammock Beach | 197 | $3,498 | $441.99 | 39% |