Rex Airbnb Market Analysis 2025: Short Term Rental Data & Vacation Rental Statistics in Georgia, United States
Is Airbnb profitable in Rex in 2025? Explore comprehensive Airbnb analytics for Rex, Georgia, United States to uncover income potential. This 2025 STR market report for Rex, based on AirROI data from October 2024 to September 2025, reveals key trends in the niche market of 18 active listings.
Whether you're considering an Airbnb investment in Rex, optimizing your existing vacation rental, or exploring rental arbitrage opportunities, understanding the Rex Airbnb data is crucial. Leveraging the low regulation environment is key to maximizing your short term rental income potential. Let's dive into the specifics.
Key Rex Airbnb Performance Metrics Overview
Monthly Airbnb Revenue Variations & Income Potential in Rex (2025)
Understanding the monthly revenue variations for Airbnb listings in Rex is key to maximizing your short term rental income potential. Seasonality significantly impacts earnings. Our analysis, based on data from the past 12 months, shows that the peak revenue month for STRs in Rex is typically July, while February often presents the lowest earnings, highlighting opportunities for strategic pricing adjustments during shoulder and low seasons. Explore the typical Airbnb income in Rex across different performance tiers:
- Best-in-class properties (Top 10%) achieve $9,468+ monthly, often utilizing dynamic pricing and superior guest experiences.
- Strong performing properties (Top 25%) earn $3,459 or more, indicating effective management and desirable locations/amenities.
- Typical properties (Median) generate around $2,083 per month, representing the average market performance.
- Entry-level properties (Bottom 25%) see earnings around $1,310, often with potential for optimization.
Average Monthly Airbnb Earnings Trend in Rex
Rex Airbnb Occupancy Rate Trends (2025)
Maximize your bookings by understanding the Rex STR occupancy trends. Seasonal demand shifts significantly influence how often properties are booked. Typically, Julysees the highest demand (peak season occupancy), while September experiences the lowest (low season). Effective strategies, like adjusting minimum stays or offering promotions, can boost occupancy during slower periods. Here's how different property tiers perform in Rex:
- Best-in-class properties (Top 10%) achieve 78%+ occupancy, indicating high desirability and potentially optimized availability.
- Strong performing properties (Top 25%) maintain 58% or higher occupancy, suggesting good market fit and guest satisfaction.
- Typical properties (Median) have an occupancy rate around 39%.
- Entry-level properties (Bottom 25%) average 24% occupancy, potentially facing higher vacancy.
Average Monthly Occupancy Rate Trend in Rex
Average Daily Rate (ADR) Airbnb Trends in Rex (2025)
Effective short term rental pricing strategy in Rex involves understanding monthly ADR fluctuations. The Average Daily Rate (ADR) for Airbnb in Rex typically peaks in May and dips lowest during February. Leveraging Airbnb dynamic pricing tools or strategies based on this seasonality can significantly boost revenue. Here's a look at the typical nightly rates achieved:
- Best-in-class properties (Top 10%) command rates of $241+ per night, often due to premium features or locations.
- Strong performing properties (Top 25%) achieve nightly rates of $196 or more.
- Typical properties (Median) charge around $127 per night.
- Entry-level properties (Bottom 25%) earn around $73 per night.
Average Daily Rate (ADR) Trend by Month in Rex
Get Live Rex Market Intelligence 👇
Explore Real-time Analytics
Airbnb Seasonality Analysis & Trends in Rex (2025)
Peak Season (July, August, June)
- Revenue averages $4,790 per month
- Occupancy rates average 54.8%
- Daily rates average $173
Shoulder Season
- Revenue averages $2,933 per month
- Occupancy maintains around 41.4%
- Daily rates hold near $148
Low Season (January, February, April)
- Revenue drops to average $2,089 per month
- Occupancy decreases to average 35.3%
- Daily rates adjust to average $133
Seasonality Insights for Rex
- The Airbnb seasonality in Rex shows highly seasonal trends requiring careful strategy. While the sections above show seasonal averages, it's also insightful to look at the extremes:
- During the high season, the absolute peak month showcases Rex's highest earning potential, with monthly revenues capable of climbing to $5,904, occupancy reaching a high of 72.0%, and ADRs peaking at $181.
- Conversely, the slowest single month of the year, typically falling within the low season, marks the market's lowest point. In this month, revenue might dip to $1,913, occupancy could drop to 29.6%, and ADRs may adjust down to $129.
- Understanding both the seasonal averages and these monthly peaks and troughs in revenue, occupancy, and ADR is crucial for maximizing your Airbnb profit potential in Rex.
Seasonal Strategies for Maximizing Profit
- Peak Season: Maximize revenue through premium pricing and potentially longer minimum stays. Ensure high availability.
- Low Season: Offer competitive pricing, special promotions (e.g., extended stay discounts), and flexible cancellation policies. Target off-season travelers like remote workers or budget-conscious guests.
- Shoulder Seasons: Implement dynamic pricing that balances peak and low rates. Target weekend travelers or specific events. Offer slightly more flexible terms than peak season.
- Regularly analyze your own performance against these Rex seasonality benchmarks and adjust your pricing and availability strategy accordingly.
Best Areas for Airbnb Investment in Rex (2025)
Exploring the top neighborhoods for short-term rentals in Rex? This section highlights key areas, outlining why they are attractive for hosts and guests, along with notable local attractions. Consider these locations based on your target guest profile and investment strategy.
| Neighborhood / Area | Why Host Here? (Target Guests & Appeal) | Key Attractions & Landmarks |
|---|---|---|
| Lake Shenandoah | A peaceful community near local parks and recreational activities, ideal for families and nature lovers. Offers a relaxing atmosphere while being close to urban amenities. | Lake Shenandoah Park, Reynolds Nature Preserve, Park at Stonecrest, Local hiking trails, Community events |
| Rex Village Center | The central hub of Rex with shops and dining options. Great for attracting visitors looking for convenience and local experiences. | Rex Village Park, Local dining options, Community events, Shopping centers, Recreational facilities |
| Panther Creek | A family-friendly neighborhood with excellent schools and amenities, perfect for longer stays with families or remote workers. | Panther Creek Park, Local schools, Family-friendly activities, Nearby shopping, Quiet neighborhoods |
| Walden Woods | Quiet woodsy area with proximity to nature. Perfect for those seeking a retreat while still close to urban amenities. | Walden Woods Park, Nature trails, Picnic areas, Local wildlife, Community gatherings |
| Tara Boulevard | Main thoroughfare with high foot traffic and visibility, ideal for attracting short-term guests near public transport. | Nearby shopping centers, Restaurants, Public transport access, Exciting local atmosphere, Local attractions |
| Forest Park | Adjacent to Rex, highly connected with various local events and attractions. Popular with those looking to blend urban and suburban living. | Forest Park Park, Local arts scene, Cultural events, Theater and music venues, Parks and recreation |
| Morrow | Close to major shopping and dining, Morrow is a bustling area with a variety of attractions nearby, appealing to diverse travelers. | Southlake Mall, Restaurants and cafes, Morrow Parks, Business districts, Public transport |
| Eagle's Landing | A suburban neighborhood known for its spacious homes and quality schools, ideal for families visiting for longer stays. | Eagle's Landing Country Club, Parks and sports facilities, Family-oriented activities, Local shops, Community events |
Understanding Airbnb License Requirements & STR Laws in Rex (2025)
While Rex, Georgia, United States currently shows low STR regulations, specific Airbnb license requirements might still exist or change. Always verify the latest short term rental regulations and Airbnb license requirements directly with local government authorities for Rex to ensure full compliance before hosting.
(Source: AirROI data, 2025, based on 6% licensed listings)
Top Performing Airbnb Properties in Rex (2025)
Benchmark your potential! Explore examples of top-performing Airbnb properties in Rexbased on Trailing Twelve Month (TTM) revenue. Analyze their characteristics, revenue, occupancy rate, and ADR to understand what drives success in this market.
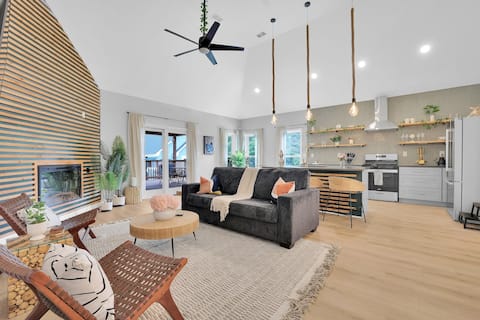
Urban Jungle Resort
Entire Place • 6 bedrooms
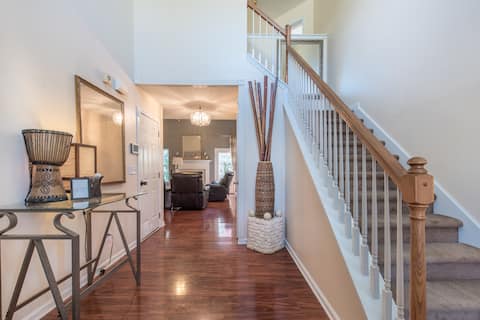
Comfortable and Stylish Home on the Colonnade
Entire Place • 5 bedrooms
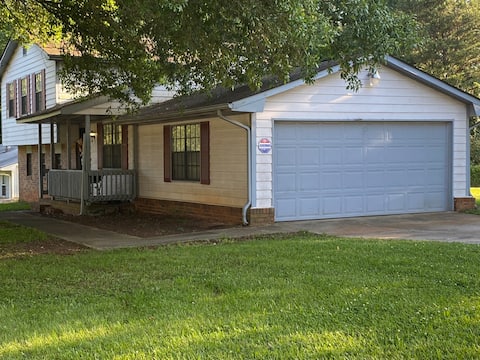
Stagecoach Corners
Entire Place • 3 bedrooms

spivey splash villa
Entire Place • 4 bedrooms
Awesome Jewel in Rex!
Entire Place • 4 bedrooms

Eat, Sleep and be Chic
Entire Place • 4 bedrooms
Note: Performance varies based on location, size, amenities, seasonality, and management quality. Data reflects the past 12 months.
Top Performing Airbnb Hosts in Rex (2025)
Learn from the best! This table showcases top-performing Airbnb hosts in Rex based on the number of properties managed and estimated total revenue over the past year. Analyze their scale and performance metrics.
| Host Name | Properties | Grossing Revenue | Stay Reviews | Avg Rating |
|---|---|---|---|---|
| Charles | 1 | $162,257 | 55 | 4.93/5.0 |
| Daren | 2 | $48,941 | 72 | 4.92/5.0 |
| Ebenezer | 1 | $41,938 | 160 | 4.76/5.0 |
| Tammy | 1 | $27,150 | 29 | 4.86/5.0 |
| Yalonda T. | 1 | $24,060 | 31 | 4.81/5.0 |
| Comfy Chic Retreats | 1 | $23,622 | 126 | 4.76/5.0 |
| Marqua | 1 | $16,052 | 12 | 4.92/5.0 |
| Cathy-Ann | 1 | $13,767 | 36 | 4.78/5.0 |
| Alexis | 1 | $10,632 | 13 | 4.77/5.0 |
| Patrice | 1 | $10,032 | 11 | 4.36/5.0 |
Analyzing the strategies of top hosts, such as their property selection, pricing, and guest communication, can offer valuable lessons for optimizing your own Airbnb operations in Rex.
Dive Deeper: Advanced Rex STR Market Data (2025)
Ready to unlock more insights? AirROI provides access to advanced metrics and comprehensive Airbnb data for Rex. Explore detailed analytics beyond this report to refine your investment strategy, optimize pricing, and maximize your vacation rental profits.
Explore Advanced MetricsRex Short-Term Rental Market Composition (2025): Property & Room Types
Room Type Distribution
Property Type Distribution
Market Composition Insights for Rex
- The Rex Airbnb market composition is heavily skewed towards Entire Home/Apt listings, which make up 83.3% of the 18 active rentals. This indicates strong guest preference for privacy and space.
- Looking at the property type distribution in Rex, House properties are the most common (88.9%), reflecting the local real estate landscape.
- Houses represent a significant 88.9% portion, catering likely to families or larger groups.
Rex Airbnb Room Capacity Analysis (2025): Bedroom Distribution
Distribution of Listings by Number of Bedrooms
Room Capacity Insights for Rex
- The dominant room capacity in Rex is 3 bedrooms listings, making up 38.9% of the market. This suggests a strong demand for properties suitable for families or small groups.
- Together, 3 bedrooms and 4 bedrooms properties represent 61.1% of the active Airbnb listings in Rex, indicating a high concentration in these sizes.
- A significant 77.8% of listings offer 3+ bedrooms, catering to larger groups and families seeking more space in Rex.
Rex Vacation Rental Guest Capacity Trends (2025)
Distribution of Listings by Guest Capacity
Guest Capacity Insights for Rex
- The most common guest capacity trend in Rex vacation rentals is listings accommodating 8+ guests (50%). This suggests the primary traveler segment is likely larger groups.
- Properties designed for 8+ guests and 4 guests dominate the Rex STR market, accounting for 72.2% of listings.
- 61.1% of properties accommodate 6+ guests, serving the market segment for larger families or group travel in Rex.
- On average, properties in Rex are equipped to host 5.8 guests.
Rex Airbnb Booking Patterns (2025): Available vs. Booked Days
Available Days Distribution
Booked Days Distribution
Booking Pattern Insights for Rex
- The most common availability pattern in Rex falls within the 271-366 days range, representing 50% of listings. This suggests many properties have significant open periods on their calendars.
- Approximately 88.9% of listings show high availability (181+ days open annually), indicating potential for increased bookings or specific owner usage patterns.
- For booked days, the 91-180 days range is most frequent in Rex (38.9%), reflecting common guest stay durations or potential owner blocking patterns.
- A notable 11.1% of properties secure long booking periods (181+ days booked per year), highlighting successful long-term rental strategies or significant owner usage.
Rex Airbnb Minimum Stay Requirements Analysis
Distribution of Listings by Minimum Night Requirement
1 Night
2 listings
11.1% of total
2 Nights
7 listings
38.9% of total
3 Nights
2 listings
11.1% of total
7-29 Nights
3 listings
16.7% of total
30+ Nights
4 listings
22.2% of total
Key Insights
- The most prevalent minimum stay requirement in Rex is 2 Nights, adopted by 38.9% of listings. This highlights the market's preference for shorter, flexible bookings.
- A significant segment (22.2%) caters to monthly stays (30+ nights) in Rex, pointing to opportunities in the extended-stay market.
Recommendations
- Align with the market by considering a 2 Nights minimum stay, as 38.9% of Rex hosts use this setting.
- If feasible, allowing 1-night stays, especially midweek or during low season, could capture last-minute bookings, as only 11.1% currently do.
- A 2-night minimum appears standard (38.9%). Consider this for weekends or peak periods.
- Explore offering discounts for stays of 30+ nights to attract the 22.2% of the market seeking extended stays.
- Adjust minimum nights based on seasonality – potentially shorter during low season and longer during peak demand periods in Rex.
Rex Airbnb Cancellation Policy Trends Analysis (2025)
Flexible
6 listings
33.3% of total
Moderate
7 listings
38.9% of total
Firm
3 listings
16.7% of total
Strict
2 listings
11.1% of total
Cancellation Policy Insights for Rex
- The prevailing Airbnb cancellation policy trend in Rex is Moderate, used by 38.9% of listings.
- The market strongly favors guest-friendly terms, with 72.2% of listings offering Flexible or Moderate policies. This suggests guests in Rex may expect booking flexibility.
Recommendations for Hosts
- Consider adopting a Moderate policy to align with the 38.9% market standard in Rex.
- Using a Strict policy might deter some guests, as only 11.1% of listings use it. Evaluate if potential revenue protection outweighs possible lower booking rates.
- Regularly review your cancellation policy against competitors and market demand shifts in Rex.
Rex STR Booking Lead Time Analysis (2025)
Average Booking Lead Time by Month
Booking Lead Time Insights for Rex
- The overall average booking lead time for vacation rentals in Rex is 14 days.
- Guests book furthest in advance for stays during July (average 35 days), likely coinciding with peak travel demand or local events.
- The shortest booking windows occur for stays in January (average 5 days), indicating more last-minute travel plans during this time.
- Seasonally, Summer (28 days avg.) sees the longest lead times, while Winter (11 days avg.) has the shortest, reflecting typical travel planning cycles.
Recommendations for Hosts
- Use the overall average lead time (14 days) as a baseline for your pricing and availability strategy in Rex.
- For July stays, consider implementing length-of-stay discounts or slightly higher rates for bookings made less than 35 days out to capitalize on advance planning.
- During January, focus on last-minute booking availability and promotions, as guests book with very short notice (5 days avg.).
- Target marketing efforts for the Summer season well in advance (at least 28 days) to capture early planners.
- Monitor your own booking lead times against these Rex averages to identify opportunities for dynamic pricing adjustments.
Popular & Essential Airbnb Amenities in Rex (2025)
Amenity Prevalence
Amenity Insights for Rex
- Essential amenities in Rex that guests expect include: Air conditioning, Wifi, Free parking on premises, Smoke alarm. Lacking these (any) could significantly impact bookings.
- Popular amenities like TV, Kitchen, Washer are common but not universal. Offering these can provide a competitive edge.
Recommendations for Hosts
- Ensure your listing includes all essential amenities for Rex: Air conditioning, Wifi, Free parking on premises, Smoke alarm.
- Consider adding popular differentiators like TV or Kitchen to increase appeal.
- Highlight unique or less common amenities you offer (e.g., hot tub, dedicated workspace, EV charger) in your listing description and photos.
- Regularly check competitor amenities in Rex to stay competitive.
Rex Airbnb Guest Demographics & Profile Analysis (2025)
Guest Profile Summary for Rex
- The typical guest profile for Airbnb in Rex consists of primarily domestic travelers (97%), often arriving from nearby Atlanta, typically belonging to the Post-2000s (Gen Z/Alpha) group (50%), primarily speaking English or Spanish.
- Domestic travelers account for 97.3% of guests.
- Key international markets include United States (97.3%) and Mexico (1.4%).
- Top languages spoken are English (67.3%) followed by Spanish (26.5%).
- A significant demographic segment is the Post-2000s (Gen Z/Alpha) group, representing 50% of guests.
Recommendations for Hosts
- Target domestic marketing efforts towards travelers from Atlanta and Philadelphia.
- Tailor amenities and listing descriptions to appeal to the dominant Post-2000s (Gen Z/Alpha) demographic (e.g., highlight fast WiFi, smart home features, local guides).
- Highlight unique local experiences or amenities relevant to the primary guest profile.
- Consider seasonal promotions aligned with peak travel times for key origin markets.
Nearby Short-Term Rental Market Comparison
How does the Rex Airbnb market stack up against its neighbors? Compare key performance metrics like average monthly revenue, ADR, and occupancy rates in surrounding areas to understand the broader regional STR landscape.
| Market | Active Properties | Monthly Revenue | Daily Rate | Avg. Occupancy |
|---|---|---|---|---|
| Gilmer County | 22 | $4,665 | $373.12 | 40% |
| Fannin County | 37 | $4,440 | $401.70 | 39% |
| Cedar Bluff | 32 | $4,323 | $407.03 | 37% |
| Waleska | 44 | $4,215 | $364.09 | 43% |
| Eatonton | 234 | $4,145 | $477.44 | 33% |
| Epworth | 71 | $4,089 | $384.34 | 39% |
| Bishop | 12 | $3,918 | $497.24 | 33% |
| Jacksons' Gap | 48 | $3,902 | $456.73 | 37% |
| East Ellijay | 16 | $3,787 | $344.31 | 38% |
| Greensboro | 36 | $3,711 | $530.93 | 29% |