Waleska Airbnb Market Analysis 2026: Short Term Rental Data & Vacation Rental Statistics in Georgia, United States
Is Airbnb profitable in Waleska in 2026? Explore comprehensive Airbnb analytics for Waleska, Georgia, United States to uncover income potential. This 2026 STR market report for Waleska, based on AirROI data from February 2025 to January 2026, reveals key trends in the niche market of 45 active listings.
Whether you're considering an Airbnb investment in Waleska, optimizing your existing vacation rental, or exploring rental arbitrage opportunities, understanding the Waleska Airbnb data is crucial. Leveraging the low regulation environment is key to maximizing your short term rental income potential. Let's dive into the specifics.
Key Waleska Airbnb Performance Metrics Overview
Monthly Airbnb Revenue Variations & Income Potential in Waleska (2026)
Understanding the monthly revenue variations for Airbnb listings in Waleska is key to maximizing your short term rental income potential. Seasonality significantly impacts earnings. Our analysis, based on data from the past 12 months, shows that the peak revenue month for STRs in Waleska is typically July, while January often presents the lowest earnings, highlighting opportunities for strategic pricing adjustments during shoulder and low seasons. Explore the typical Airbnb income in Waleska across different performance tiers:
- Best-in-class properties (Top 10%) achieve $9,667+ monthly, often utilizing dynamic pricing and superior guest experiences.
- Strong performing properties (Top 25%) earn $6,910 or more, indicating effective management and desirable locations/amenities.
- Typical properties (Median) generate around $3,853 per month, representing the average market performance.
- Entry-level properties (Bottom 25%) see earnings around $2,224, often with potential for optimization.
Average Monthly Airbnb Earnings Trend in Waleska
Waleska Airbnb Occupancy Rate Trends (2026)
Maximize your bookings by understanding the Waleska STR occupancy trends. Seasonal demand shifts significantly influence how often properties are booked. Typically, Julysees the highest demand (peak season occupancy), while January experiences the lowest (low season). Effective strategies, like adjusting minimum stays or offering promotions, can boost occupancy during slower periods. Here's how different property tiers perform in Waleska:
- Best-in-class properties (Top 10%) achieve 75%+ occupancy, indicating high desirability and potentially optimized availability.
- Strong performing properties (Top 25%) maintain 56% or higher occupancy, suggesting good market fit and guest satisfaction.
- Typical properties (Median) have an occupancy rate around 38%.
- Entry-level properties (Bottom 25%) average 23% occupancy, potentially facing higher vacancy.
Average Monthly Occupancy Rate Trend in Waleska
Average Daily Rate (ADR) Airbnb Trends in Waleska (2026)
Effective short term rental pricing strategy in Waleska involves understanding monthly ADR fluctuations. The Average Daily Rate (ADR) for Airbnb in Waleska typically peaks in December and dips lowest during February. Leveraging Airbnb dynamic pricing tools or strategies based on this seasonality can significantly boost revenue. Here's a look at the typical nightly rates achieved:
- Best-in-class properties (Top 10%) command rates of $598+ per night, often due to premium features or locations.
- Strong performing properties (Top 25%) achieve nightly rates of $485 or more.
- Typical properties (Median) charge around $343 per night.
- Entry-level properties (Bottom 25%) earn around $253 per night.
Average Daily Rate (ADR) Trend by Month in Waleska
Get Live Waleska Market Intelligence 👇

Explore Real-time Analytics
Airbnb Seasonality Analysis & Trends in Waleska (2026)
Peak Season (July, June, August)
- Revenue averages $7,502 per month
- Occupancy rates average 59.8%
- Daily rates average $383
Shoulder Season
- Revenue averages $4,402 per month
- Occupancy maintains around 36.8%
- Daily rates hold near $375
Low Season (January, February, March)
- Revenue drops to average $2,977 per month
- Occupancy decreases to average 30.9%
- Daily rates adjust to average $343
Seasonality Insights for Waleska
- The Airbnb seasonality in Waleska shows highly seasonal trends requiring careful strategy. While the sections above show seasonal averages, it's also insightful to look at the extremes:
- During the high season, the absolute peak month showcases Waleska's highest earning potential, with monthly revenues capable of climbing to $8,834, occupancy reaching a high of 68.8%, and ADRs peaking at $392.
- Conversely, the slowest single month of the year, typically falling within the low season, marks the market's lowest point. In this month, revenue might dip to $2,350, occupancy could drop to 20.9%, and ADRs may adjust down to $328.
- Understanding both the seasonal averages and these monthly peaks and troughs in revenue, occupancy, and ADR is crucial for maximizing your Airbnb profit potential in Waleska.
Seasonal Strategies for Maximizing Profit
- Peak Season: Maximize revenue through premium pricing and potentially longer minimum stays. Ensure high availability.
- Low Season: Offer competitive pricing, special promotions (e.g., extended stay discounts), and flexible cancellation policies. Target off-season travelers like remote workers or budget-conscious guests.
- Shoulder Seasons: Implement dynamic pricing that balances peak and low rates. Target weekend travelers or specific events. Offer slightly more flexible terms than peak season.
- Regularly analyze your own performance against these Waleska seasonality benchmarks and adjust your pricing and availability strategy accordingly.
Best Areas for Airbnb Investment in Waleska (2026)
Exploring the top neighborhoods for short-term rentals in Waleska? This section highlights key areas, outlining why they are attractive for hosts and guests, along with notable local attractions. Consider these locations based on your target guest profile and investment strategy.
| Neighborhood / Area | Why Host Here? (Target Guests & Appeal) | Key Attractions & Landmarks |
|---|---|---|
| Lake Allatoona | A popular destination for outdoor enthusiasts, fishing, and boating. This scenic lake attracts families and groups looking for a relaxing getaway, making it ideal for Airbnb hosting. | Red Top Mountain State Park, Allatoona Lake, Lakepoint Sports Complex, Beaver Lake, AJ's Lakeside, Park Marina |
| Downtown Woodstock | A vibrant area known for its charming shops, eateries, and live music venues. This area appeals to visitors looking for a lively atmosphere and community events. | Woodstock Arts, The Woodstock Enduro, Elm Street Cultural Arts Village, Northside Hospital-Cherokee Amphitheater, Reformation Brewery, The Park at City Center |
| Kennesaw Mountain National Battlefield Park | A historic site offering hiking, history, and beautiful views. Attracts nature lovers, history buffs, and families who enjoy outdoor activities. | Kennesaw Mountain, Gettysburg of the South, Kennesaw Mountain Battlefield, Historic Koenig House, Batter Park, The Big House |
| Cherokee County | Known for its scenic views and outdoor recreational activities. Ideal for guests who love nature and seeking a quiet retreat away from the city. | Etowah River Park, Olde Rope Mill Park, Canton Riverwalk, Tanyard Creek Overlook, Cherokee County History Museum, Waleska Parks and Recreation |
| Canton | A growing city with a historic downtown, providing a mix of modern conveniences and charming local culture. Attractive for families and business travelers alike. | Canton Historic Depot, Canton Theater, The Blankets Creek Trails, Etowah River Park, Canton Marketplace, Cherokee Arts Center |
| Ball Ground | A small town with a close-knit community offering a tranquil lifestyle. Perfect for those who want to escape the hustle and bustle of city life. | Ball Ground Park, Goblins Drop Adventure Park, Historic Ball Ground, Mason’s 5 & Dime, Ball Ground Library, Recreational facilities |
| Holly Springs | A rapidly growing city close to major highways, offering easy access to nearby attractions. It's an appealing spot for visitors wanting convenience and comfort. | Holly Springs Town Center, Bells Ferry Park, Woody’s Park, Holly Springs Lake, Rush Park, Wildcat Creek Park |
| Waleska | An emerging location with a serene atmosphere near Reinhardt University. It attracts students and families looking for peaceful stays with educational attractions. | Reinhardt University, Waleska City Park, Lake Arrowhead, Waleska Nature Trail, Cherokee County Historical Society, Local dining spots |
Understanding Airbnb License Requirements & STR Laws in Waleska (2026)
While Waleska, Georgia, United States currently shows low STR regulations, specific Airbnb license requirements might still exist or change. Always verify the latest short term rental regulations and Airbnb license requirements directly with local government authorities for Waleska to ensure full compliance before hosting.
(Source: AirROI data, 2026, finding no licensed listings among those analyzed)
Top Performing Airbnb Properties in Waleska (2026)
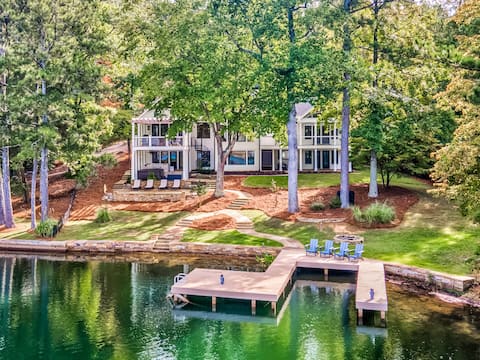
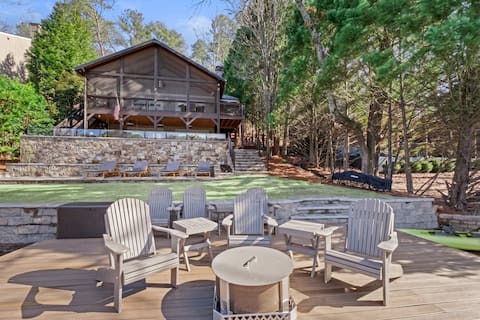
Benchmark your potential! Explore examples of top-performing Airbnb properties in Waleskabased on Trailing Twelve Month (TTM) revenue. Analyze their characteristics, revenue, occupancy rate, and ADR to understand what drives success in this market.

*Lakefront 5BR home*Indoor pool+sauna+game room
Entire Place • 5 bedrooms

Luxe Arrowhead Lakefront 4 Br~Hot Tub~Pool Table
Entire Place • 4 bedrooms
Luxury Lakefront | Hot Tub | Movie Room | Fire Pit
Entire Place • 5 bedrooms
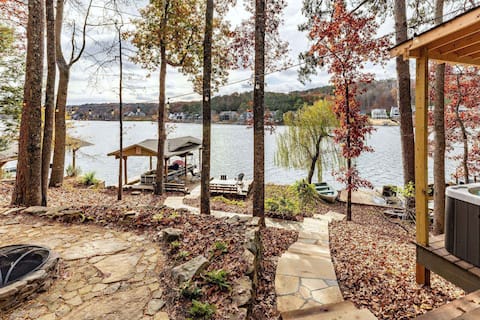
Lake Front Home w/Dock, Kayaks Fire Pit & Hot Tub
Entire Place • 5 bedrooms
Luxury Lakefront Retreat w/ Hot Tub!
Entire Place • 3 bedrooms

Lake Arrowhead Oasis - Luxury Rental
Entire Place • 5 bedrooms
Note: Performance varies based on location, size, amenities, seasonality, and management quality. Data reflects the past 12 months.
Top Performing Airbnb Hosts in Waleska (2026)
Learn from the best! This table showcases top-performing Airbnb hosts in Waleska based on the number of properties managed and estimated total revenue over the past year. Analyze their scale and performance metrics.
| Host Name | Properties | Grossing Revenue | Stay Reviews | Avg Rating |
|---|---|---|---|---|
| Ralph | 7 | $295,044 | 96 | 4.69/5.0 |
| Justin&Vicky | 1 | $140,438 | 83 | 4.87/5.0 |
| Tyler | 2 | $137,971 | 254 | 4.86/5.0 |
| Kylie | 1 | $126,247 | 34 | 4.88/5.0 |
| Kelsey | 1 | $111,639 | 75 | 4.99/5.0 |
| Robert | 2 | $98,753 | 76 | 4.96/5.0 |
| Brian | 1 | $95,908 | 85 | 4.99/5.0 |
| Adams | 1 | $91,050 | 46 | 5.00/5.0 |
| Southern Comfort | 1 | $90,681 | 29 | 4.76/5.0 |
| Scott | 2 | $90,116 | 56 | 5.00/5.0 |
Analyzing the strategies of top hosts, such as their property selection, pricing, and guest communication, can offer valuable lessons for optimizing your own Airbnb operations in Waleska.
Dive Deeper: Advanced Waleska STR Market Data (2026)
Ready to unlock more insights? AirROI provides access to advanced metrics and comprehensive Airbnb data for Waleska. Explore detailed analytics beyond this report to refine your investment strategy, optimize pricing, and maximize your vacation rental profits.
Explore Advanced MetricsWaleska Short-Term Rental Market Composition (2026): Property & Room Types
Room Type Distribution
Property Type Distribution
Market Composition Insights for Waleska
- The Waleska Airbnb market composition is heavily skewed towards Entire Home/Apt listings, which make up 100% of the 45 active rentals. This indicates strong guest preference for privacy and space.
- Looking at the property type distribution in Waleska, House properties are the most common (88.9%), reflecting the local real estate landscape.
- Houses represent a significant 88.9% portion, catering likely to families or larger groups.
- Smaller segments like apartment/condo (combined 4.4%) offer potential for unique stay experiences.
Waleska Airbnb Room Capacity Analysis (2026): Bedroom Distribution
Distribution of Listings by Number of Bedrooms
Room Capacity Insights for Waleska
- The dominant room capacity in Waleska is 3 bedrooms listings, making up 37.8% of the market. This suggests a strong demand for properties suitable for families or small groups.
- Together, 3 bedrooms and 2 bedrooms properties represent 60.0% of the active Airbnb listings in Waleska, indicating a high concentration in these sizes.
- A significant 75.6% of listings offer 3+ bedrooms, catering to larger groups and families seeking more space in Waleska.
Waleska Vacation Rental Guest Capacity Trends (2026)
Distribution of Listings by Guest Capacity
Guest Capacity Insights for Waleska
- The most common guest capacity trend in Waleska vacation rentals is listings accommodating 8+ guests (62.2%). This suggests the primary traveler segment is likely larger groups.
- Properties designed for 8+ guests and 6 guests dominate the Waleska STR market, accounting for 82.2% of listings.
- 84.4% of properties accommodate 6+ guests, serving the market segment for larger families or group travel in Waleska.
- On average, properties in Waleska are equipped to host 6.9 guests.
Waleska Airbnb Booking Patterns (2026): Available vs. Booked Days
Available Days Distribution
Booked Days Distribution
Booking Pattern Insights for Waleska
- The most common availability pattern in Waleska falls within the 181-270 days range, representing 48.9% of listings. This suggests many properties have significant open periods on their calendars.
- Approximately 82.2% of listings show high availability (181+ days open annually), indicating potential for increased bookings or specific owner usage patterns.
- For booked days, the 91-180 days range is most frequent in Waleska (46.7%), reflecting common guest stay durations or potential owner blocking patterns.
- A notable 20.0% of properties secure long booking periods (181+ days booked per year), highlighting successful long-term rental strategies or significant owner usage.
Waleska Airbnb Minimum Stay Requirements Analysis
Distribution of Listings by Minimum Night Requirement
1 Night
1 listings
2.2% of total
2 Nights
10 listings
22.2% of total
3 Nights
5 listings
11.1% of total
4-6 Nights
3 listings
6.7% of total
30+ Nights
26 listings
57.8% of total
Key Insights
- The most prevalent minimum stay requirement in Waleska is 30+ Nights, adopted by 57.8% of listings. This highlights the market's preference for longer commitments.
- A significant segment (57.8%) caters to monthly stays (30+ nights) in Waleska, pointing to opportunities in the extended-stay market.
Recommendations
- Align with the market by considering a 30+ Nights minimum stay, as 57.8% of Waleska hosts use this setting.
- If feasible, allowing 1-night stays, especially midweek or during low season, could capture last-minute bookings, as only 2.2% currently do.
- Explore offering discounts for stays of 30+ nights to attract the 57.8% of the market seeking extended stays.
- Adjust minimum nights based on seasonality – potentially shorter during low season and longer during peak demand periods in Waleska.
Waleska Airbnb Cancellation Policy Trends Analysis (2026)
Flexible
4 listings
8.9% of total
Moderate
13 listings
28.9% of total
Firm
15 listings
33.3% of total
Strict
13 listings
28.9% of total
Cancellation Policy Insights for Waleska
- The prevailing Airbnb cancellation policy trend in Waleska is Firm, used by 33.3% of listings.
- A majority (62.2%) of hosts in Waleska utilize Firm or Strict policies, indicating a market where hosts prioritize booking security.
Recommendations for Hosts
- Consider adopting a Firm policy to align with the 33.3% market standard in Waleska.
- Regularly review your cancellation policy against competitors and market demand shifts in Waleska.
Waleska STR Booking Lead Time Analysis (2026)
Average Booking Lead Time by Month
Booking Lead Time Insights for Waleska
- The overall average booking lead time for vacation rentals in Waleska is 54 days.
- Guests book furthest in advance for stays during July (average 97 days), likely coinciding with peak travel demand or local events.
- The shortest booking windows occur for stays in February (average 25 days), indicating more last-minute travel plans during this time.
- Seasonally, Summer (79 days avg.) sees the longest lead times, while Winter (33 days avg.) has the shortest, reflecting typical travel planning cycles.
Recommendations for Hosts
- Use the overall average lead time (54 days) as a baseline for your pricing and availability strategy in Waleska.
- For July stays, consider implementing length-of-stay discounts or slightly higher rates for bookings made less than 97 days out to capitalize on advance planning.
- Target marketing efforts for the Summer season well in advance (at least 79 days) to capture early planners.
- Monitor your own booking lead times against these Waleska averages to identify opportunities for dynamic pricing adjustments.
Popular & Essential Airbnb Amenities in Waleska (2026)
Amenity Prevalence
Amenity Insights for Waleska
- Essential amenities in Waleska that guests expect include: Wifi, Smoke alarm, TV, Air conditioning, Free parking on premises, Kitchen, Washer, Heating. Lacking these (any) could significantly impact bookings.
- Popular amenities like Refrigerator, Coffee maker are common but not universal. Offering these can provide a competitive edge.
Recommendations for Hosts
- Ensure your listing includes all essential amenities for Waleska: Wifi, Smoke alarm, TV, Air conditioning, Free parking on premises, Kitchen, Washer, Heating.
- Prioritize adding missing essentials: Free parking on premises, Kitchen, Washer, Heating.
- Consider adding popular differentiators like Refrigerator or Coffee maker to increase appeal.
- Highlight unique or less common amenities you offer (e.g., hot tub, dedicated workspace, EV charger) in your listing description and photos.
- Regularly check competitor amenities in Waleska to stay competitive.
Waleska Airbnb Guest Demographics & Profile Analysis (2026)
Guest Profile Summary for Waleska
- The typical guest profile for Airbnb in Waleska consists of primarily domestic travelers (99%), often arriving from nearby Atlanta, typically belonging to the Post-2000s (Gen Z/Alpha) group (50%), primarily speaking English or Spanish.
- Domestic travelers account for 98.7% of guests.
- Key international markets include United States (98.7%) and Bermuda (0.4%).
- Top languages spoken are English (76.8%) followed by Spanish (7.3%).
- A significant demographic segment is the Post-2000s (Gen Z/Alpha) group, representing 50% of guests.
Recommendations for Hosts
- Target domestic marketing efforts towards travelers from Atlanta and Alpharetta.
- Tailor amenities and listing descriptions to appeal to the dominant Post-2000s (Gen Z/Alpha) demographic (e.g., highlight fast WiFi, smart home features, local guides).
- Highlight unique local experiences or amenities relevant to the primary guest profile.
- Consider seasonal promotions aligned with peak travel times for key origin markets.
Nearby Short-Term Rental Market Comparison
How does the Waleska Airbnb market stack up against its neighbors? Compare key performance metrics like average monthly revenue, ADR, and occupancy rates in surrounding areas to understand the broader regional STR landscape.
| Market | Active Properties | Monthly Revenue | Daily Rate | Avg. Occupancy |
|---|---|---|---|---|
| Sevier County | 68 | $7,108 | $567.95 | 44% |
| Bogart | 13 | $5,528 | $637.81 | 35% |
| Gilmer County | 26 | $5,298 | $459.59 | 40% |
| Sevierville | 6,269 | $4,747 | $370.20 | 46% |
| Fannin County | 42 | $4,574 | $435.93 | 38% |
| East Ellijay | 15 | $4,415 | $368.05 | 41% |
| Epworth | 79 | $4,411 | $406.97 | 40% |
| Gatlinburg | 3,565 | $4,385 | $353.70 | 45% |
| Commerce | 19 | $4,298 | $285.34 | 45% |
| Eatonton | 236 | $4,178 | $502.80 | 33% |