Hagåtña Airbnb Market Analysis 2026: Short Term Rental Data & Vacation Rental Statistics in Guam, United States
Is Airbnb profitable in Hagåtña in 2026? Explore comprehensive Airbnb analytics for Hagåtña, Guam, United States to uncover income potential. This 2026 STR market report for Hagåtña, based on AirROI data from February 2025 to January 2026, reveals key trends in the niche market of 29 active listings.
Whether you're considering an Airbnb investment in Hagåtña, optimizing your existing vacation rental, or exploring rental arbitrage opportunities, understanding the Hagåtña Airbnb data is crucial. Leveraging the low regulation environment is key to maximizing your short term rental income potential. Let's dive into the specifics.
Key Hagåtña Airbnb Performance Metrics Overview
Monthly Airbnb Revenue Variations & Income Potential in Hagåtña (2026)
Understanding the monthly revenue variations for Airbnb listings in Hagåtña is key to maximizing your short term rental income potential. Seasonality significantly impacts earnings. Our analysis, based on data from the past 12 months, shows that the peak revenue month for STRs in Hagåtña is typically July, while May often presents the lowest earnings, highlighting opportunities for strategic pricing adjustments during shoulder and low seasons. Explore the typical Airbnb income in Hagåtña across different performance tiers:
- Best-in-class properties (Top 10%) achieve $4,045+ monthly, often utilizing dynamic pricing and superior guest experiences.
- Strong performing properties (Top 25%) earn $2,160 or more, indicating effective management and desirable locations/amenities.
- Typical properties (Median) generate around $1,264 per month, representing the average market performance.
- Entry-level properties (Bottom 25%) see earnings around $610, often with potential for optimization.
Average Monthly Airbnb Earnings Trend in Hagåtña
Hagåtña Airbnb Occupancy Rate Trends (2026)
Maximize your bookings by understanding the Hagåtña STR occupancy trends. Seasonal demand shifts significantly influence how often properties are booked. Typically, Julysees the highest demand (peak season occupancy), while January experiences the lowest (low season). Effective strategies, like adjusting minimum stays or offering promotions, can boost occupancy during slower periods. Here's how different property tiers perform in Hagåtña:
- Best-in-class properties (Top 10%) achieve 59%+ occupancy, indicating high desirability and potentially optimized availability.
- Strong performing properties (Top 25%) maintain 38% or higher occupancy, suggesting good market fit and guest satisfaction.
- Typical properties (Median) have an occupancy rate around 22%.
- Entry-level properties (Bottom 25%) average 11% occupancy, potentially facing higher vacancy.
Average Monthly Occupancy Rate Trend in Hagåtña
Average Daily Rate (ADR) Airbnb Trends in Hagåtña (2026)
Effective short term rental pricing strategy in Hagåtña involves understanding monthly ADR fluctuations. The Average Daily Rate (ADR) for Airbnb in Hagåtña typically peaks in February and dips lowest during September. Leveraging Airbnb dynamic pricing tools or strategies based on this seasonality can significantly boost revenue. Here's a look at the typical nightly rates achieved:
- Best-in-class properties (Top 10%) command rates of $475+ per night, often due to premium features or locations.
- Strong performing properties (Top 25%) achieve nightly rates of $332 or more.
- Typical properties (Median) charge around $162 per night.
- Entry-level properties (Bottom 25%) earn around $132 per night.
Average Daily Rate (ADR) Trend by Month in Hagåtña
Get Live Hagåtña Market Intelligence 👇

Explore Real-time Analytics
Airbnb Seasonality Analysis & Trends in Hagåtña (2026)
Peak Season (July, February, August)
- Revenue averages $2,403 per month
- Occupancy rates average 37.2%
- Daily rates average $264
Shoulder Season
- Revenue averages $1,683 per month
- Occupancy maintains around 26.2%
- Daily rates hold near $237
Low Season (January, May, October)
- Revenue drops to average $1,189 per month
- Occupancy decreases to average 19.7%
- Daily rates adjust to average $245
Seasonality Insights for Hagåtña
- The Airbnb seasonality in Hagåtña shows highly seasonal trends requiring careful strategy. While the sections above show seasonal averages, it's also insightful to look at the extremes:
- During the high season, the absolute peak month showcases Hagåtña's highest earning potential, with monthly revenues capable of climbing to $3,154, occupancy reaching a high of 47.1%, and ADRs peaking at $291.
- Conversely, the slowest single month of the year, typically falling within the low season, marks the market's lowest point. In this month, revenue might dip to $977, occupancy could drop to 17.4%, and ADRs may adjust down to $205.
- Understanding both the seasonal averages and these monthly peaks and troughs in revenue, occupancy, and ADR is crucial for maximizing your Airbnb profit potential in Hagåtña.
Seasonal Strategies for Maximizing Profit
- Peak Season: Maximize revenue through premium pricing and potentially longer minimum stays. Ensure high availability.
- Low Season: Offer competitive pricing, special promotions (e.g., extended stay discounts), and flexible cancellation policies. Target off-season travelers like remote workers or budget-conscious guests.
- Shoulder Seasons: Implement dynamic pricing that balances peak and low rates. Target weekend travelers or specific events. Offer slightly more flexible terms than peak season.
- Regularly analyze your own performance against these Hagåtña seasonality benchmarks and adjust your pricing and availability strategy accordingly.
Best Areas for Airbnb Investment in Hagåtña (2026)
Exploring the top neighborhoods for short-term rentals in Hagåtña? This section highlights key areas, outlining why they are attractive for hosts and guests, along with notable local attractions. Consider these locations based on your target guest profile and investment strategy.
| Neighborhood / Area | Why Host Here? (Target Guests & Appeal) | Key Attractions & Landmarks |
|---|---|---|
| Hagåtña Plaza | The heart of Hagåtña, this area is rich in culture and history, making it a great spot for tourists. Close to many government buildings and cultural sites. | Hagåtña Cathedral, Plaza de España, Hagåtña Boat Basin, Guam Museum, Statue of Liberty, Hagåtña War Memorial |
| Agana Shopping Center | A popular shopping destination with a variety of shops and restaurants. This location sees a lot of foot traffic from locals and tourists alike. | Agana Shopping Center, Dulce Nombre de Maria Cathedral, Micronesia Mall, Government of Guam Building, Hagåtña Heritage House |
| Chamorro Village | Known for its vibrant night market and cultural gatherings, this area attracts food lovers and those interested in Chamorro culture. | Chamorro Village Night Market, Cultural performances, Local artisan shops |
| Ritidian Point | A beautiful natural reserve known for its stunning beaches and wildlife, perfect for nature lovers and beach enthusiasts. | Ritidian Beach, Guam National Wildlife Refuge, Scenic hiking trails |
| Two Lovers Point | A cliffside park known for its views of Tumon Bay and the legendary story behind it. A romantic spot popular with couples. | Two Lovers Point, Tumon Bay overlooks |
| Tumon Bay | The tourism hub of Guam, known for its beautiful beaches and vast array of hotels, restaurants, and entertainment options. | Tumon Beach, Resort World Guam, Underwater World Guam, The Plaza Shopping Center |
| Mangilao | A more residential area with access to golf courses and other outdoor activities, attracting families and golf enthusiasts. | Mangilao Golf Course, Father Duenas Memorial School, Tamuning Shopping Center |
| Ylig Bay | A tranquil bay area known for its stunning sunsets and relaxed atmosphere, appealing to those seeking peace away from the tourist crowds. | Ylig Bay Beach, Scenic views, Water sports |
Understanding Airbnb License Requirements & STR Laws in Hagåtña (2026)
While Hagåtña, Guam, United States currently shows low STR regulations, specific Airbnb license requirements might still exist or change. Always verify the latest short term rental regulations and Airbnb license requirements directly with local government authorities for Hagåtña to ensure full compliance before hosting.
(Source: AirROI data, 2026, finding no licensed listings among those analyzed)
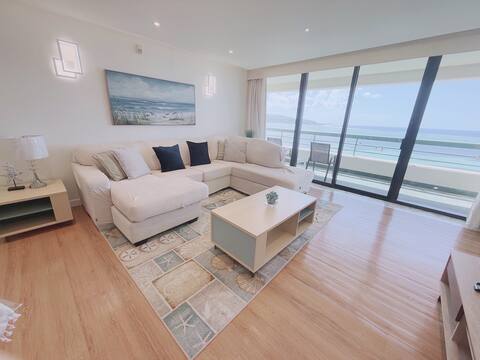
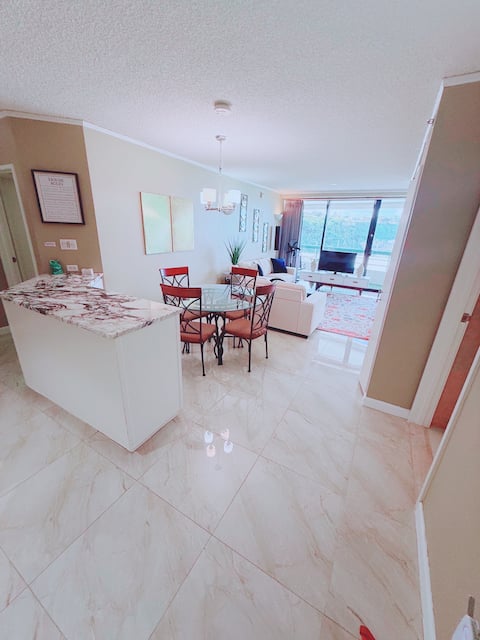
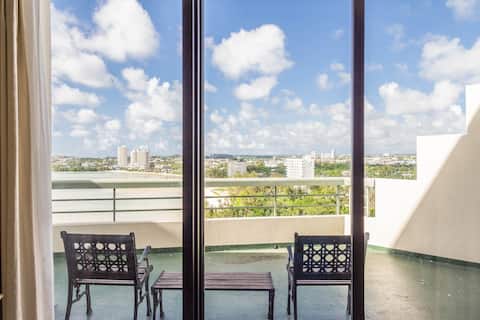
Top Performing Airbnb Properties in Hagåtña (2026)
Benchmark your potential! Explore examples of top-performing Airbnb properties in Hagåtñabased on Trailing Twelve Month (TTM) revenue. Analyze their characteristics, revenue, occupancy rate, and ADR to understand what drives success in this market.

All room beautiful ocean view♡Direct to the beach!
Entire Place • 3 bedrooms
Ocean front corner unit with amazing view
Entire Place • 3 bedrooms
Amazing ocean front condo
Entire Place • 3 bedrooms
Penthouse Condominium 1 (3-Bed/2-Bath)
Entire Place • 3 bedrooms

Beachfront Studio - Unit 207 Ocean Villa
Entire Place • N/A
Oceanview 2BR/1BA - Unit 209 Ocean Villa
Entire Place • 2 bedrooms
Note: Performance varies based on location, size, amenities, seasonality, and management quality. Data reflects the past 12 months.
Top Performing Airbnb Hosts in Hagåtña (2026)
Learn from the best! This table showcases top-performing Airbnb hosts in Hagåtña based on the number of properties managed and estimated total revenue over the past year. Analyze their scale and performance metrics.
| Host Name | Properties | Grossing Revenue | Stay Reviews | Avg Rating |
|---|---|---|---|---|
| Anna | 15 | $170,680 | 604 | 4.74/5.0 |
| Kukuri | 3 | $108,188 | 36 | 4.74/5.0 |
| Maria Min-Sook | 2 | $33,689 | 12 | 4.33/5.0 |
| Kimberly | 1 | $17,899 | 45 | 4.64/5.0 |
| Dina | 4 | $7,837 | 26 | 4.49/5.0 |
| Sung | 1 | $5,920 | 1 | Not Rated |
| Sun | 1 | $2,297 | 32 | 5.00/5.0 |
| Asia | 1 | $1,079 | 50 | 4.30/5.0 |
| Kiana And Dina | 1 | $347 | 2 | Not Rated |
Analyzing the strategies of top hosts, such as their property selection, pricing, and guest communication, can offer valuable lessons for optimizing your own Airbnb operations in Hagåtña.
Dive Deeper: Advanced Hagåtña STR Market Data (2026)
Ready to unlock more insights? AirROI provides access to advanced metrics and comprehensive Airbnb data for Hagåtña. Explore detailed analytics beyond this report to refine your investment strategy, optimize pricing, and maximize your vacation rental profits.
Explore Advanced MetricsHagåtña Short-Term Rental Market Composition (2026): Property & Room Types
Room Type Distribution
Property Type Distribution
Market Composition Insights for Hagåtña
- The Hagåtña Airbnb market composition is heavily skewed towards Entire Home/Apt listings, which make up 93.1% of the 29 active rentals. This indicates strong guest preference for privacy and space.
- Looking at the property type distribution in Hagåtña, Apartment/Condo properties are the most common (93.1%), reflecting the local real estate landscape.
Hagåtña Airbnb Room Capacity Analysis (2026): Bedroom Distribution
Distribution of Listings by Number of Bedrooms
Room Capacity Insights for Hagåtña
- The dominant room capacity in Hagåtña is 1 bedroom listings, making up 34.5% of the market. This suggests a strong demand for properties suitable for couples or solo travelers.
- Together, 1 bedroom and 2 bedrooms properties represent 69.0% of the active Airbnb listings in Hagåtña, indicating a high concentration in these sizes.
- A significant 24.1% of listings offer 3+ bedrooms, catering to larger groups and families seeking more space in Hagåtña.
Hagåtña Vacation Rental Guest Capacity Trends (2026)
Distribution of Listings by Guest Capacity
Guest Capacity Insights for Hagåtña
- The most common guest capacity trend in Hagåtña vacation rentals is listings accommodating 4 guests (37.9%). This suggests the primary traveler segment is likely small families or groups.
- Properties designed for 4 guests and 2 guests dominate the Hagåtña STR market, accounting for 65.5% of listings.
- 20.6% of properties accommodate 6+ guests, serving the market segment for larger families or group travel in Hagåtña.
- On average, properties in Hagåtña are equipped to host 3.7 guests.
Hagåtña Airbnb Booking Patterns (2026): Available vs. Booked Days
Available Days Distribution
Booked Days Distribution
Booking Pattern Insights for Hagåtña
- The most common availability pattern in Hagåtña falls within the 271-366 days range, representing 75.9% of listings. This suggests many properties have significant open periods on their calendars.
- Approximately 100.0% of listings show high availability (181+ days open annually), indicating potential for increased bookings or specific owner usage patterns.
- For booked days, the 31-90 days range is most frequent in Hagåtña (41.4%), reflecting common guest stay durations or potential owner blocking patterns.
Hagåtña Airbnb Minimum Stay Requirements Analysis
Distribution of Listings by Minimum Night Requirement
1 Night
1 listings
3.4% of total
2 Nights
17 listings
58.6% of total
3 Nights
4 listings
13.8% of total
4-6 Nights
3 listings
10.3% of total
7-29 Nights
1 listings
3.4% of total
30+ Nights
3 listings
10.3% of total
Key Insights
- The most prevalent minimum stay requirement in Hagåt�ña is 2 Nights, adopted by 58.6% of listings. This highlights the market's preference for shorter, flexible bookings.
- A strong majority (62.0%) of the Hagåtña Airbnb data shows acceptance of very short stays (1-2 nights), indicating a dynamic, high-turnover market.
- A significant segment (10.3%) caters to monthly stays (30+ nights) in Hagåtña, pointing to opportunities in the extended-stay market.
Recommendations
- Align with the market by considering a 2 Nights minimum stay, as 58.6% of Hagåtña hosts use this setting.
- If feasible, allowing 1-night stays, especially midweek or during low season, could capture last-minute bookings, as only 3.4% currently do.
- A 2-night minimum appears standard (58.6%). Consider this for weekends or peak periods.
- Explore offering discounts for stays of 30+ nights to attract the 10.3% of the market seeking extended stays.
- Adjust minimum nights based on seasonality – potentially shorter during low season and longer during peak demand periods in Hagåtña.
Hagåtña Airbnb Cancellation Policy Trends Analysis (2026)
Flexible
1 listings
3.4% of total
Moderate
1 listings
3.4% of total
Firm
8 listings
27.6% of total
Strict
19 listings
65.5% of total
Cancellation Policy Insights for Hagåtña
- The prevailing Airbnb cancellation policy trend in Hagåtña is Strict, used by 65.5% of listings.
- A majority (93.1%) of hosts in Hagåtña utilize Firm or Strict policies, indicating a market where hosts prioritize booking security.
Recommendations for Hosts
- Consider adopting a Strict policy to align with the 65.5% market standard in Hagåtña.
- With 65.5% using Strict terms, this is a viable option in Hagåtña, particularly for high-value properties or during peak demand periods.
- Regularly review your cancellation policy against competitors and market demand shifts in Hagåtña.
Hagåtña STR Booking Lead Time Analysis (2026)
Average Booking Lead Time by Month
Booking Lead Time Insights for Hagåtña
- The overall average booking lead time for vacation rentals in Hagåtña is 23 days.
- Guests book furthest in advance for stays during November (average 43 days), likely coinciding with peak travel demand or local events.
- The shortest booking windows occur for stays in April (average 12 days), indicating more last-minute travel plans during this time.
- Seasonally, Winter (35 days avg.) sees the longest lead times, while Spring (19 days avg.) has the shortest, reflecting typical travel planning cycles.
Recommendations for Hosts
- Use the overall average lead time (23 days) as a baseline for your pricing and availability strategy in Hagåtña.
- For November stays, consider implementing length-of-stay discounts or slightly higher rates for bookings made less than 43 days out to capitalize on advance planning.
- During April, focus on last-minute booking availability and promotions, as guests book with very short notice (12 days avg.).
- Target marketing efforts for the Winter season well in advance (at least 35 days) to capture early planners.
- Monitor your own booking lead times against these Hagåtña averages to identify opportunities for dynamic pricing adjustments.
Popular & Essential Airbnb Amenities in Hagåtña (2026)
Amenity Prevalence
Amenity Insights for Hagåtña
- Essential amenities in Hagåtña that guests expect include: Air conditioning, Wifi, Hangers, Free parking on premises, Smoke alarm, TV. Lacking these (any) could significantly impact bookings.
- Popular amenities like Hot water, Iron, Essentials are common but not universal. Offering these can provide a competitive edge.
Recommendations for Hosts
- Ensure your listing includes all essential amenities for Hagåtña: Air conditioning, Wifi, Hangers, Free parking on premises, Smoke alarm, TV.
- Prioritize adding missing essentials: Hangers, Free parking on premises, Smoke alarm, TV.
- Consider adding popular differentiators like Hot water or Iron to increase appeal.
- Highlight unique or less common amenities you offer (e.g., hot tub, dedicated workspace, EV charger) in your listing description and photos.
- Regularly check competitor amenities in Hagåtña to stay competitive.
Hagåtña Airbnb Guest Demographics & Profile Analysis (2026)
Guest Profile Summary for Hagåtña
- The typical guest profile for Airbnb in Hagåtña consists of a mix of domestic (45%) and international guests, with top international origins including France, typically belonging to the Post-2000s (Gen Z/Alpha) group (50%), primarily speaking English or Spanish.
- Domestic travelers account for 45.0% of guests.
- Key international markets include United States (45%) and France (12.5%).
- Top languages spoken are English (50%) followed by Spanish (17.5%).
- A significant demographic segment is the Post-2000s (Gen Z/Alpha) group, representing 50% of guests.
Recommendations for Hosts
- Balance marketing efforts between domestic and international channels based on the guest mix.
- Tailor amenities and listing descriptions to appeal to the dominant Post-2000s (Gen Z/Alpha) demographic (e.g., highlight fast WiFi, smart home features, local guides).
- Highlight unique local experiences or amenities relevant to the primary guest profile.
- Consider seasonal promotions aligned with peak travel times for key origin markets.
Nearby Short-Term Rental Market Comparison
How does the Hagåtña Airbnb market stack up against its neighbors? Compare key performance metrics like average monthly revenue, ADR, and occupancy rates in surrounding areas to understand the broader regional STR landscape.
| Market | Active Properties | Monthly Revenue | Daily Rate | Avg. Occupancy |
|---|---|---|---|---|
| Tamuning | 96 | $1,420 | $226.92 | 32% |
| Dededo Municipality | 11 | $1,216 | $212.65 | 40% |
| Mangilao | 14 | $355 | $83.56 | 29% |