Island Park Airbnb Market Analysis 2026: Short Term Rental Data & Vacation Rental Statistics in Idaho, United States
Is Airbnb profitable in Island Park in 2026? Explore comprehensive Airbnb analytics for Island Park, Idaho, United States to uncover income potential. This 2026 STR market report for Island Park, based on AirROI data from February 2025 to January 2026, reveals key trends in the bustling market of 1,029 active listings.
Whether you're considering an Airbnb investment in Island Park, optimizing your existing vacation rental, or exploring rental arbitrage opportunities, understanding the Island Park Airbnb data is crucial. Leveraging the low regulation environment is key to maximizing your short term rental income potential. Let's dive into the specifics.
Key Island Park Airbnb Performance Metrics Overview
Monthly Airbnb Revenue Variations & Income Potential in Island Park (2026)
Understanding the monthly revenue variations for Airbnb listings in Island Park is key to maximizing your short term rental income potential. Seasonality significantly impacts earnings. Our analysis, based on data from the past 12 months, shows that the peak revenue month for STRs in Island Park is typically July, while March often presents the lowest earnings, highlighting opportunities for strategic pricing adjustments during shoulder and low seasons. Explore the typical Airbnb income in Island Park across different performance tiers:
- Best-in-class properties (Top 10%) achieve $11,005+ monthly, often utilizing dynamic pricing and superior guest experiences.
- Strong performing properties (Top 25%) earn $7,354 or more, indicating effective management and desirable locations/amenities.
- Typical properties (Median) generate around $4,621 per month, representing the average market performance.
- Entry-level properties (Bottom 25%) see earnings around $2,657, often with potential for optimization.
Average Monthly Airbnb Earnings Trend in Island Park
Island Park Airbnb Occupancy Rate Trends (2026)
Maximize your bookings by understanding the Island Park STR occupancy trends. Seasonal demand shifts significantly influence how often properties are booked. Typically, Julysees the highest demand (peak season occupancy), while January experiences the lowest (low season). Effective strategies, like adjusting minimum stays or offering promotions, can boost occupancy during slower periods. Here's how different property tiers perform in Island Park:
- Best-in-class properties (Top 10%) achieve 74%+ occupancy, indicating high desirability and potentially optimized availability.
- Strong performing properties (Top 25%) maintain 60% or higher occupancy, suggesting good market fit and guest satisfaction.
- Typical properties (Median) have an occupancy rate around 41%.
- Entry-level properties (Bottom 25%) average 24% occupancy, potentially facing higher vacancy.
Average Monthly Occupancy Rate Trend in Island Park
Average Daily Rate (ADR) Airbnb Trends in Island Park (2026)
Effective short term rental pricing strategy in Island Park involves understanding monthly ADR fluctuations. The Average Daily Rate (ADR) for Airbnb in Island Park typically peaks in July and dips lowest during April. Leveraging Airbnb dynamic pricing tools or strategies based on this seasonality can significantly boost revenue. Here's a look at the typical nightly rates achieved:
- Best-in-class properties (Top 10%) command rates of $748+ per night, often due to premium features or locations.
- Strong performing properties (Top 25%) achieve nightly rates of $518 or more.
- Typical properties (Median) charge around $365 per night.
- Entry-level properties (Bottom 25%) earn around $261 per night.
Average Daily Rate (ADR) Trend by Month in Island Park
Get Live Island Park Market Intelligence 👇

Explore Real-time Analytics
Airbnb Seasonality Analysis & Trends in Island Park (2026)
Peak Season (July, June, August)
- Revenue averages $10,317 per month
- Occupancy rates average 65.2%
- Daily rates average $495
Shoulder Season
- Revenue averages $4,831 per month
- Occupancy maintains around 39.1%
- Daily rates hold near $424
Low Season (January, February, March)
- Revenue drops to average $3,020 per month
- Occupancy decreases to average 27.3%
- Daily rates adjust to average $397
Seasonality Insights for Island Park
- The Airbnb seasonality in Island Park shows highly seasonal trends requiring careful strategy. While the sections above show seasonal averages, it's also insightful to look at the extremes:
- During the high season, the absolute peak month showcases Island Park's highest earning potential, with monthly revenues capable of climbing to $11,860, occupancy reaching a high of 71.1%, and ADRs peaking at $506.
- Conversely, the slowest single month of the year, typically falling within the low season, marks the market's lowest point. In this month, revenue might dip to $2,356, occupancy could drop to 22.7%, and ADRs may adjust down to $368.
- Understanding both the seasonal averages and these monthly peaks and troughs in revenue, occupancy, and ADR is crucial for maximizing your Airbnb profit potential in Island Park.
Seasonal Strategies for Maximizing Profit
- Peak Season: Maximize revenue through premium pricing and potentially longer minimum stays. Ensure high availability.
- Low Season: Offer competitive pricing, special promotions (e.g., extended stay discounts), and flexible cancellation policies. Target off-season travelers like remote workers or budget-conscious guests.
- Shoulder Seasons: Implement dynamic pricing that balances peak and low rates. Target weekend travelers or specific events. Offer slightly more flexible terms than peak season.
- Regularly analyze your own performance against these Island Park seasonality benchmarks and adjust your pricing and availability strategy accordingly.
Best Areas for Airbnb Investment in Island Park (2026)
Exploring the top neighborhoods for short-term rentals in Island Park? This section highlights key areas, outlining why they are attractive for hosts and guests, along with notable local attractions. Consider these locations based on your target guest profile and investment strategy.
| Neighborhood / Area | Why Host Here? (Target Guests & Appeal) | Key Attractions & Landmarks |
|---|---|---|
| Island Park | A popular gateway to Yellowstone National Park, Island Park offers stunning natural beauty and outdoor activities. It's ideal for tourists looking to explore the national park while enjoying a peaceful, scenic environment. | West Yellowstone, Henry's Fork of the Snake River, Big Springs, Island Park Reservoir, Beaver Dick Park |
| Upper Snake River | Known for its fishing and beautiful river views, the Upper Snake River area attracts nature lovers and those seeking adventure. It's great for families and groups wanting to relax by the water. | Snake River, Fishing, Kayaking, Picnicking Areas, Scenic Views |
| Shoshone-Bannock Tribes | This area has cultural significance and offers unique attractions related to Native American history. It's appealing for those interested in cultural tourism and education. | Fort Hall Museum, Tribal Events, Local History, Cultural Tours |
| Custer County | Custer County is known for its vast wilderness and outdoor activities. It's perfect for adventure seekers and outdoor enthusiasts looking to explore nature. | Challis National Forest, Whitewater Rafting, Hiking Trails, Wildlife Viewing, Scenic Drives |
| Henry's Lake | A serene lake area perfect for fishing and relaxation. It's popular among those looking for a peaceful retreat in nature, particularly during the summer months. | Henry's Lake State Park, Fishing, Camping, Bird Watching, Picnicking |
| Warm River | This scenic area is popular for its hot springs and recreational options. It's a charming spot for visitors seeking a unique experience in nature, especially families. | Warm River Springs, Fishing, Hiking, Campsites, Picnic Areas |
| Lone Pine | Lone Pine offers a more secluded experience with beautiful landscapes, ideal for those seeking peace and solitude in nature. It's great for retreats and quiet getaways. | Nature Trails, Scenic Views, Wildlife Spotting, Stargazing, Outdoor Recreation |
| Sawtell Peak | As a great destination for hiking and nature observation, Sawtell Peak attracts outdoor enthusiasts looking for stunning views and challenging trails. | Hiking Trails, Photography Opportunities, Wildflower Viewing, Mountain Biking, Scenic Overlook |
Understanding Airbnb License Requirements & STR Laws in Island Park (2026)
While Island Park, Idaho, United States currently shows low STR regulations, specific Airbnb license requirements might still exist or change. Always verify the latest short term rental regulations and Airbnb license requirements directly with local government authorities for Island Park to ensure full compliance before hosting.
(Source: AirROI data, 2026, based on 0% licensed listings)
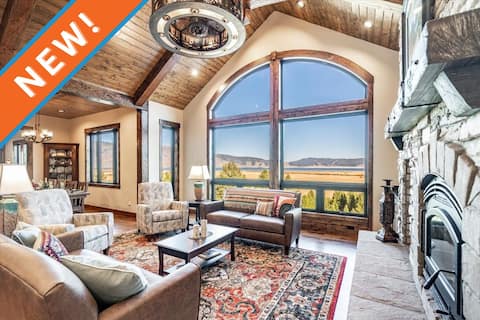
Top Performing Airbnb Properties in Island Park (2026)
Benchmark your potential! Explore examples of top-performing Airbnb properties in Island Parkbased on Trailing Twelve Month (TTM) revenue. Analyze their characteristics, revenue, occupancy rate, and ADR to understand what drives success in this market.

Henry's Lake Hideaway • Hot Tub + Dock + Views
Entire Place • 5 bedrooms
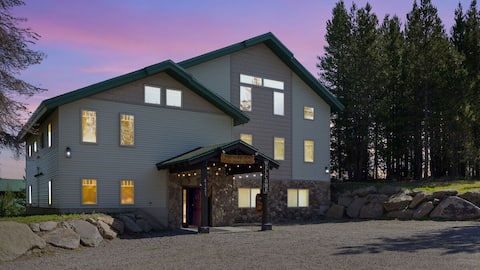
Trumpeter Swan,4Br,3Ba,BBQ,Firepit,Lakeview,20mYNP
Entire Place • 4 bedrooms
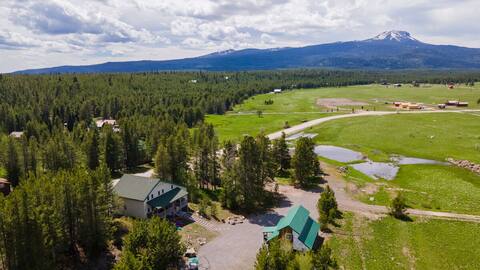
The Bear Den,Hot tub,BBQ,Firepit, Yellowstone
Entire Place • 9 bedrooms

Midnight Pines Lodge+HotTub+Cent AC+20mYellowstone
Entire Place • 6 bedrooms
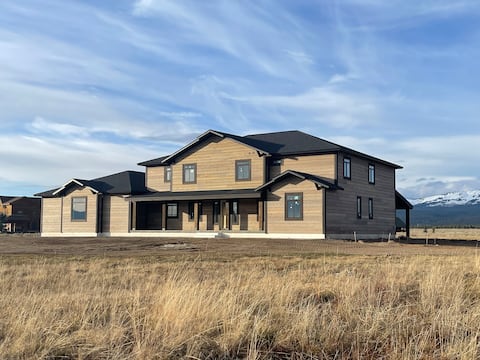
New 8 Master Suites~By Yellowstone~Wifi~AC~Hot Tub
Entire Place • 8 bedrooms
The Bear Den Bundle-12Br-10Ba-BBQ-FirePit-Hottub
Entire Place • 12 bedrooms
Note: Performance varies based on location, size, amenities, seasonality, and management quality. Data reflects the past 12 months.
Top Performing Airbnb Hosts in Island Park (2026)
Learn from the best! This table showcases top-performing Airbnb hosts in Island Park based on the number of properties managed and estimated total revenue over the past year. Analyze their scale and performance metrics.
| Host Name | Properties | Grossing Revenue | Stay Reviews | Avg Rating |
|---|---|---|---|---|
| Chris Mehr | 84 | $5,699,694 | 8348 | 4.88/5.0 |
| Jake | 38 | $3,755,151 | 1143 | 4.89/5.0 |
| Casago Yellowstone | 18 | $2,812,357 | 229 | 4.93/5.0 |
| Kabino | 44 | $2,747,834 | 1120 | 4.65/5.0 |
| Island Park Reservations | 75 | $2,093,539 | 1777 | 4.67/5.0 |
| Sawtelle Property Management | 33 | $1,934,215 | 909 | 4.84/5.0 |
| Sharie | 37 | $1,931,106 | 1311 | 4.96/5.0 |
| Makenna | 19 | $1,052,125 | 841 | 4.75/5.0 |
| Evolve | 20 | $963,150 | 1177 | 4.72/5.0 |
| Island Park Cabins And Lodges | 19 | $870,828 | 1478 | 4.68/5.0 |
Analyzing the strategies of top hosts, such as their property selection, pricing, and guest communication, can offer valuable lessons for optimizing your own Airbnb operations in Island Park.
Dive Deeper: Advanced Island Park STR Market Data (2026)
Ready to unlock more insights? AirROI provides access to advanced metrics and comprehensive Airbnb data for Island Park. Explore detailed analytics beyond this report to refine your investment strategy, optimize pricing, and maximize your vacation rental profits.
Explore Advanced MetricsIsland Park Short-Term Rental Market Composition (2026): Property & Room Types
Room Type Distribution
Property Type Distribution
Market Composition Insights for Island Park
- The Island Park Airbnb market composition is heavily skewed towards Entire Home/Apt listings, which make up 96.2% of the 1,029 active rentals. This indicates strong guest preference for privacy and space.
- Looking at the property type distribution in Island Park, Outdoor/Unique properties are the most common (77.3%), reflecting the local real estate landscape.
- Houses represent a significant 16.4% portion, catering likely to families or larger groups.
- Smaller segments like apartment/condo, hotel/boutique, others, unique stays (combined 6.3%) offer potential for unique stay experiences.
Island Park Airbnb Room Capacity Analysis (2026): Bedroom Distribution
Distribution of Listings by Number of Bedrooms
Room Capacity Insights for Island Park
- The dominant room capacity in Island Park is 3 bedrooms listings, making up 25.7% of the market. This suggests a strong demand for properties suitable for families or small groups.
- Together, 3 bedrooms and 5+ bedrooms properties represent 46.8% of the active Airbnb listings in Island Park, indicating a high concentration in these sizes.
- A significant 67.0% of listings offer 3+ bedrooms, catering to larger groups and families seeking more space in Island Park.
Island Park Vacation Rental Guest Capacity Trends (2026)
Distribution of Listings by Guest Capacity
Guest Capacity Insights for Island Park
- The most common guest capacity trend in Island Park vacation rentals is listings accommodating 8+ guests (66.4%). This suggests the primary traveler segment is likely larger groups.
- Properties designed for 8+ guests and 6 guests dominate the Island Park STR market, accounting for 77.6% of listings.
- 79.3% of properties accommodate 6+ guests, serving the market segment for larger families or group travel in Island Park.
- On average, properties in Island Park are equipped to host 6.8 guests.
Island Park Airbnb Booking Patterns (2026): Available vs. Booked Days
Available Days Distribution
Booked Days Distribution
Booking Pattern Insights for Island Park
- The most common availability pattern in Island Park falls within the 181-270 days range, representing 45.8% of listings. This suggests many properties have significant open periods on their calendars.
- Approximately 85.2% of listings show high availability (181+ days open annually), indicating potential for increased bookings or specific owner usage patterns.
- For booked days, the 91-180 days range is most frequent in Island Park (47.1%), reflecting common guest stay durations or potential owner blocking patterns.
- A notable 16.2% of properties secure long booking periods (181+ days booked per year), highlighting successful long-term rental strategies or significant owner usage.
Island Park Airbnb Minimum Stay Requirements Analysis
Distribution of Listings by Minimum Night Requirement
1 Night
267 listings
26% of total
2 Nights
263 listings
25.6% of total
3 Nights
78 listings
7.6% of total
4-6 Nights
10 listings
1% of total
7-29 Nights
1 listings
0.1% of total
30+ Nights
408 listings
39.7% of total
Key Insights
- The most prevalent minimum stay requirement in Island Park is 30+ Nights, adopted by 39.7% of listings. This highlights the market's preference for longer commitments.
- A significant segment (39.7%) caters to monthly stays (30+ nights) in Island Park, pointing to opportunities in the extended-stay market.
Recommendations
- Align with the market by considering a 30+ Nights minimum stay, as 39.7% of Island Park hosts use this setting.
- If feasible, allowing 1-night stays, especially midweek or during low season, could capture last-minute bookings, as only 26% currently do.
- Explore offering discounts for stays of 30+ nights to attract the 39.7% of the market seeking extended stays.
- Adjust minimum nights based on seasonality – potentially shorter during low season and longer during peak demand periods in Island Park.
Island Park Airbnb Cancellation Policy Trends Analysis (2026)
Super Strict 30 Days
39 listings
3.8% of total
Limited
13 listings
1.3% of total
Super Strict 60 Days
83 listings
8.1% of total
Flexible
69 listings
6.7% of total
Moderate
175 listings
17% of total
Firm
529 listings
51.5% of total
Strict
119 listings
11.6% of total
Cancellation Policy Insights for Island Park
- The prevailing Airbnb cancellation policy trend in Island Park is Firm, used by 51.5% of listings.
- A majority (63.1%) of hosts in Island Park utilize Firm or Strict policies, indicating a market where hosts prioritize booking security.
Recommendations for Hosts
- Consider adopting a Firm policy to align with the 51.5% market standard in Island Park.
- Using a Strict policy might deter some guests, as only 11.6% of listings use it. Evaluate if potential revenue protection outweighs possible lower booking rates.
- Regularly review your cancellation policy against competitors and market demand shifts in Island Park.
Island Park STR Booking Lead Time Analysis (2026)
Average Booking Lead Time by Month
Booking Lead Time Insights for Island Park
- The overall average booking lead time for vacation rentals in Island Park is 77 days.
- Guests book furthest in advance for stays during April (average 104 days), likely coinciding with peak travel demand or local events.
- The shortest booking windows occur for stays in March (average 46 days), indicating more last-minute travel plans during this time.
- Seasonally, Summer (92 days avg.) sees the longest lead times, while Winter (61 days avg.) has the shortest, reflecting typical travel planning cycles.
Recommendations for Hosts
- Use the overall average lead time (77 days) as a baseline for your pricing and availability strategy in Island Park.
- For April stays, consider implementing length-of-stay discounts or slightly higher rates for bookings made less than 104 days out to capitalize on advance planning.
- Target marketing efforts for the Summer season well in advance (at least 92 days) to capture early planners.
- Monitor your own booking lead times against these Island Park averages to identify opportunities for dynamic pricing adjustments.
Popular & Essential Airbnb Amenities in Island Park (2026)
Amenity Prevalence
Amenity Insights for Island Park
- Essential amenities in Island Park that guests expect include: Free parking on premises, Smoke alarm, Heating, Wifi. Lacking these (any) could significantly impact bookings.
- Popular amenities like Kitchen, TV, Coffee maker are common but not universal. Offering these can provide a competitive edge.
Recommendations for Hosts
- Ensure your listing includes all essential amenities for Island Park: Free parking on premises, Smoke alarm, Heating, Wifi.
- Prioritize adding missing essentials: Free parking on premises, Smoke alarm, Heating, Wifi.
- Consider adding popular differentiators like Kitchen or TV to increase appeal.
- Highlight unique or less common amenities you offer (e.g., hot tub, dedicated workspace, EV charger) in your listing description and photos.
- Regularly check competitor amenities in Island Park to stay competitive.
Island Park Airbnb Guest Demographics & Profile Analysis (2026)
Guest Profile Summary for Island Park
- The typical guest profile for Airbnb in Island Park consists of primarily domestic travelers (92%), often arriving from nearby Salt Lake City, typically belonging to the Post-2000s (Gen Z/Alpha) group (50%), primarily speaking English or Spanish.
- Domestic travelers account for 91.7% of guests.
- Key international markets include United States (91.7%) and Canada (1.1%).
- Top languages spoken are English (64.6%) followed by Spanish (10.3%).
- A significant demographic segment is the Post-2000s (Gen Z/Alpha) group, representing 50% of guests.
Recommendations for Hosts
- Target domestic marketing efforts towards travelers from Salt Lake City and New York.
- Tailor amenities and listing descriptions to appeal to the dominant Post-2000s (Gen Z/Alpha) demographic (e.g., highlight fast WiFi, smart home features, local guides).
- Highlight unique local experiences or amenities relevant to the primary guest profile.
- Consider seasonal promotions aligned with peak travel times for key origin markets.
Nearby Short-Term Rental Market Comparison
How does the Island Park Airbnb market stack up against its neighbors? Compare key performance metrics like average monthly revenue, ADR, and occupancy rates in surrounding areas to understand the broader regional STR landscape.
| Market | Active Properties | Monthly Revenue | Daily Rate | Avg. Occupancy |
|---|---|---|---|---|
| Teton Village | 283 | $8,166 | $913.82 | 43% |
| Jackson | 349 | $6,568 | $588.79 | 47% |
| Big Sky | 1,016 | $5,418 | $769.30 | 36% |
| Wilson | 259 | $4,662 | $481.18 | 48% |
| Emigrant | 113 | $4,616 | $384.97 | 52% |
| Gallatin Gateway | 53 | $4,600 | $477.28 | 45% |
| Gardiner | 209 | $4,223 | $314.18 | 55% |
| Pray | 53 | $4,084 | $362.97 | 47% |
| Driggs | 374 | $3,923 | $330.77 | 49% |
| Tetonia | 113 | $3,918 | $334.73 | 47% |