Morton Airbnb Market Analysis 2026: Short Term Rental Data & Vacation Rental Statistics in Illinois, United States
Is Airbnb profitable in Morton in 2026? Explore comprehensive Airbnb analytics for Morton, Illinois, United States to uncover income potential. This 2026 STR market report for Morton, based on AirROI data from February 2025 to January 2026, reveals key trends in the niche market of 20 active listings.
Whether you're considering an Airbnb investment in Morton, optimizing your existing vacation rental, or exploring rental arbitrage opportunities, understanding the Morton Airbnb data is crucial. Leveraging the low regulation environment is key to maximizing your short term rental income potential. Let's dive into the specifics.
Key Morton Airbnb Performance Metrics Overview
Monthly Airbnb Revenue Variations & Income Potential in Morton (2026)
Understanding the monthly revenue variations for Airbnb listings in Morton is key to maximizing your short term rental income potential. Seasonality significantly impacts earnings. Our analysis, based on data from the past 12 months, shows that the peak revenue month for STRs in Morton is typically July, while February often presents the lowest earnings, highlighting opportunities for strategic pricing adjustments during shoulder and low seasons. Explore the typical Airbnb income in Morton across different performance tiers:
- Best-in-class properties (Top 10%) achieve $3,858+ monthly, often utilizing dynamic pricing and superior guest experiences.
- Strong performing properties (Top 25%) earn $3,059 or more, indicating effective management and desirable locations/amenities.
- Typical properties (Median) generate around $2,286 per month, representing the average market performance.
- Entry-level properties (Bottom 25%) see earnings around $1,447, often with potential for optimization.
Average Monthly Airbnb Earnings Trend in Morton
Morton Airbnb Occupancy Rate Trends (2026)
Maximize your bookings by understanding the Morton STR occupancy trends. Seasonal demand shifts significantly influence how often properties are booked. Typically, Novembersees the highest demand (peak season occupancy), while January experiences the lowest (low season). Effective strategies, like adjusting minimum stays or offering promotions, can boost occupancy during slower periods. Here's how different property tiers perform in Morton:
- Best-in-class properties (Top 10%) achieve 85%+ occupancy, indicating high desirability and potentially optimized availability.
- Strong performing properties (Top 25%) maintain 76% or higher occupancy, suggesting good market fit and guest satisfaction.
- Typical properties (Median) have an occupancy rate around 57%.
- Entry-level properties (Bottom 25%) average 33% occupancy, potentially facing higher vacancy.
Average Monthly Occupancy Rate Trend in Morton
Average Daily Rate (ADR) Airbnb Trends in Morton (2026)
Effective short term rental pricing strategy in Morton involves understanding monthly ADR fluctuations. The Average Daily Rate (ADR) for Airbnb in Morton typically peaks in June and dips lowest during February. Leveraging Airbnb dynamic pricing tools or strategies based on this seasonality can significantly boost revenue. Here's a look at the typical nightly rates achieved:
- Best-in-class properties (Top 10%) command rates of $191+ per night, often due to premium features or locations.
- Strong performing properties (Top 25%) achieve nightly rates of $156 or more.
- Typical properties (Median) charge around $129 per night.
- Entry-level properties (Bottom 25%) earn around $106 per night.
Average Daily Rate (ADR) Trend by Month in Morton
Get Live Morton Market Intelligence 👇

Explore Real-time Analytics
Airbnb Seasonality Analysis & Trends in Morton (2026)
Peak Season (July, June, August)
- Revenue averages $3,659 per month
- Occupancy rates average 61.1%
- Daily rates average $171
Shoulder Season
- Revenue averages $2,344 per month
- Occupancy maintains around 57.0%
- Daily rates hold near $133
Low Season (January, February, April)
- Revenue drops to average $1,610 per month
- Occupancy decreases to average 47.9%
- Daily rates adjust to average $120
Seasonality Insights for Morton
- The Airbnb seasonality in Morton shows highly seasonal trends requiring careful strategy. While the sections above show seasonal averages, it's also insightful to look at the extremes:
- During the high season, the absolute peak month showcases Morton's highest earning potential, with monthly revenues capable of climbing to $3,981, occupancy reaching a high of 68.3%, and ADRs peaking at $184.
- Conversely, the slowest single month of the year, typically falling within the low season, marks the market's lowest point. In this month, revenue might dip to $1,320, occupancy could drop to 44.9%, and ADRs may adjust down to $112.
- Understanding both the seasonal averages and these monthly peaks and troughs in revenue, occupancy, and ADR is crucial for maximizing your Airbnb profit potential in Morton.
Seasonal Strategies for Maximizing Profit
- Peak Season: Maximize revenue through premium pricing and potentially longer minimum stays. Ensure high availability.
- Low Season: Offer competitive pricing, special promotions (e.g., extended stay discounts), and flexible cancellation policies. Target off-season travelers like remote workers or budget-conscious guests.
- Shoulder Seasons: Implement dynamic pricing that balances peak and low rates. Target weekend travelers or specific events. Offer slightly more flexible terms than peak season.
- Regularly analyze your own performance against these Morton seasonality benchmarks and adjust your pricing and availability strategy accordingly.
Best Areas for Airbnb Investment in Morton (2026)
Exploring the top neighborhoods for short-term rentals in Morton? This section highlights key areas, outlining why they are attractive for hosts and guests, along with notable local attractions. Consider these locations based on your target guest profile and investment strategy.
| Neighborhood / Area | Why Host Here? (Target Guests & Appeal) | Key Attractions & Landmarks |
|---|---|---|
| Downtown Morton | The heart of Morton, offering easy access to local shops, restaurants, and community events. It attracts both business travelers and families visiting for local attractions. | Morton Museum, Morton Community Center, Local Dining Options, Morton Farmers' Market |
| Morton Parks | A family-friendly area known for its beautiful parks and recreational activities, attracting families and groups looking for outdoor fun. | Ever Scenic Park, Cedar Street Park, Morton Aquatic Center, Walking Trails, Picnic Areas |
| Historical Morton | Rich in history and charm, this area features historic homes and buildings, appealing to visitors interested in the local culture and history. | Historical Society of Morton, The Old Jail Museum, Cultural Events, Local Heritage Tours |
| Morton Sports Complex | Ideal for sports enthusiasts, this area hosts multiple sports events and activities, making it popular among families and youth teams looking for nearby accommodations. | Morton Sports Complex, Football Fields, Baseball Diamonds, Community Sports Events |
| Nearby Peoria | Just a short drive away, Peoria offers urban attractions while still being close to Morton. It's great for visitors who want city amenities. | Peoria Riverfront Museum, Civic Center, Wildlife Prairie Park, Shopping and Dining |
| Rustic Morton | Surrounded by nature and farmland, this area provides a peaceful retreat for those seeking a quiet countryside experience and outdoor activities. | Scenic Countryside, Farmer's Markets, Nature Trails |
| Morton Arts District | Boosting a growing arts scene, this area attracts creative minds and anyone interested in local arts, offering a more cultural lodging option. | Art Galleries, Local Artists Studios, Craft Fairs, Art Tours |
| Morton Festivals | Various seasonal festivals keep this area lively, attracting visitors throughout the year looking for unique local experiences. | Morton Pumpkin Festival, Music Festivals, Seasonal Events, Local Crafts and Vendors |
Understanding Airbnb License Requirements & STR Laws in Morton (2026)
While Morton, Illinois, United States currently shows low STR regulations, specific Airbnb license requirements might still exist or change. Always verify the latest short term rental regulations and Airbnb license requirements directly with local government authorities for Morton to ensure full compliance before hosting.
(Source: AirROI data, 2026, finding no licensed listings among those analyzed)
Top Performing Airbnb Properties in Morton (2026)
Benchmark your potential! Explore examples of top-performing Airbnb properties in Mortonbased on Trailing Twelve Month (TTM) revenue. Analyze their characteristics, revenue, occupancy rate, and ADR to understand what drives success in this market.
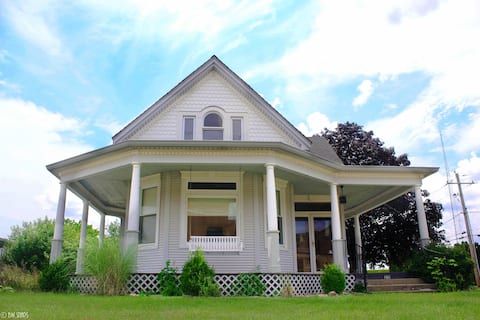
Fully Furnished Home in Historic Morton
Entire Place • 2 bedrooms
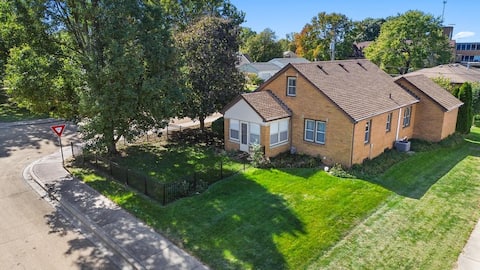
Cozy, Spacious, and Ready for Family Adventures!
Entire Place • 3 bedrooms
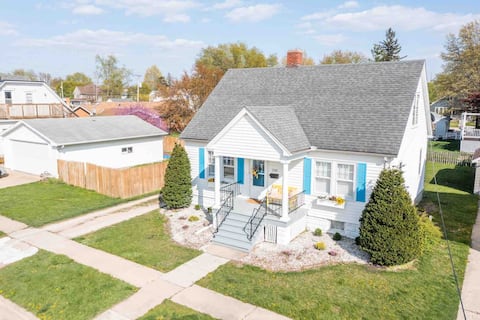
Charm on Clifton
Entire Place • 3 bedrooms
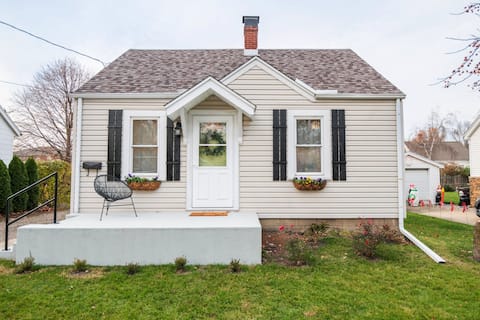
A cozy cottage in Morton
Entire Place • 3 bedrooms
The Silo 8 - Modern 2BD in a Quiet Neighborhood
Entire Place • 2 bedrooms

The Silo 3 - 1bd Lofi Vibes
Entire Place • 1 bedroom
Note: Performance varies based on location, size, amenities, seasonality, and management quality. Data reflects the past 12 months.
Top Performing Airbnb Hosts in Morton (2026)
Learn from the best! This table showcases top-performing Airbnb hosts in Morton based on the number of properties managed and estimated total revenue over the past year. Analyze their scale and performance metrics.
| Host Name | Properties | Grossing Revenue | Stay Reviews | Avg Rating |
|---|---|---|---|---|
| Silo | 8 | $181,850 | 268 | 4.90/5.0 |
| Shawn | 2 | $68,601 | 273 | 4.95/5.0 |
| Kory | 1 | $64,448 | 151 | 4.94/5.0 |
| Christina | 1 | $50,316 | 70 | 4.99/5.0 |
| Joseph | 2 | $39,391 | 54 | 4.58/5.0 |
| Kimberly | 1 | $32,800 | 110 | 4.95/5.0 |
| Lisa | 1 | $23,298 | 92 | 4.86/5.0 |
| Lauren | 1 | $13,528 | 51 | 5.00/5.0 |
| Susan | 1 | $10,417 | 110 | 4.95/5.0 |
| Amanda | 1 | $10,103 | 2 | Not Rated |
Analyzing the strategies of top hosts, such as their property selection, pricing, and guest communication, can offer valuable lessons for optimizing your own Airbnb operations in Morton.
Dive Deeper: Advanced Morton STR Market Data (2026)
Ready to unlock more insights? AirROI provides access to advanced metrics and comprehensive Airbnb data for Morton. Explore detailed analytics beyond this report to refine your investment strategy, optimize pricing, and maximize your vacation rental profits.
Explore Advanced MetricsMorton Short-Term Rental Market Composition (2026): Property & Room Types
Room Type Distribution
Property Type Distribution
Market Composition Insights for Morton
- The Morton Airbnb market composition is heavily skewed towards Entire Home/Apt listings, which make up 100% of the 20 active rentals. This indicates strong guest preference for privacy and space.
- Looking at the property type distribution in Morton, Apartment/Condo properties are the most common (50%), reflecting the local real estate landscape.
- Houses represent a significant 50% portion, catering likely to families or larger groups.
Morton Airbnb Room Capacity Analysis (2026): Bedroom Distribution
Distribution of Listings by Number of Bedrooms
Room Capacity Insights for Morton
- The dominant room capacity in Morton is 3 bedrooms listings, making up 40% of the market. This suggests a strong demand for properties suitable for families or small groups.
- Together, 3 bedrooms and 2 bedrooms properties represent 70.0% of the active Airbnb listings in Morton, indicating a high concentration in these sizes.
- A significant 40.0% of listings offer 3+ bedrooms, catering to larger groups and families seeking more space in Morton.
Morton Vacation Rental Guest Capacity Trends (2026)
Distribution of Listings by Guest Capacity
Guest Capacity Insights for Morton
- The most common guest capacity trend in Morton vacation rentals is listings accommodating 6 guests (40%). This suggests the primary traveler segment is likely larger groups.
- Properties designed for 6 guests and 2 guests dominate the Morton STR market, accounting for 70.0% of listings.
- 45.0% of properties accommodate 6+ guests, serving the market segment for larger families or group travel in Morton.
- On average, properties in Morton are equipped to host 4.5 guests.
Morton Airbnb Booking Patterns (2026): Available vs. Booked Days
Available Days Distribution
Booked Days Distribution
Booking Pattern Insights for Morton
- The most common availability pattern in Morton falls within the 91-180 days range, representing 50% of listings. This suggests many properties have significant open periods on their calendars.
- Approximately 50.0% of listings show high availability (181+ days open annually), indicating potential for increased bookings or specific owner usage patterns.
- For booked days, the 181-270 days range is most frequent in Morton (50%), reflecting common guest stay durations or potential owner blocking patterns.
- A notable 55.0% of properties secure long booking periods (181+ days booked per year), highlighting successful long-term rental strategies or significant owner usage.
Morton Airbnb Minimum Stay Requirements Analysis
Distribution of Listings by Minimum Night Requirement
1 Night
6 listings
30% of total
2 Nights
3 listings
15% of total
3 Nights
2 listings
10% of total
4-6 Nights
1 listings
5% of total
7-29 Nights
2 listings
10% of total
30+ Nights
6 listings
30% of total
Key Insights
- The most prevalent minimum stay requirement in Morton is 1 Night, adopted by 30% of listings. This highlights the market's preference for shorter, flexible bookings.
- A significant segment (30%) caters to monthly stays (30+ nights) in Morton, pointing to opportunities in the extended-stay market.
Recommendations
- Align with the market by considering a 1 Night minimum stay, as 30% of Morton hosts use this setting.
- Explore offering discounts for stays of 30+ nights to attract the 30% of the market seeking extended stays.
- Adjust minimum nights based on seasonality – potentially shorter during low season and longer during peak demand periods in Morton.
Morton Airbnb Cancellation Policy Trends Analysis (2026)
Flexible
2 listings
10% of total
Moderate
11 listings
55% of total
Firm
7 listings
35% of total
Cancellation Policy Insights for Morton
- The prevailing Airbnb cancellation policy trend in Morton is Moderate, used by 55% of listings.
- There's a relatively balanced mix between guest-friendly (65.0%) and stricter (35.0%) policies, offering choices for different guest needs.
Recommendations for Hosts
- Consider adopting a Moderate policy to align with the 55% market standard in Morton.
- Regularly review your cancellation policy against competitors and market demand shifts in Morton.
Morton STR Booking Lead Time Analysis (2026)
Average Booking Lead Time by Month
Booking Lead Time Insights for Morton
- The overall average booking lead time for vacation rentals in Morton is 42 days.
- Guests book furthest in advance for stays during August (average 69 days), likely coinciding with peak travel demand or local events.
- The shortest booking windows occur for stays in January (average 14 days), indicating more last-minute travel plans during this time.
- Seasonally, Summer (59 days avg.) sees the longest lead times, while Winter (20 days avg.) has the shortest, reflecting typical travel planning cycles.
Recommendations for Hosts
- Use the overall average lead time (42 days) as a baseline for your pricing and availability strategy in Morton.
- For August stays, consider implementing length-of-stay discounts or slightly higher rates for bookings made less than 69 days out to capitalize on advance planning.
- During January, focus on last-minute booking availability and promotions, as guests book with very short notice (14 days avg.).
- Target marketing efforts for the Summer season well in advance (at least 59 days) to capture early planners.
- Monitor your own booking lead times against these Morton averages to identify opportunities for dynamic pricing adjustments.
Popular & Essential Airbnb Amenities in Morton (2026)
Amenity Prevalence
Amenity Insights for Morton
- Essential amenities in Morton that guests expect include: Kitchen, Washer, TV, Smoke alarm, Wifi, Air conditioning, Free parking on premises, Heating, Carbon monoxide alarm, Dryer. Lacking these (any) could significantly impact bookings.
Recommendations for Hosts
- Ensure your listing includes all essential amenities for Morton: Kitchen, Washer, TV, Smoke alarm, Wifi, Air conditioning, Free parking on premises, Heating, Carbon monoxide alarm, Dryer.
- Prioritize adding missing essentials: Heating, Carbon monoxide alarm, Dryer.
- Highlight unique or less common amenities you offer (e.g., hot tub, dedicated workspace, EV charger) in your listing description and photos.
- Regularly check competitor amenities in Morton to stay competitive.
Morton Airbnb Guest Demographics & Profile Analysis (2026)
Guest Profile Summary for Morton
- The typical guest profile for Airbnb in Morton consists of primarily domestic travelers (95%), often arriving from nearby Chicago, typically belonging to the Post-2000s (Gen Z/Alpha) group (50%), primarily speaking English or Spanish.
- Domestic travelers account for 95.3% of guests.
- Key international markets include United States (95.3%) and Colombia (0.8%).
- Top languages spoken are English (75.4%) followed by Spanish (13%).
- A significant demographic segment is the Post-2000s (Gen Z/Alpha) group, representing 50% of guests.
Recommendations for Hosts
- Target domestic marketing efforts towards travelers from Chicago and Houston.
- Tailor amenities and listing descriptions to appeal to the dominant Post-2000s (Gen Z/Alpha) demographic (e.g., highlight fast WiFi, smart home features, local guides).
- Highlight unique local experiences or amenities relevant to the primary guest profile.
- Consider seasonal promotions aligned with peak travel times for key origin markets.
Nearby Short-Term Rental Market Comparison
How does the Morton Airbnb market stack up against its neighbors? Compare key performance metrics like average monthly revenue, ADR, and occupancy rates in surrounding areas to understand the broader regional STR landscape.
| Market | Active Properties | Monthly Revenue | Daily Rate | Avg. Occupancy |
|---|---|---|---|---|
| Glen Ellyn | 21 | $3,911 | $294.70 | 48% |
| Geneva | 32 | $3,591 | $237.71 | 50% |
| Morris | 15 | $3,246 | $235.07 | 50% |
| Roselle | 12 | $3,238 | $211.87 | 56% |
| St. Charles Township | 19 | $3,233 | $281.50 | 42% |
| Effingham | 22 | $3,085 | $277.14 | 44% |
| St. Charles | 37 | $3,045 | $224.94 | 57% |
| Wheaton | 34 | $3,019 | $214.36 | 53% |
| East Peoria | 24 | $2,949 | $218.85 | 50% |
| Lisle | 16 | $2,866 | $173.30 | 56% |