Plainfield Airbnb Market Analysis 2026: Short Term Rental Data & Vacation Rental Statistics in Illinois, United States
Is Airbnb profitable in Plainfield in 2026? Explore comprehensive Airbnb analytics for Plainfield, Illinois, United States to uncover income potential. This 2026 STR market report for Plainfield, based on AirROI data from February 2025 to January 2026, reveals key trends in the niche market of 19 active listings.
Whether you're considering an Airbnb investment in Plainfield, optimizing your existing vacation rental, or exploring rental arbitrage opportunities, understanding the Plainfield Airbnb data is crucial. Leveraging the low regulation environment is key to maximizing your short term rental income potential. Let's dive into the specifics.
Key Plainfield Airbnb Performance Metrics Overview
Monthly Airbnb Revenue Variations & Income Potential in Plainfield (2026)
Understanding the monthly revenue variations for Airbnb listings in Plainfield is key to maximizing your short term rental income potential. Seasonality significantly impacts earnings. Our analysis, based on data from the past 12 months, shows that the peak revenue month for STRs in Plainfield is typically July, while February often presents the lowest earnings, highlighting opportunities for strategic pricing adjustments during shoulder and low seasons. Explore the typical Airbnb income in Plainfield across different performance tiers:
- Best-in-class properties (Top 10%) achieve $9,756+ monthly, often utilizing dynamic pricing and superior guest experiences.
- Strong performing properties (Top 25%) earn $4,572 or more, indicating effective management and desirable locations/amenities.
- Typical properties (Median) generate around $2,038 per month, representing the average market performance.
- Entry-level properties (Bottom 25%) see earnings around $1,168, often with potential for optimization.
Average Monthly Airbnb Earnings Trend in Plainfield
Plainfield Airbnb Occupancy Rate Trends (2026)
Maximize your bookings by understanding the Plainfield STR occupancy trends. Seasonal demand shifts significantly influence how often properties are booked. Typically, Julysees the highest demand (peak season occupancy), while January experiences the lowest (low season). Effective strategies, like adjusting minimum stays or offering promotions, can boost occupancy during slower periods. Here's how different property tiers perform in Plainfield:
- Best-in-class properties (Top 10%) achieve 77%+ occupancy, indicating high desirability and potentially optimized availability.
- Strong performing properties (Top 25%) maintain 65% or higher occupancy, suggesting good market fit and guest satisfaction.
- Typical properties (Median) have an occupancy rate around 46%.
- Entry-level properties (Bottom 25%) average 27% occupancy, potentially facing higher vacancy.
Average Monthly Occupancy Rate Trend in Plainfield
Average Daily Rate (ADR) Airbnb Trends in Plainfield (2026)
Effective short term rental pricing strategy in Plainfield involves understanding monthly ADR fluctuations. The Average Daily Rate (ADR) for Airbnb in Plainfield typically peaks in June and dips lowest during March. Leveraging Airbnb dynamic pricing tools or strategies based on this seasonality can significantly boost revenue. Here's a look at the typical nightly rates achieved:
- Best-in-class properties (Top 10%) command rates of $366+ per night, often due to premium features or locations.
- Strong performing properties (Top 25%) achieve nightly rates of $202 or more.
- Typical properties (Median) charge around $156 per night.
- Entry-level properties (Bottom 25%) earn around $129 per night.
Average Daily Rate (ADR) Trend by Month in Plainfield
Get Live Plainfield Market Intelligence 👇
Explore Real-time Analytics
Airbnb Seasonality Analysis & Trends in Plainfield (2026)
Peak Season (July, October, June)
- Revenue averages $4,262 per month
- Occupancy rates average 50.7%
- Daily rates average $208
Shoulder Season
- Revenue averages $3,839 per month
- Occupancy maintains around 46.0%
- Daily rates hold near $199
Low Season (February, March, September)
- Revenue drops to average $3,288 per month
- Occupancy decreases to average 42.8%
- Daily rates adjust to average $195
Seasonality Insights for Plainfield
- The Airbnb seasonality in Plainfield shows moderate seasonality with distinct peak and low periods. While the sections above show seasonal averages, it's also insightful to look at the extremes:
- During the high season, the absolute peak month showcases Plainfield's highest earning potential, with monthly revenues capable of climbing to $4,655, occupancy reaching a high of 56.3%, and ADRs peaking at $214.
- Conversely, the slowest single month of the year, typically falling within the low season, marks the market's lowest point. In this month, revenue might dip to $3,051, occupancy could drop to 40.7%, and ADRs may adjust down to $188.
- Understanding both the seasonal averages and these monthly peaks and troughs in revenue, occupancy, and ADR is crucial for maximizing your Airbnb profit potential in Plainfield.
Seasonal Strategies for Maximizing Profit
- Peak Season: Maximize revenue through premium pricing and potentially longer minimum stays. Ensure high availability.
- Low Season: Offer competitive pricing, special promotions (e.g., extended stay discounts), and flexible cancellation policies. Target off-season travelers like remote workers or budget-conscious guests.
- Shoulder Seasons: Implement dynamic pricing that balances peak and low rates. Target weekend travelers or specific events. Offer slightly more flexible terms than peak season.
- Regularly analyze your own performance against these Plainfield seasonality benchmarks and adjust your pricing and availability strategy accordingly.
Best Areas for Airbnb Investment in Plainfield (2026)
Exploring the top neighborhoods for short-term rentals in Plainfield? This section highlights key areas, outlining why they are attractive for hosts and guests, along with notable local attractions. Consider these locations based on your target guest profile and investment strategy.
| Neighborhood / Area | Why Host Here? (Target Guests & Appeal) | Key Attractions & Landmarks |
|---|---|---|
| Downtown Plainfield | A vibrant area filled with shops and restaurants, Downtown Plainfield appeals to visitors wanting to explore local culture and events, making it an attractive spot for Airbnb hosting. | Plainfield Historic District, The Promenade at Bolingbrook, Plainfield Riverwalk, Local restaurants and cafes, Annual Plainfield Fest |
| Lake Renwick | A scenic area perfect for nature lovers and outdoor activities. It attracts families and active travelers looking to enjoy the beauty of nature and recreational activities. | Lake Renwick Preserve, Bird watching, Fishing, Walking trails |
| Cloverdale | A suburban neighborhood with a community feel, good for families and those looking for a peaceful stay. This area appeals to guests looking for a local neighborhood vibe. | Cloverdale Park, Community events, Local dining options |
| Indian Boundary Park | A residential area that offers a quieter atmosphere yet close to local amenities, making it a good option for guests who want convenience without the hustle. | Indian Boundary Park, Playgrounds, Walking trails |
| Greystone | A family-friendly area with great schools and neighborhood parks, attracting visitors with children and families looking for longer stays in a friendly environment. | Greystone Park, Playgrounds, Community activities |
| Pine Ridge Estates | A peaceful subdivision with spacious homes. Ideal for travelers seeking a relaxing environment away from busy tourist spots. | Community parks, Local shopping, Walking paths |
| Timberline | Known for its excellent schools and family atmosphere, this area is perfect for visitors looking to stay in a calm, suburban environment while still being close to key attractions. | Timberline Park, Family-friendly community events, Nearby shopping centers |
| Brookstone | A modern neighborhood with new developments. Suitable for guests seeking a stylish, comfortable, and contemporary lodging experience. | Brookstone Park, Local dining, Shopping at nearby plazas |
Understanding Airbnb License Requirements & STR Laws in Plainfield (2026)
While Plainfield, Illinois, United States currently shows low STR regulations, specific Airbnb license requirements might still exist or change. Always verify the latest short term rental regulations and Airbnb license requirements directly with local government authorities for Plainfield to ensure full compliance before hosting.
(Source: AirROI data, 2026, finding no licensed listings among those analyzed)
Top Performing Airbnb Properties in Plainfield (2026)
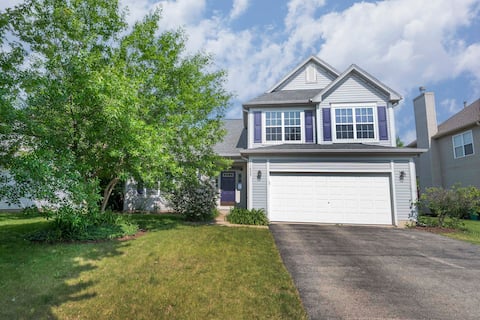
Benchmark your potential! Explore examples of top-performing Airbnb properties in Plainfieldbased on Trailing Twelve Month (TTM) revenue. Analyze their characteristics, revenue, occupancy rate, and ADR to understand what drives success in this market.
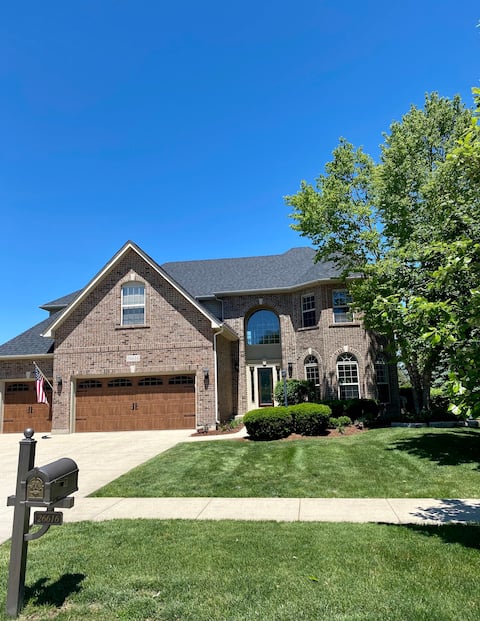
WATER FRONT LUXURY HOME WILL FEEL LIKE A RESORT!
Entire Place • 6 bedrooms

30 mins to CHI| 3 Kings| BBQ Grill| TV| Spacious
Entire Place • 3 bedrooms
Tranquil 4BR in Naper/Plainfld
Entire Place • 4 bedrooms
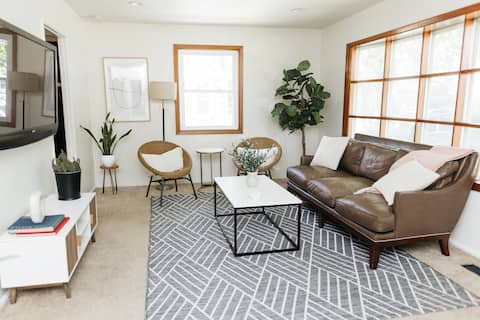
Modern Peaceful Home | Firepit | Steps to Downtown
Entire Place • 3 bedrooms
Historic Pioneer House
Entire Place • 2 bedrooms
Relaxing Suite with Independent Entrance
Entire Place • 1 bedroom
Note: Performance varies based on location, size, amenities, seasonality, and management quality. Data reflects the past 12 months.
Top Performing Airbnb Hosts in Plainfield (2026)
Learn from the best! This table showcases top-performing Airbnb hosts in Plainfield based on the number of properties managed and estimated total revenue over the past year. Analyze their scale and performance metrics.
| Host Name | Properties | Grossing Revenue | Stay Reviews | Avg Rating |
|---|---|---|---|---|
| Roman | 1 | $161,213 | 62 | 4.95/5.0 |
| Sarah | 1 | $111,940 | 52 | 4.77/5.0 |
| Nomun | 1 | $88,505 | 102 | 4.80/5.0 |
| Justin | 6 | $72,775 | 141 | 4.88/5.0 |
| Debra | 2 | $51,723 | 51 | 4.90/5.0 |
| Kelly | 1 | $50,303 | 211 | 4.91/5.0 |
| Maria | 1 | $21,760 | 95 | 4.88/5.0 |
| Eric | 1 | $19,649 | 2 | Not Rated |
| Evolve | 1 | $14,251 | 8 | 4.88/5.0 |
| Month2Month | 1 | $11,673 | 1 | Not Rated |
Analyzing the strategies of top hosts, such as their property selection, pricing, and guest communication, can offer valuable lessons for optimizing your own Airbnb operations in Plainfield.
Dive Deeper: Advanced Plainfield STR Market Data (2026)
Ready to unlock more insights? AirROI provides access to advanced metrics and comprehensive Airbnb data for Plainfield. Explore detailed analytics beyond this report to refine your investment strategy, optimize pricing, and maximize your vacation rental profits.
Explore Advanced MetricsPlainfield Short-Term Rental Market Composition (2026): Property & Room Types
Room Type Distribution
Property Type Distribution
Market Composition Insights for Plainfield
- The Plainfield Airbnb market composition is heavily skewed towards Entire Home/Apt listings, which make up 63.2% of the 19 active rentals. This indicates strong guest preference for privacy and space.
- However, a notable 36.8% share for Private Rooms suggests opportunities for budget-conscious travelers or hosts renting out spare rooms.
- Looking at the property type distribution in Plainfield, House properties are the most common (47.4%), reflecting the local real estate landscape.
- Houses represent a significant 47.4% portion, catering likely to families or larger groups.
- The presence of 26.3% Hotel/Boutique listings indicates integration with traditional hospitality.
Plainfield Airbnb Room Capacity Analysis (2026): Bedroom Distribution
Distribution of Listings by Number of Bedrooms
Room Capacity Insights for Plainfield
- The dominant room capacity in Plainfield is 1 bedroom listings, making up 52.6% of the market. This suggests a strong demand for properties suitable for couples or solo travelers.
- Together, 1 bedroom and 2 bedrooms properties represent 73.7% of the active Airbnb listings in Plainfield, indicating a high concentration in these sizes.
- With over half the market (52.6%) consisting of studios or 1-bedroom units, Plainfield is particularly well-suited for individuals or couples.
- A significant 21.1% of listings offer 3+ bedrooms, catering to larger groups and families seeking more space in Plainfield.
Plainfield Vacation Rental Guest Capacity Trends (2026)
Distribution of Listings by Guest Capacity
Guest Capacity Insights for Plainfield
- The most common guest capacity trend in Plainfield vacation rentals is listings accommodating 2 guests (47.4%). This suggests the primary traveler segment is likely couples or solo travelers.
- Properties designed for 2 guests and 8+ guests dominate the Plainfield STR market, accounting for 63.2% of listings.
- A significant 47.4% of listings cater specifically to 1-2 guests, highlighting strong demand from couples and solo travelers in Plainfield.
- 15.8% of properties accommodate 6+ guests, serving the market segment for larger families or group travel in Plainfield.
- On average, properties in Plainfield are equipped to host 3.6 guests.
Plainfield Airbnb Booking Patterns (2026): Available vs. Booked Days
Available Days Distribution
Booked Days Distribution
Booking Pattern Insights for Plainfield
- The most common availability pattern in Plainfield falls within the 271-366 days range, representing 42.1% of listings. This suggests many properties have significant open periods on their calendars.
- Approximately 78.9% of listings show high availability (181+ days open annually), indicating potential for increased bookings or specific owner usage patterns.
- For booked days, the 91-180 days range is most frequent in Plainfield (36.8%), reflecting common guest stay durations or potential owner blocking patterns.
- A notable 21.1% of properties secure long booking periods (181+ days booked per year), highlighting successful long-term rental strategies or significant owner usage.
Plainfield Airbnb Minimum Stay Requirements Analysis
Distribution of Listings by Minimum Night Requirement
1 Night
9 listings
47.4% of total
2 Nights
6 listings
31.6% of total
4-6 Nights
1 listings
5.3% of total
7-29 Nights
3 listings
15.8% of total
Key Insights
- The most prevalent minimum stay requirement in Plainfield is 1 Night, adopted by 47.4% of listings. This highlights the market's preference for shorter, flexible bookings.
- A strong majority (79.0%) of the Plainfield Airbnb data shows acceptance of very short stays (1-2 nights), indicating a dynamic, high-turnover market.
Recommendations
- Align with the market by considering a 1 Night minimum stay, as 47.4% of Plainfield hosts use this setting.
- Adjust minimum nights based on seasonality – potentially shorter during low season and longer during peak demand periods in Plainfield.
Plainfield Airbnb Cancellation Policy Trends Analysis (2026)
Flexible
8 listings
42.1% of total
Moderate
3 listings
15.8% of total
Firm
4 listings
21.1% of total
Strict
4 listings
21.1% of total
Cancellation Policy Insights for Plainfield
- The prevailing Airbnb cancellation policy trend in Plainfield is Flexible, used by 42.1% of listings.
- There's a relatively balanced mix between guest-friendly (57.9%) and stricter (42.2%) policies, offering choices for different guest needs.
Recommendations for Hosts
- Consider adopting a Flexible policy to align with the 42.1% market standard in Plainfield.
- Regularly review your cancellation policy against competitors and market demand shifts in Plainfield.
Plainfield STR Booking Lead Time Analysis (2026)
Average Booking Lead Time by Month
Booking Lead Time Insights for Plainfield
- The overall average booking lead time for vacation rentals in Plainfield is 66 days.
- Guests book furthest in advance for stays during May (average 114 days), likely coinciding with peak travel demand or local events.
- The shortest booking windows occur for stays in January (average 24 days), indicating more last-minute travel plans during this time.
- Seasonally, Fall (80 days avg.) sees the longest lead times, while Winter (39 days avg.) has the shortest, reflecting typical travel planning cycles.
Recommendations for Hosts
- Use the overall average lead time (66 days) as a baseline for your pricing and availability strategy in Plainfield.
- For May stays, consider implementing length-of-stay discounts or slightly higher rates for bookings made less than 114 days out to capitalize on advance planning.
- Target marketing efforts for the Fall season well in advance (at least 80 days) to capture early planners.
- Monitor your own booking lead times against these Plainfield averages to identify opportunities for dynamic pricing adjustments.
Popular & Essential Airbnb Amenities in Plainfield (2026)
Amenity Prevalence
Amenity Insights for Plainfield
- Essential amenities in Plainfield that guests expect include: Smoke alarm, Air conditioning, TV, Wifi. Lacking these (any) could significantly impact bookings.
- Popular amenities like Bed linens, Heating, Free parking on premises are common but not universal. Offering these can provide a competitive edge.
Recommendations for Hosts
- Ensure your listing includes all essential amenities for Plainfield: Smoke alarm, Air conditioning, TV, Wifi.
- Consider adding popular differentiators like Bed linens or Heating to increase appeal.
- Highlight unique or less common amenities you offer (e.g., hot tub, dedicated workspace, EV charger) in your listing description and photos.
- Regularly check competitor amenities in Plainfield to stay competitive.
Plainfield Airbnb Guest Demographics & Profile Analysis (2026)
Guest Profile Summary for Plainfield
- The typical guest profile for Airbnb in Plainfield consists of primarily domestic travelers (98%), often arriving from nearby Chicago, typically belonging to the Post-2000s (Gen Z/Alpha) group (50%), primarily speaking English or Spanish.
- Domestic travelers account for 97.9% of guests.
- Key international markets include United States (97.9%) and United Kingdom (1.1%).
- Top languages spoken are English (69.2%) followed by Spanish (21.2%).
- A significant demographic segment is the Post-2000s (Gen Z/Alpha) group, representing 50% of guests.
Recommendations for Hosts
- Target domestic marketing efforts towards travelers from Chicago and Pittsburgh.
- Tailor amenities and listing descriptions to appeal to the dominant Post-2000s (Gen Z/Alpha) demographic (e.g., highlight fast WiFi, smart home features, local guides).
- Highlight unique local experiences or amenities relevant to the primary guest profile.
- Consider seasonal promotions aligned with peak travel times for key origin markets.
Nearby Short-Term Rental Market Comparison
How does the Plainfield Airbnb market stack up against its neighbors? Compare key performance metrics like average monthly revenue, ADR, and occupancy rates in surrounding areas to understand the broader regional STR landscape.
| Market | Active Properties | Monthly Revenue | Daily Rate | Avg. Occupancy |
|---|---|---|---|---|
| Town of Sugar Creek | 18 | $9,830 | $662.90 | 53% |
| Twin Lakes | 35 | $6,152 | $547.55 | 43% |
| Lake Geneva | 209 | $5,014 | $473.36 | 41% |
| Town of Geneva | 63 | $5,012 | $448.89 | 43% |
| McHenry | 32 | $4,982 | $463.12 | 44% |
| Salem Lakes | 23 | $4,513 | $330.45 | 49% |
| Elmhurst | 16 | $4,469 | $355.09 | 49% |
| Fontana-on-Geneva Lake | 69 | $4,455 | $556.77 | 37% |
| Como | 53 | $4,236 | $387.43 | 41% |
| Addison Township | 19 | $4,214 | $362.67 | 42% |