Shiloh Airbnb Market Analysis 2026: Short Term Rental Data & Vacation Rental Statistics in Illinois, United States
Is Airbnb profitable in Shiloh in 2026? Explore comprehensive Airbnb analytics for Shiloh, Illinois, United States to uncover income potential. This 2026 STR market report for Shiloh, based on AirROI data from February 2025 to January 2026, reveals key trends in the niche market of 20 active listings.
Whether you're considering an Airbnb investment in Shiloh, optimizing your existing vacation rental, or exploring rental arbitrage opportunities, understanding the Shiloh Airbnb data is crucial. Leveraging the low regulation environment is key to maximizing your short term rental income potential. Let's dive into the specifics.
Key Shiloh Airbnb Performance Metrics Overview
Monthly Airbnb Revenue Variations & Income Potential in Shiloh (2026)
Understanding the monthly revenue variations for Airbnb listings in Shiloh is key to maximizing your short term rental income potential. Seasonality significantly impacts earnings. Our analysis, based on data from the past 12 months, shows that the peak revenue month for STRs in Shiloh is typically August, while January often presents the lowest earnings, highlighting opportunities for strategic pricing adjustments during shoulder and low seasons. Explore the typical Airbnb income in Shiloh across different performance tiers:
- Best-in-class properties (Top 10%) achieve $3,766+ monthly, often utilizing dynamic pricing and superior guest experiences.
- Strong performing properties (Top 25%) earn $3,115 or more, indicating effective management and desirable locations/amenities.
- Typical properties (Median) generate around $2,444 per month, representing the average market performance.
- Entry-level properties (Bottom 25%) see earnings around $1,735, often with potential for optimization.
Average Monthly Airbnb Earnings Trend in Shiloh
Shiloh Airbnb Occupancy Rate Trends (2026)
Maximize your bookings by understanding the Shiloh STR occupancy trends. Seasonal demand shifts significantly influence how often properties are booked. Typically, Aprilsees the highest demand (peak season occupancy), while January experiences the lowest (low season). Effective strategies, like adjusting minimum stays or offering promotions, can boost occupancy during slower periods. Here's how different property tiers perform in Shiloh:
- Best-in-class properties (Top 10%) achieve 84%+ occupancy, indicating high desirability and potentially optimized availability.
- Strong performing properties (Top 25%) maintain 77% or higher occupancy, suggesting good market fit and guest satisfaction.
- Typical properties (Median) have an occupancy rate around 59%.
- Entry-level properties (Bottom 25%) average 45% occupancy, potentially facing higher vacancy.
Average Monthly Occupancy Rate Trend in Shiloh
Average Daily Rate (ADR) Airbnb Trends in Shiloh (2026)
Effective short term rental pricing strategy in Shiloh involves understanding monthly ADR fluctuations. The Average Daily Rate (ADR) for Airbnb in Shiloh typically peaks in January and dips lowest during February. Leveraging Airbnb dynamic pricing tools or strategies based on this seasonality can significantly boost revenue. Here's a look at the typical nightly rates achieved:
- Best-in-class properties (Top 10%) command rates of $159+ per night, often due to premium features or locations.
- Strong performing properties (Top 25%) achieve nightly rates of $137 or more.
- Typical properties (Median) charge around $122 per night.
- Entry-level properties (Bottom 25%) earn around $102 per night.
Average Daily Rate (ADR) Trend by Month in Shiloh
Get Live Shiloh Market Intelligence 👇

Explore Real-time Analytics
Airbnb Seasonality Analysis & Trends in Shiloh (2026)
Peak Season (August, September, April)
- Revenue averages $2,886 per month
- Occupancy rates average 68.7%
- Daily rates average $122
Shoulder Season
- Revenue averages $2,606 per month
- Occupancy maintains around 62.9%
- Daily rates hold near $124
Low Season (January, February, December)
- Revenue drops to average $1,715 per month
- Occupancy decreases to average 43.7%
- Daily rates adjust to average $125
Seasonality Insights for Shiloh
- The Airbnb seasonality in Shiloh shows moderate seasonality with distinct peak and low periods. While the sections above show seasonal averages, it's also insightful to look at the extremes:
- During the high season, the absolute peak month showcases Shiloh's highest earning potential, with monthly revenues capable of climbing to $2,976, occupancy reaching a high of 75.3%, and ADRs peaking at $133.
- Conversely, the slowest single month of the year, typically falling within the low season, marks the market's lowest point. In this month, revenue might dip to $1,436, occupancy could drop to 34.4%, and ADRs may adjust down to $111.
- Understanding both the seasonal averages and these monthly peaks and troughs in revenue, occupancy, and ADR is crucial for maximizing your Airbnb profit potential in Shiloh.
Seasonal Strategies for Maximizing Profit
- Peak Season: Maximize revenue through premium pricing and potentially longer minimum stays. Ensure high availability.
- Low Season: Offer competitive pricing, special promotions (e.g., extended stay discounts), and flexible cancellation policies. Target off-season travelers like remote workers or budget-conscious guests.
- Shoulder Seasons: Implement dynamic pricing that balances peak and low rates. Target weekend travelers or specific events. Offer slightly more flexible terms than peak season.
- Regularly analyze your own performance against these Shiloh seasonality benchmarks and adjust your pricing and availability strategy accordingly.
Best Areas for Airbnb Investment in Shiloh (2026)
Exploring the top neighborhoods for short-term rentals in Shiloh? This section highlights key areas, outlining why they are attractive for hosts and guests, along with notable local attractions. Consider these locations based on your target guest profile and investment strategy.
| Neighborhood / Area | Why Host Here? (Target Guests & Appeal) | Key Attractions & Landmarks |
|---|---|---|
| Shiloh Main Street | The heart of Shiloh, featuring local businesses, restaurants, and easy access to nearby attractions. It's a community hub that attracts visitors looking for a more local experience. | Shiloh Central Park, Shiloh Valley Park, Shiloh's Historic Downtown, Local Restaurants and Cafes, Shiloh Farmers Market |
| Scott Air Force Base | A significant military installation that attracts families and personnel looking for temporary housing. Ideal for hosts who cater to military families and visitors. | Scott Air Force Base, Boeing Museum of Flight, Nature trails near base, Community Events at the Base |
| Fairview Heights | Just a short drive from Shiloh, this area offers shopping and dining options. It’s appealing to visitors looking for convenient amenities. | St. Clair Square Mall, Principal Park, Local Restaurants, Movies and Entertainment |
| O'Fallon | A neighboring city with family-friendly amenities and parks. Attractive to those seeking a suburban getaway and local experience. | O'Fallon Community Park, O'Fallon Historical Society, Local Shops and Dining, O'Fallon Sports Park |
| Belleville | A nearby city with a rich history and cultural attractions. Hosts can cater to guests looking to explore the area's historical significance. | Belleville Historic District, Labor and Industry Museum, Belleville Parks and Recreation, Local Events |
| Collinsville | Famous for the Cahokia Mounds, this city attracts tourists interested in history and archaeology, providing a unique draw for Airbnb hosts. | Cahokia Mounds, Collinsville Historical Museum, Local Festivals, Gateway Center |
| Metro East St. Louis | Part of the growing Metro East area, this location offers proximity to St. Louis attractions and entertainment, appealing to visitors looking for convenience. | Gateway Arch, St. Louis Zoo, City Museum, Enterprise Center |
| New Baden | A laid-back village atmosphere near Shiloh, appealing to families looking for a quiet retreat while still being close to a vibrant area. | New Baden Village Park, Local Events, Festival of Lights, Wineries nearby |
Understanding Airbnb License Requirements & STR Laws in Shiloh (2026)
While Shiloh, Illinois, United States currently shows low STR regulations, specific Airbnb license requirements might still exist or change. Always verify the latest short term rental regulations and Airbnb license requirements directly with local government authorities for Shiloh to ensure full compliance before hosting.
(Source: AirROI data, 2026, finding no licensed listings among those analyzed)
Top Performing Airbnb Properties in Shiloh (2026)
Benchmark your potential! Explore examples of top-performing Airbnb properties in Shilohbased on Trailing Twelve Month (TTM) revenue. Analyze their characteristics, revenue, occupancy rate, and ADR to understand what drives success in this market.
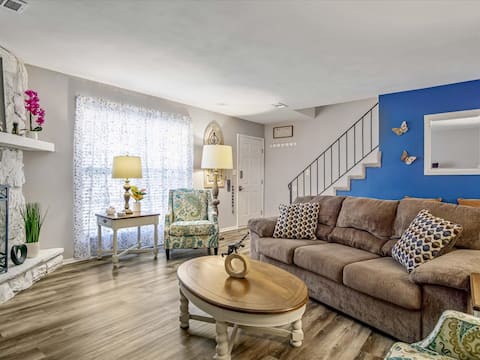
Tranquil 3 Bedroom Townhome, With king size bed.
Entire Place • 3 bedrooms

Christy's Place, Belleville, IL
Entire Place • 3 bedrooms

Skyline - Military / Family Friendly
Entire Place • 3 bedrooms
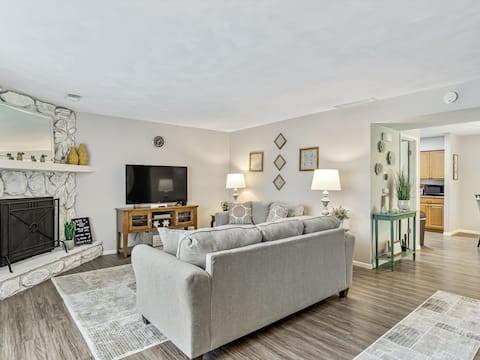
Beautiful 3-Bedroom Townhome 1.5 Bath & King bed
Entire Place • 3 bedrooms
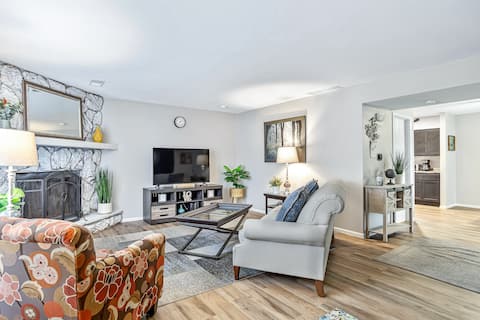
Cheerful 3-Bedroom Townhome | 1.5 Bath | King Bed
Entire Place • 3 bedrooms
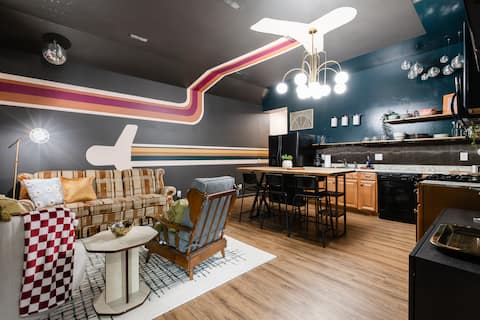
The PanAm Flat - 2BR/2BA - Hospital/ScottAFB
Entire Place • 2 bedrooms
Note: Performance varies based on location, size, amenities, seasonality, and management quality. Data reflects the past 12 months.
Top Performing Airbnb Hosts in Shiloh (2026)
Learn from the best! This table showcases top-performing Airbnb hosts in Shiloh based on the number of properties managed and estimated total revenue over the past year. Analyze their scale and performance metrics.
| Host Name | Properties | Grossing Revenue | Stay Reviews | Avg Rating |
|---|---|---|---|---|
| Alex | 6 | $148,383 | 445 | 4.93/5.0 |
| David | 3 | $107,488 | 546 | 4.91/5.0 |
| Susan | 2 | $56,858 | 182 | 4.74/5.0 |
| Errol Or Lillian | 1 | $37,627 | 44 | 4.73/5.0 |
| Ej | 1 | $31,902 | 96 | 4.75/5.0 |
| Tammy | 1 | $25,568 | 66 | 4.97/5.0 |
| Rocky & Leigh Ann | 1 | $19,430 | 33 | 4.97/5.0 |
| Amy | 1 | $17,640 | 69 | 4.91/5.0 |
| William | 1 | $13,000 | 38 | 4.84/5.0 |
| Abbey | 2 | $8,432 | 29 | 4.81/5.0 |
Analyzing the strategies of top hosts, such as their property selection, pricing, and guest communication, can offer valuable lessons for optimizing your own Airbnb operations in Shiloh.
Dive Deeper: Advanced Shiloh STR Market Data (2026)
Ready to unlock more insights? AirROI provides access to advanced metrics and comprehensive Airbnb data for Shiloh. Explore detailed analytics beyond this report to refine your investment strategy, optimize pricing, and maximize your vacation rental profits.
Explore Advanced MetricsShiloh Short-Term Rental Market Composition (2026): Property & Room Types
Room Type Distribution
Property Type Distribution
Market Composition Insights for Shiloh
- The Shiloh Airbnb market composition is heavily skewed towards Entire Home/Apt listings, which make up 100% of the 20 active rentals. This indicates strong guest preference for privacy and space.
- Looking at the property type distribution in Shiloh, House properties are the most common (65%), reflecting the local real estate landscape.
- Houses represent a significant 65% portion, catering likely to families or larger groups.
Shiloh Airbnb Room Capacity Analysis (2026): Bedroom Distribution
Distribution of Listings by Number of Bedrooms
Room Capacity Insights for Shiloh
- The dominant room capacity in Shiloh is 2 bedrooms listings, making up 45% of the market. This suggests a strong demand for properties suitable for couples or solo travelers.
- Together, 2 bedrooms and 3 bedrooms properties represent 80.0% of the active Airbnb listings in Shiloh, indicating a high concentration in these sizes.
- A significant 35.0% of listings offer 3+ bedrooms, catering to larger groups and families seeking more space in Shiloh.
Shiloh Vacation Rental Guest Capacity Trends (2026)
Distribution of Listings by Guest Capacity
Guest Capacity Insights for Shiloh
- The most common guest capacity trend in Shiloh vacation rentals is listings accommodating 4 guests (30%). This suggests the primary traveler segment is likely small families or groups.
- Properties designed for 4 guests and 6 guests dominate the Shiloh STR market, accounting for 55.0% of listings.
- 45.0% of properties accommodate 6+ guests, serving the market segment for larger families or group travel in Shiloh.
- On average, properties in Shiloh are equipped to host 5.0 guests.
Shiloh Airbnb Booking Patterns (2026): Available vs. Booked Days
Available Days Distribution
Booked Days Distribution
Booking Pattern Insights for Shiloh
- The most common availability pattern in Shiloh falls within the 91-180 days range, representing 50% of listings. This suggests many properties have significant open periods on their calendars.
- Approximately 40.0% of listings show high availability (181+ days open annually), indicating potential for increased bookings or specific owner usage patterns.
- For booked days, the 181-270 days range is most frequent in Shiloh (50%), reflecting common guest stay durations or potential owner blocking patterns.
- A notable 60.0% of properties secure long booking periods (181+ days booked per year), highlighting successful long-term rental strategies or significant owner usage.
Shiloh Airbnb Minimum Stay Requirements Analysis
Distribution of Listings by Minimum Night Requirement
1 Night
5 listings
25% of total
2 Nights
2 listings
10% of total
3 Nights
2 listings
10% of total
4-6 Nights
4 listings
20% of total
7-29 Nights
2 listings
10% of total
30+ Nights
5 listings
25% of total
Key Insights
- The most prevalent minimum stay requirement in Shiloh is 1 Night, adopted by 25% of listings. This highlights the market's preference for shorter, flexible bookings.
- A significant segment (25%) caters to monthly stays (30+ nights) in Shiloh, pointing to opportunities in the extended-stay market.
Recommendations
- Align with the market by considering a 1 Night minimum stay, as 25% of Shiloh hosts use this setting.
- If feasible, allowing 1-night stays, especially midweek or during low season, could capture last-minute bookings, as only 25% currently do.
- Explore offering discounts for stays of 30+ nights to attract the 25% of the market seeking extended stays.
- Adjust minimum nights based on seasonality – potentially shorter during low season and longer during peak demand periods in Shiloh.
Shiloh Airbnb Cancellation Policy Trends Analysis (2026)
Flexible
5 listings
25% of total
Moderate
9 listings
45% of total
Firm
6 listings
30% of total
Cancellation Policy Insights for Shiloh
- The prevailing Airbnb cancellation policy trend in Shiloh is Moderate, used by 45% of listings.
- There's a relatively balanced mix between guest-friendly (70.0%) and stricter (30.0%) policies, offering choices for different guest needs.
Recommendations for Hosts
- Consider adopting a Moderate policy to align with the 45% market standard in Shiloh.
- Regularly review your cancellation policy against competitors and market demand shifts in Shiloh.
Shiloh STR Booking Lead Time Analysis (2026)
Average Booking Lead Time by Month
Booking Lead Time Insights for Shiloh
- The overall average booking lead time for vacation rentals in Shiloh is 29 days.
- Guests book furthest in advance for stays during July (average 71 days), likely coinciding with peak travel demand or local events.
- The shortest booking windows occur for stays in January (average 9 days), indicating more last-minute travel plans during this time.
- Seasonally, Summer (44 days avg.) sees the longest lead times, while Winter (19 days avg.) has the shortest, reflecting typical travel planning cycles.
Recommendations for Hosts
- Use the overall average lead time (29 days) as a baseline for your pricing and availability strategy in Shiloh.
- For July stays, consider implementing length-of-stay discounts or slightly higher rates for bookings made less than 71 days out to capitalize on advance planning.
- During January, focus on last-minute booking availability and promotions, as guests book with very short notice (9 days avg.).
- Target marketing efforts for the Summer season well in advance (at least 44 days) to capture early planners.
- Monitor your own booking lead times against these Shiloh averages to identify opportunities for dynamic pricing adjustments.
Popular & Essential Airbnb Amenities in Shiloh (2026)
Amenity Prevalence
Amenity Insights for Shiloh
- Essential amenities in Shiloh that guests expect include: TV, Air conditioning, Fire extinguisher, Smoke alarm, Kitchen, Wifi, Free parking on premises, Washer, Carbon monoxide alarm, Heating. Lacking these (any) could significantly impact bookings.
Recommendations for Hosts
- Ensure your listing includes all essential amenities for Shiloh: TV, Air conditioning, Fire extinguisher, Smoke alarm, Kitchen, Wifi, Free parking on premises, Washer, Carbon monoxide alarm, Heating.
- Prioritize adding missing essentials: Heating.
- Highlight unique or less common amenities you offer (e.g., hot tub, dedicated workspace, EV charger) in your listing description and photos.
- Regularly check competitor amenities in Shiloh to stay competitive.
Shiloh Airbnb Guest Demographics & Profile Analysis (2026)
Guest Profile Summary for Shiloh
- The typical guest profile for Airbnb in Shiloh consists of primarily domestic travelers (97%), often arriving from nearby Chicago, typically belonging to the Post-2000s (Gen Z/Alpha) group (50%), primarily speaking English or Spanish.
- Domestic travelers account for 97.2% of guests.
- Key international markets include United States (97.2%) and Canada (0.9%).
- Top languages spoken are English (80.4%) followed by Spanish (13.7%).
- A significant demographic segment is the Post-2000s (Gen Z/Alpha) group, representing 50% of guests.
Recommendations for Hosts
- Target domestic marketing efforts towards travelers from Chicago and Columbia.
- Tailor amenities and listing descriptions to appeal to the dominant Post-2000s (Gen Z/Alpha) demographic (e.g., highlight fast WiFi, smart home features, local guides).
- Highlight unique local experiences or amenities relevant to the primary guest profile.
- Consider seasonal promotions aligned with peak travel times for key origin markets.
Nearby Short-Term Rental Market Comparison
How does the Shiloh Airbnb market stack up against its neighbors? Compare key performance metrics like average monthly revenue, ADR, and occupancy rates in surrounding areas to understand the broader regional STR landscape.
| Market | Active Properties | Monthly Revenue | Daily Rate | Avg. Occupancy |
|---|---|---|---|---|
| Ste. Genevieve | 13 | $3,781 | $375.74 | 36% |
| Creve Coeur | 10 | $3,420 | $282.01 | 42% |
| Creal Springs | 27 | $3,336 | $322.27 | 39% |
| Makanda | 19 | $3,145 | $247.99 | 51% |
| Effingham | 22 | $3,085 | $277.14 | 44% |
| Godfrey | 10 | $3,077 | $217.89 | 50% |
| Goreville | 36 | $3,045 | $254.54 | 42% |
| Marion | 10 | $3,038 | $346.35 | 29% |
| Maryland Heights | 19 | $2,989 | $219.63 | 55% |
| Wentzville | 19 | $2,964 | $195.63 | 51% |