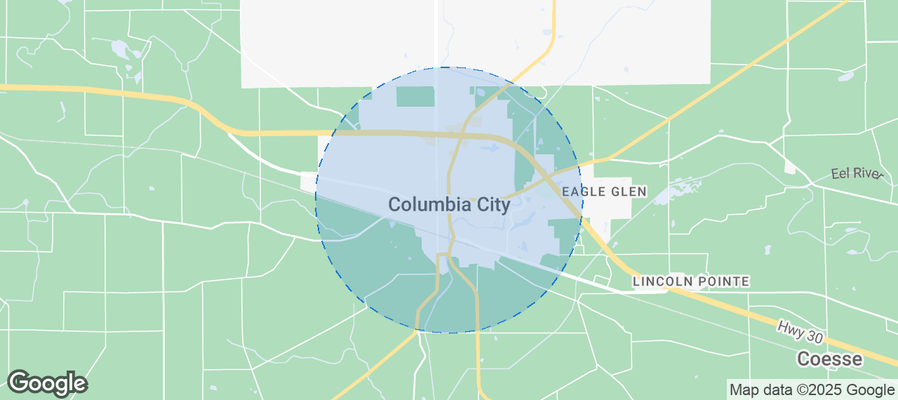
Columbia City Airbnb Market Analysis 2025: Short Term Rental Data & Vacation Rental Statistics in Indiana, United States
Is Airbnb profitable in Columbia City in 2025? Explore comprehensive Airbnb analytics for Columbia City, Indiana, United States to uncover income potential. This 2025 STR market report for Columbia City, based on AirROI data from October 2024 to September 2025, reveals key trends in the niche market of 18 active listings.
Whether you're considering an Airbnb investment in Columbia City, optimizing your existing vacation rental, or exploring rental arbitrage opportunities, understanding the Columbia City Airbnb data is crucial. Leveraging the low regulation environment is key to maximizing your short term rental income potential. Let's dive into the specifics.
Key Columbia City Airbnb Performance Metrics Overview
Monthly Airbnb Revenue Variations & Income Potential in Columbia City (2025)
Understanding the monthly revenue variations for Airbnb listings in Columbia City is key to maximizing your short term rental income potential. Seasonality significantly impacts earnings. Our analysis, based on data from the past 12 months, shows that the peak revenue month for STRs in Columbia City is typically July, while November often presents the lowest earnings, highlighting opportunities for strategic pricing adjustments during shoulder and low seasons. Explore the typical Airbnb income in Columbia City across different performance tiers:
- Best-in-class properties (Top 10%) achieve $2,940+ monthly, often utilizing dynamic pricing and superior guest experiences.
- Strong performing properties (Top 25%) earn $1,947 or more, indicating effective management and desirable locations/amenities.
- Typical properties (Median) generate around $1,024 per month, representing the average market performance.
- Entry-level properties (Bottom 25%) see earnings around $527, often with potential for optimization.
Average Monthly Airbnb Earnings Trend in Columbia City
Columbia City Airbnb Occupancy Rate Trends (2025)
Maximize your bookings by understanding the Columbia City STR occupancy trends. Seasonal demand shifts significantly influence how often properties are booked. Typically, Marchsees the highest demand (peak season occupancy), while January experiences the lowest (low season). Effective strategies, like adjusting minimum stays or offering promotions, can boost occupancy during slower periods. Here's how different property tiers perform in Columbia City:
- Best-in-class properties (Top 10%) achieve 73%+ occupancy, indicating high desirability and potentially optimized availability.
- Strong performing properties (Top 25%) maintain 57% or higher occupancy, suggesting good market fit and guest satisfaction.
- Typical properties (Median) have an occupancy rate around 34%.
- Entry-level properties (Bottom 25%) average 18% occupancy, potentially facing higher vacancy.
Average Monthly Occupancy Rate Trend in Columbia City
Average Daily Rate (ADR) Airbnb Trends in Columbia City (2025)
Effective short term rental pricing strategy in Columbia City involves understanding monthly ADR fluctuations. The Average Daily Rate (ADR) for Airbnb in Columbia City typically peaks in July and dips lowest during March. Leveraging Airbnb dynamic pricing tools or strategies based on this seasonality can significantly boost revenue. Here's a look at the typical nightly rates achieved:
- Best-in-class properties (Top 10%) command rates of $221+ per night, often due to premium features or locations.
- Strong performing properties (Top 25%) achieve nightly rates of $160 or more.
- Typical properties (Median) charge around $95 per night.
- Entry-level properties (Bottom 25%) earn around $68 per night.
Average Daily Rate (ADR) Trend by Month in Columbia City
Get Live Columbia City Market Intelligence 👇
Explore Real-time Analytics
Airbnb Seasonality Analysis & Trends in Columbia City (2025)
Peak Season (July, August, June)
- Revenue averages $1,903 per month
- Occupancy rates average 41.6%
- Daily rates average $138
Shoulder Season
- Revenue averages $1,345 per month
- Occupancy maintains around 41.9%
- Daily rates hold near $112
Low Season (January, February, November)
- Revenue drops to average $946 per month
- Occupancy decreases to average 31.6%
- Daily rates adjust to average $102
Seasonality Insights for Columbia City
- The Airbnb seasonality in Columbia City shows highly seasonal trends requiring careful strategy. While the sections above show seasonal averages, it's also insightful to look at the extremes:
- During the high season, the absolute peak month showcases Columbia City's highest earning potential, with monthly revenues capable of climbing to $2,270, occupancy reaching a high of 46.3%, and ADRs peaking at $142.
- Conversely, the slowest single month of the year, typically falling within the low season, marks the market's lowest point. In this month, revenue might dip to $845, occupancy could drop to 27.4%, and ADRs may adjust down to $99.
- Understanding both the seasonal averages and these monthly peaks and troughs in revenue, occupancy, and ADR is crucial for maximizing your Airbnb profit potential in Columbia City.
Seasonal Strategies for Maximizing Profit
- Peak Season: Maximize revenue through premium pricing and potentially longer minimum stays. Ensure high availability.
- Low Season: Offer competitive pricing, special promotions (e.g., extended stay discounts), and flexible cancellation policies. Target off-season travelers like remote workers or budget-conscious guests.
- Shoulder Seasons: Implement dynamic pricing that balances peak and low rates. Target weekend travelers or specific events. Offer slightly more flexible terms than peak season.
- Regularly analyze your own performance against these Columbia City seasonality benchmarks and adjust your pricing and availability strategy accordingly.
Best Areas for Airbnb Investment in Columbia City (2025)
Exploring the top neighborhoods for short-term rentals in Columbia City? This section highlights key areas, outlining why they are attractive for hosts and guests, along with notable local attractions. Consider these locations based on your target guest profile and investment strategy.
| Neighborhood / Area | Why Host Here? (Target Guests & Appeal) | Key Attractions & Landmarks |
|---|---|---|
| Historic Downtown Columbia City | Charming small-town atmosphere with rich history. Ideal for visitors who appreciate local shops, cafes, and a close-knit community feel. | Columbia City Courthouse, Whitley County Historical Museum, Columbia City Park, Coney Island Park, local boutiques and eateries |
| Chain O'Lakes State Park | A beautiful natural area perfect for outdoor enthusiasts. Offers opportunities for boating, fishing, and hiking, appealing to nature lovers and families. | Chain O'Lakes, hiking trails, fishing spots, camping grounds, picnic areas |
| Columbia City Golf Course | A relaxing environment for vacationers and golf enthusiasts. Ideal for those looking for leisure activities during their stay. | 18-hole golf course, scenic views, golf tournaments, clubhouse, adjacent parks |
| Parker Cemetery | Historical site attracting those interested in genealogy and local history, offering a serene atmosphere for reflection and learning about local heritage. | historic tombstones, guided tours, community events, educational programs |
| Columbia City Community Center | A hub for local events, programs, and gatherings, appealing to visitors who want a taste of local culture and community participation. | community events, sports activities, art classes, local markets, seasonal festivals |
| Whitley County Fairgrounds | Exciting destination for visitors during the fair season, offering a range of activities and entertainment showcasing local talent and culture. | Whitley County Fair, gatherings and competitions, seasonal events, agriculture exhibits, local vendors |
| Coney Island Park | Ideal for families and groups looking to enjoy a day outdoors with playgrounds, picnic areas, and recreational facilities. | playgrounds, walking trails, sports fields, picnic areas, community events |
| North Park | A peaceful residential area with proximity to parks and shopping, attracting families and those seeking a quiet retreat. | local parks, shopping access, restaurants, quiet streets, friendly neighborhood |
Understanding Airbnb License Requirements & STR Laws in Columbia City (2025)
While Columbia City, Indiana, United States currently shows low STR regulations, specific Airbnb license requirements might still exist or change. Always verify the latest short term rental regulations and Airbnb license requirements directly with local government authorities for Columbia City to ensure full compliance before hosting.
(Source: AirROI data, 2025, finding no licensed listings among those analyzed)
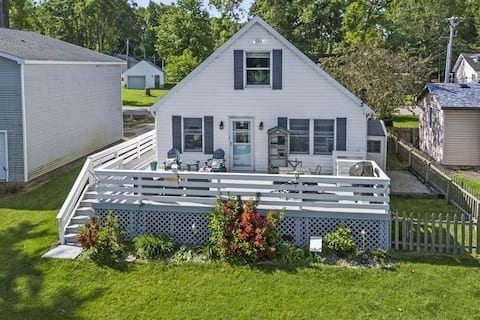
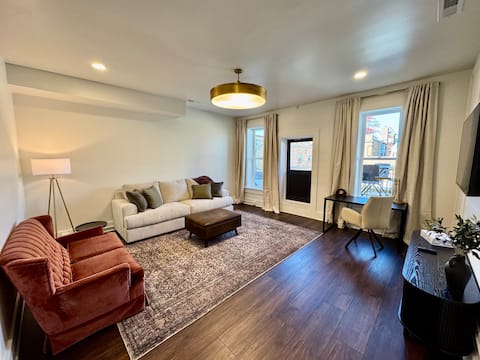
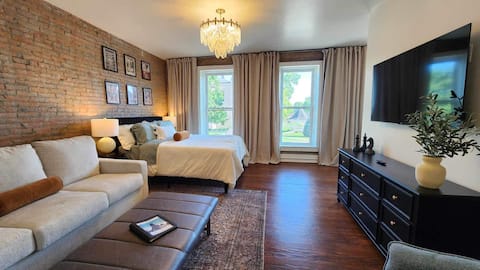
Top Performing Airbnb Properties in Columbia City (2025)
Benchmark your potential! Explore examples of top-performing Airbnb properties in Columbia Citybased on Trailing Twelve Month (TTM) revenue. Analyze their characteristics, revenue, occupancy rate, and ADR to understand what drives success in this market.
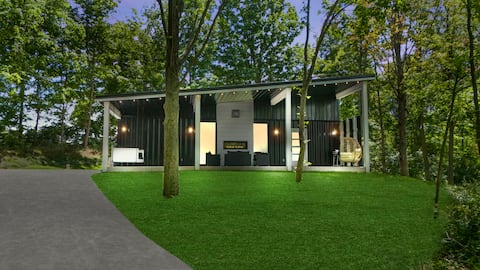
The Steel Oasis-Container Home w/ Hot Tub!
Entire Place • 1 bedroom
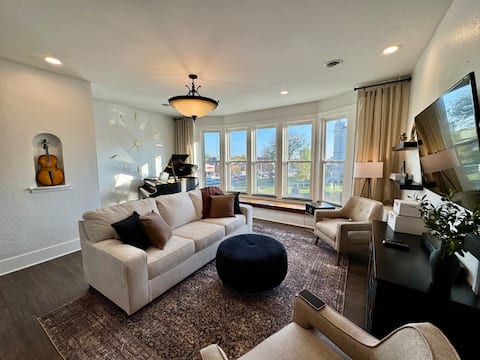
The Eugene on Van Buren
Entire Place • 2 bedrooms
The Lily Pad on Loon Lake | Lake view house + dock
Entire Place • 4 bedrooms
The Ruth Ann on Van Buren
Entire Place • 1 bedroom

This two bedroom Lake Home is magical !
Entire Place • 2 bedrooms
The Michelle on Van Buren
Entire Place • 1 bedroom
Note: Performance varies based on location, size, amenities, seasonality, and management quality. Data reflects the past 12 months.
Top Performing Airbnb Hosts in Columbia City (2025)
Learn from the best! This table showcases top-performing Airbnb hosts in Columbia City based on the number of properties managed and estimated total revenue over the past year. Analyze their scale and performance metrics.
| Host Name | Properties | Grossing Revenue | Stay Reviews | Avg Rating |
|---|---|---|---|---|
| Atalie | 4 | $59,685 | 138 | 4.96/5.0 |
| Nikki | 1 | $50,561 | 149 | 4.95/5.0 |
| JoAnn | 3 | $22,096 | 583 | 4.85/5.0 |
| Seth | 2 | $20,357 | 182 | 4.92/5.0 |
| Cornerstone Property Managemen | 1 | $16,876 | 12 | 4.67/5.0 |
| John | 1 | $13,548 | 16 | 4.75/5.0 |
| Houston | 1 | $7,555 | 6 | 4.67/5.0 |
| Michelle | 1 | $6,994 | 196 | 4.97/5.0 |
| Alisha | 1 | $5,654 | 76 | 4.97/5.0 |
| Dalen | 1 | $4,677 | 16 | 4.94/5.0 |
Analyzing the strategies of top hosts, such as their property selection, pricing, and guest communication, can offer valuable lessons for optimizing your own Airbnb operations in Columbia City.
Dive Deeper: Advanced Columbia City STR Market Data (2025)
Ready to unlock more insights? AirROI provides access to advanced metrics and comprehensive Airbnb data for Columbia City. Explore detailed analytics beyond this report to refine your investment strategy, optimize pricing, and maximize your vacation rental profits.
Explore Advanced MetricsColumbia City Short-Term Rental Market Composition (2025): Property & Room Types
Room Type Distribution
Property Type Distribution
Market Composition Insights for Columbia City
- The Columbia City Airbnb market composition is heavily skewed towards Entire Home/Apt listings, which make up 94.4% of the 18 active rentals. This indicates strong guest preference for privacy and space.
- Looking at the property type distribution in Columbia City, Apartment/Condo properties are the most common (61.1%), reflecting the local real estate landscape.
- Houses represent a significant 22.2% portion, catering likely to families or larger groups.
- The presence of 5.6% Hotel/Boutique listings indicates integration with traditional hospitality.
Columbia City Airbnb Room Capacity Analysis (2025): Bedroom Distribution
Distribution of Listings by Number of Bedrooms
Room Capacity Insights for Columbia City
- The dominant room capacity in Columbia City is 1 bedroom listings, making up 66.7% of the market. This suggests a strong demand for properties suitable for couples or solo travelers.
- Together, 1 bedroom and 2 bedrooms properties represent 88.9% of the active Airbnb listings in Columbia City, indicating a high concentration in these sizes.
- With over half the market (66.7%) consisting of studios or 1-bedroom units, Columbia City is particularly well-suited for individuals or couples.
Columbia City Vacation Rental Guest Capacity Trends (2025)
Distribution of Listings by Guest Capacity
Guest Capacity Insights for Columbia City
- The most common guest capacity trend in Columbia City vacation rentals is listings accommodating 4 guests (33.3%). This suggests the primary traveler segment is likely small families or groups.
- Properties designed for 4 guests and 6 guests dominate the Columbia City STR market, accounting for 50.0% of listings.
- 27.8% of properties accommodate 6+ guests, serving the market segment for larger families or group travel in Columbia City.
- On average, properties in Columbia City are equipped to host 4.3 guests.
Columbia City Airbnb Booking Patterns (2025): Available vs. Booked Days
Available Days Distribution
Booked Days Distribution
Booking Pattern Insights for Columbia City
- The most common availability pattern in Columbia City falls within the 271-366 days range, representing 50% of listings. This suggests many properties have significant open periods on their calendars.
- Approximately 94.4% of listings show high availability (181+ days open annually), indicating potential for increased bookings or specific owner usage patterns.
- For booked days, the 91-180 days range is most frequent in Columbia City (44.4%), reflecting common guest stay durations or potential owner blocking patterns.
- A notable 5.6% of properties secure long booking periods (181+ days booked per year), highlighting successful long-term rental strategies or significant owner usage.
Columbia City Airbnb Minimum Stay Requirements Analysis
Distribution of Listings by Minimum Night Requirement
1 Night
11 listings
61.1% of total
2 Nights
1 listings
5.6% of total
4-6 Nights
1 listings
5.6% of total
7-29 Nights
2 listings
11.1% of total
30+ Nights
3 listings
16.7% of total
Key Insights
- The most prevalent minimum stay requirement in Columbia City is 1 Night, adopted by 61.1% of listings. This highlights the market's preference for shorter, flexible bookings.
- A strong majority (66.7%) of the Columbia City Airbnb data shows acceptance of very short stays (1-2 nights), indicating a dynamic, high-turnover market.
- A significant segment (16.7%) caters to monthly stays (30+ nights) in Columbia City, pointing to opportunities in the extended-stay market.
Recommendations
- Align with the market by considering a 1 Night minimum stay, as 61.1% of Columbia City hosts use this setting.
- Explore offering discounts for stays of 30+ nights to attract the 16.7% of the market seeking extended stays.
- Adjust minimum nights based on seasonality – potentially shorter during low season and longer during peak demand periods in Columbia City.
Columbia City Airbnb Cancellation Policy Trends Analysis (2025)
Flexible
4 listings
22.2% of total
Moderate
9 listings
50% of total
Firm
5 listings
27.8% of total
Cancellation Policy Insights for Columbia City
- The prevailing Airbnb cancellation policy trend in Columbia City is Moderate, used by 50% of listings.
- The market strongly favors guest-friendly terms, with 72.2% of listings offering Flexible or Moderate policies. This suggests guests in Columbia City may expect booking flexibility.
Recommendations for Hosts
- Consider adopting a Moderate policy to align with the 50% market standard in Columbia City.
- Regularly review your cancellation policy against competitors and market demand shifts in Columbia City.
Columbia City STR Booking Lead Time Analysis (2025)
Average Booking Lead Time by Month
Booking Lead Time Insights for Columbia City
- The overall average booking lead time for vacation rentals in Columbia City is 21 days.
- Guests book furthest in advance for stays during July (average 34 days), likely coinciding with peak travel demand or local events.
- The shortest booking windows occur for stays in January (average 10 days), indicating more last-minute travel plans during this time.
- Seasonally, Summer (29 days avg.) sees the longest lead times, while Winter (15 days avg.) has the shortest, reflecting typical travel planning cycles.
Recommendations for Hosts
- Use the overall average lead time (21 days) as a baseline for your pricing and availability strategy in Columbia City.
- For July stays, consider implementing length-of-stay discounts or slightly higher rates for bookings made less than 34 days out to capitalize on advance planning.
- During January, focus on last-minute booking availability and promotions, as guests book with very short notice (10 days avg.).
- Target marketing efforts for the Summer season well in advance (at least 29 days) to capture early planners.
- Monitor your own booking lead times against these Columbia City averages to identify opportunities for dynamic pricing adjustments.
Popular & Essential Airbnb Amenities in Columbia City (2025)
Amenity Prevalence
Amenity Insights for Columbia City
- Essential amenities in Columbia City that guests expect include: Smoke alarm, Heating, Microwave, Hot water, Air conditioning, Essentials. Lacking these (any) could significantly impact bookings.
- Popular amenities like Refrigerator, Coffee maker, Shampoo are common but not universal. Offering these can provide a competitive edge.
Recommendations for Hosts
- Ensure your listing includes all essential amenities for Columbia City: Smoke alarm, Heating, Microwave, Hot water, Air conditioning, Essentials.
- Consider adding popular differentiators like Refrigerator or Coffee maker to increase appeal.
- Highlight unique or less common amenities you offer (e.g., hot tub, dedicated workspace, EV charger) in your listing description and photos.
- Regularly check competitor amenities in Columbia City to stay competitive.
Columbia City Airbnb Guest Demographics & Profile Analysis (2025)
Guest Profile Summary for Columbia City
- The typical guest profile for Airbnb in Columbia City consists of primarily domestic travelers (97%), often arriving from nearby Chicago, typically belonging to the Post-2000s (Gen Z/Alpha) group (50%), primarily speaking English or Spanish.
- Domestic travelers account for 96.6% of guests.
- Key international markets include United States (96.6%) and Canada (1%).
- Top languages spoken are English (70.2%) followed by Spanish (11.6%).
- A significant demographic segment is the Post-2000s (Gen Z/Alpha) group, representing 50% of guests.
Recommendations for Hosts
- Target domestic marketing efforts towards travelers from Chicago and Fort Wayne.
- Tailor amenities and listing descriptions to appeal to the dominant Post-2000s (Gen Z/Alpha) demographic (e.g., highlight fast WiFi, smart home features, local guides).
- Highlight unique local experiences or amenities relevant to the primary guest profile.
- Consider seasonal promotions aligned with peak travel times for key origin markets.
Nearby Short-Term Rental Market Comparison
How does the Columbia City Airbnb market stack up against its neighbors? Compare key performance metrics like average monthly revenue, ADR, and occupancy rates in surrounding areas to understand the broader regional STR landscape.
| Market | Active Properties | Monthly Revenue | Daily Rate | Avg. Occupancy |
|---|---|---|---|---|
| Laketown Township | 63 | $5,739 | $531.07 | 42% |
| Port Sheldon Township | 28 | $5,678 | $559.23 | 45% |
| Paw Paw Township | 11 | $5,404 | $418.47 | 49% |
| Saugatuck Township | 144 | $5,276 | $496.98 | 41% |
| Fremont | 14 | $5,216 | $415.89 | 43% |
| Ganges Township | 73 | $5,140 | $621.26 | 36% |
| New Buffalo Township | 266 | $5,030 | $640.03 | 35% |
| Fennville | 10 | $4,734 | $396.47 | 39% |
| New Buffalo | 142 | $4,621 | $444.89 | 40% |
| Casco Township | 143 | $4,611 | $483.39 | 38% |