Lucas Airbnb Market Analysis 2025: Short Term Rental Data & Vacation Rental Statistics in Kansas, United States
Is Airbnb profitable in Lucas in 2025? Explore comprehensive Airbnb analytics for Lucas, Kansas, United States to uncover income potential. This 2025 STR market report for Lucas, based on AirROI data from September 2024 to August 2025, reveals key trends in the niche market of 19 active listings.
Whether you're considering an Airbnb investment in Lucas, optimizing your existing vacation rental, or exploring rental arbitrage opportunities, understanding the Lucas Airbnb data is crucial. Leveraging the low regulation environment is key to maximizing your short term rental income potential. Let's dive into the specifics.
Key Lucas Airbnb Performance Metrics Overview
Monthly Airbnb Revenue Variations & Income Potential in Lucas (2025)
Understanding the monthly revenue variations for Airbnb listings in Lucas is key to maximizing your short term rental income potential. Seasonality significantly impacts earnings. Our analysis, based on data from the past 12 months, shows that the peak revenue month for STRs in Lucas is typically September, while April often presents the lowest earnings, highlighting opportunities for strategic pricing adjustments during shoulder and low seasons. Explore the typical Airbnb income in Lucas across different performance tiers:
- Best-in-class properties (Top 10%) achieve $2,382+ monthly, often utilizing dynamic pricing and superior guest experiences.
- Strong performing properties (Top 25%) earn $1,496 or more, indicating effective management and desirable locations/amenities.
- Typical properties (Median) generate around $802 per month, representing the average market performance.
- Entry-level properties (Bottom 25%) see earnings around $475, often with potential for optimization.
Average Monthly Airbnb Earnings Trend in Lucas
Lucas Airbnb Occupancy Rate Trends (2025)
Maximize your bookings by understanding the Lucas STR occupancy trends. Seasonal demand shifts significantly influence how often properties are booked. Typically, Septembersees the highest demand (peak season occupancy), while April experiences the lowest (low season). Effective strategies, like adjusting minimum stays or offering promotions, can boost occupancy during slower periods. Here's how different property tiers perform in Lucas:
- Best-in-class properties (Top 10%) achieve 80%+ occupancy, indicating high desirability and potentially optimized availability.
- Strong performing properties (Top 25%) maintain 61% or higher occupancy, suggesting good market fit and guest satisfaction.
- Typical properties (Median) have an occupancy rate around 30%.
- Entry-level properties (Bottom 25%) average 16% occupancy, potentially facing higher vacancy.
Average Monthly Occupancy Rate Trend in Lucas
Average Daily Rate (ADR) Airbnb Trends in Lucas (2025)
Effective short term rental pricing strategy in Lucas involves understanding monthly ADR fluctuations. The Average Daily Rate (ADR) for Airbnb in Lucas typically peaks in November and dips lowest during April. Leveraging Airbnb dynamic pricing tools or strategies based on this seasonality can significantly boost revenue. Here's a look at the typical nightly rates achieved:
- Best-in-class properties (Top 10%) command rates of $136+ per night, often due to premium features or locations.
- Strong performing properties (Top 25%) achieve nightly rates of $118 or more.
- Typical properties (Median) charge around $76 per night.
- Entry-level properties (Bottom 25%) earn around $75 per night.
Average Daily Rate (ADR) Trend by Month in Lucas
Get Live Lucas Market Intelligence 👇

Explore Real-time Analytics
Airbnb Seasonality Analysis & Trends in Lucas (2025)
Peak Season (September, December, October)
- Revenue averages $1,444 per month
- Occupancy rates average 53.1%
- Daily rates average $110
Shoulder Season
- Revenue averages $1,092 per month
- Occupancy maintains around 38.4%
- Daily rates hold near $105
Low Season (March, April, June)
- Revenue drops to average $711 per month
- Occupancy decreases to average 25.5%
- Daily rates adjust to average $101
Seasonality Insights for Lucas
- The Airbnb seasonality in Lucas shows highly seasonal trends requiring careful strategy. While the sections above show seasonal averages, it's also insightful to look at the extremes:
- During the high season, the absolute peak month showcases Lucas's highest earning potential, with monthly revenues capable of climbing to $1,579, occupancy reaching a high of 58.7%, and ADRs peaking at $111.
- Conversely, the slowest single month of the year, typically falling within the low season, marks the market's lowest point. In this month, revenue might dip to $628, occupancy could drop to 23.1%, and ADRs may adjust down to $92.
- Understanding both the seasonal averages and these monthly peaks and troughs in revenue, occupancy, and ADR is crucial for maximizing your Airbnb profit potential in Lucas.
Seasonal Strategies for Maximizing Profit
- Peak Season: Maximize revenue through premium pricing and potentially longer minimum stays. Ensure high availability.
- Low Season: Offer competitive pricing, special promotions (e.g., extended stay discounts), and flexible cancellation policies. Target off-season travelers like remote workers or budget-conscious guests.
- Shoulder Seasons: Implement dynamic pricing that balances peak and low rates. Target weekend travelers or specific events. Offer slightly more flexible terms than peak season.
- Regularly analyze your own performance against these Lucas seasonality benchmarks and adjust your pricing and availability strategy accordingly.
Best Areas for Airbnb Investment in Lucas (2025)
Exploring the top neighborhoods for short-term rentals in Lucas? This section highlights key areas, outlining why they are attractive for hosts and guests, along with notable local attractions. Consider these locations based on your target guest profile and investment strategy.
| Neighborhood / Area | Why Host Here? (Target Guests & Appeal) | Key Attractions & Landmarks |
|---|---|---|
| Downtown Lucas | The heart of Lucas, known for its local artisan shops and vibrant community feel. An attractive spot for visitors wanting to experience the culture and charm of small-town Kansas. | Grassroots Arts Center, Lucas Plaza, The World's Largest Hand-Dug Well, Sculpture Tour, Local Cafe |
| Outdoor Attractions | Lucas is surrounded by beautiful natural landscapes and parks. Ideal for outdoor enthusiasts looking to explore nature and participate in recreational activities. | Wilson Lake, Post Rock Scenic Byway, Pioneer Park, Fishing and boating activities |
| Museum Row | This area features several local museums and cultural exhibits. A great place for families and history buffs wanting to learn more about Lucas and its historical significance. | The Grassroots Art Center, The Museum of the Kansas National Guard, Local art installations |
| Community Events Center | A central hub for community gatherings, concerts, and events that attract visitors year-round. A great place for guests to stay while enjoying local happenings. | Local fairs and festivals, Art and Craft Markets, Concerts and Live Performances |
| Sculpture Park | An outdoor park featuring numerous sculptures by local artists. Perfect for art lovers and those who enjoy a leisurely stroll while appreciating public art. | Public Artwork, Walking trails, Picnic areas |
| Historic Sites | Lucas is rich in history, with several historic sites that attract tourists interested in local heritage and architecture. Opportunity for guests interested in cultural tourism. | Old Post Office, Historic downtown buildings, Local historical markers |
| Agricultural Tours | The surrounding area features several farms and agricultural sites. Travelers can engage in farm tours and learn about rural life, appealing to families and educational trips. | Local Farm Tours, Pumpkin patches, Agricultural fairs |
| Culinary Experience | Lucas boasts several local eateries and unique dining options that reflect the culinary scene in Kansas. Attracts food lovers and those wanting to experience local flavors. | Local Diners, Bakeries, Authentic Kansas BBQ spots |
Understanding Airbnb License Requirements & STR Laws in Lucas (2025)
While Lucas, Kansas, United States currently shows low STR regulations, specific Airbnb license requirements might still exist or change. Always verify the latest short term rental regulations and Airbnb license requirements directly with local government authorities for Lucas to ensure full compliance before hosting.
(Source: AirROI data, 2025, finding no licensed listings among those analyzed)
Top Performing Airbnb Properties in Lucas (2025)
Benchmark your potential! Explore examples of top-performing Airbnb properties in Lucasbased on Trailing Twelve Month (TTM) revenue. Analyze their characteristics, revenue, occupancy rate, and ADR to understand what drives success in this market.

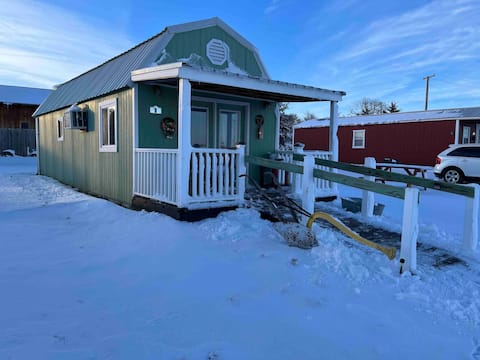
Country Blu Cabin @ Set in Stone Park
Entire Place • 1 bedroom

Garden View Lodge
Entire Place • 4 bedrooms
Simple Country Cabin @ Set in Stone
Entire Place • 1 bedroom
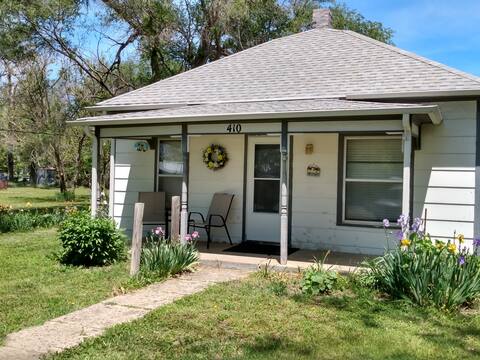
Cozy Cottage
Entire Place • 2 bedrooms

Fisherman Cabin @ Set in Stone Park
Entire Place • N/A

Quiet place on the edge of town pet friendly
Entire Place • 3 bedrooms
Note: Performance varies based on location, size, amenities, seasonality, and management quality. Data reflects the past 12 months.
Top Performing Airbnb Hosts in Lucas (2025)
Learn from the best! This table showcases top-performing Airbnb hosts in Lucas based on the number of properties managed and estimated total revenue over the past year. Analyze their scale and performance metrics.
| Host Name | Properties | Grossing Revenue | Stay Reviews | Avg Rating |
|---|---|---|---|---|
| Christina | 3 | $58,023 | 359 | 4.85/5.0 |
| Amanda | 2 | $19,204 | 559 | 4.63/5.0 |
| Mary Ann | 1 | $18,658 | 507 | 4.76/5.0 |
| Janice | 11 | $16,832 | 60 | 4.71/5.0 |
| Dennis Albert Jr | 1 | $10,406 | 152 | 4.85/5.0 |
| Steve | 1 | $4,048 | 11 | 4.55/5.0 |
Analyzing the strategies of top hosts, such as their property selection, pricing, and guest communication, can offer valuable lessons for optimizing your own Airbnb operations in Lucas.
Dive Deeper: Advanced Lucas STR Market Data (2025)
Ready to unlock more insights? AirROI provides access to advanced metrics and comprehensive Airbnb data for Lucas. Explore detailed analytics beyond this report to refine your investment strategy, optimize pricing, and maximize your vacation rental profits.
Explore Advanced MetricsLucas Short-Term Rental Market Composition (2025): Property & Room Types
Room Type Distribution
Property Type Distribution
Market Composition Insights for Lucas
- The Lucas Airbnb market composition is heavily skewed towards Private Room listings, which make up 57.9% of the 19 active rentals. This indicates strong guest preference for privacy and space.
- Looking at the property type distribution in Lucas, Hotel/Boutique properties are the most common (57.9%), reflecting the local real estate landscape.
- Houses represent a significant 21.1% portion, catering likely to families or larger groups.
- The presence of 57.9% Hotel/Boutique listings indicates integration with traditional hospitality.
Lucas Airbnb Room Capacity Analysis (2025): Bedroom Distribution
Distribution of Listings by Number of Bedrooms
Room Capacity Insights for Lucas
- The dominant room capacity in Lucas is 1 bedroom listings, making up 68.4% of the market. This suggests a strong demand for properties suitable for couples or solo travelers.
- Together, 1 bedroom and 2 bedrooms properties represent 84.2% of the active Airbnb listings in Lucas, indicating a high concentration in these sizes.
- With over half the market (68.4%) consisting of studios or 1-bedroom units, Lucas is particularly well-suited for individuals or couples.
Lucas Vacation Rental Guest Capacity Trends (2025)
Distribution of Listings by Guest Capacity
Guest Capacity Insights for Lucas
- The most common guest capacity trend in Lucas vacation rentals is listings accommodating 6 guests (26.3%). This suggests the primary traveler segment is likely larger groups.
- Properties designed for 6 guests and 4 guests dominate the Lucas STR market, accounting for 47.4% of listings.
- 42.1% of properties accommodate 6+ guests, serving the market segment for larger families or group travel in Lucas.
- On average, properties in Lucas are equipped to host 4.7 guests.
Lucas Airbnb Booking Patterns (2025): Available vs. Booked Days
Available Days Distribution
Booked Days Distribution
Booking Pattern Insights for Lucas
- The most common availability pattern in Lucas falls within the 271-366 days range, representing 73.7% of listings. This suggests many properties have significant open periods on their calendars.
- Approximately 84.2% of listings show high availability (181+ days open annually), indicating potential for increased bookings or specific owner usage patterns.
- For booked days, the 1-30 days range is most frequent in Lucas (57.9%), reflecting common guest stay durations or potential owner blocking patterns.
- A notable 15.8% of properties secure long booking periods (181+ days booked per year), highlighting successful long-term rental strategies or significant owner usage.
Lucas Airbnb Minimum Stay Requirements Analysis
Distribution of Listings by Minimum Night Requirement
1 Night
18 listings
94.7% of total
2 Nights
1 listings
5.3% of total
Key Insights
- The most prevalent minimum stay requirement in Lucas is 1 Night, adopted by 94.7% of listings. This highlights the market's preference for shorter, flexible bookings.
- A strong majority (100.0%) of the Lucas Airbnb data shows acceptance of very short stays (1-2 nights), indicating a dynamic, high-turnover market.
Recommendations
- Align with the market by considering a 1 Night minimum stay, as 94.7% of Lucas hosts use this setting.
- Adjust minimum nights based on seasonality – potentially shorter during low season and longer during peak demand periods in Lucas.
Lucas Airbnb Cancellation Policy Trends Analysis (2025)
Flexible
13 listings
68.4% of total
Moderate
2 listings
10.5% of total
Firm
4 listings
21.1% of total
Cancellation Policy Insights for Lucas
- The prevailing Airbnb cancellation policy trend in Lucas is Flexible, used by 68.4% of listings.
- The market strongly favors guest-friendly terms, with 78.9% of listings offering Flexible or Moderate policies. This suggests guests in Lucas may expect booking flexibility.
Recommendations for Hosts
- Consider adopting a Flexible policy to align with the 68.4% market standard in Lucas.
- Given the high prevalence of Flexible policies (68.4%), offering this can enhance booking appeal, especially during shoulder seasons.
- Regularly review your cancellation policy against competitors and market demand shifts in Lucas.
Lucas STR Booking Lead Time Analysis (2025)
Average Booking Lead Time by Month
Booking Lead Time Insights for Lucas
- The overall average booking lead time for vacation rentals in Lucas is 56 days.
- Guests book furthest in advance for stays during June (average 124 days), likely coinciding with peak travel demand or local events.
- The shortest booking windows occur for stays in February (average 3 days), indicating more last-minute travel plans during this time.
- Seasonally, Summer (59 days avg.) sees the longest lead times, while Winter (34 days avg.) has the shortest, reflecting typical travel planning cycles.
Recommendations for Hosts
- Use the overall average lead time (56 days) as a baseline for your pricing and availability strategy in Lucas.
- For June stays, consider implementing length-of-stay discounts or slightly higher rates for bookings made less than 124 days out to capitalize on advance planning.
- During February, focus on last-minute booking availability and promotions, as guests book with very short notice (3 days avg.).
- Target marketing efforts for the Summer season well in advance (at least 59 days) to capture early planners.
- Monitor your own booking lead times against these Lucas averages to identify opportunities for dynamic pricing adjustments.
Popular & Essential Airbnb Amenities in Lucas (2025)
Amenity Prevalence
Amenity Insights for Lucas
- Essential amenities in Lucas that guests expect include: BBQ grill, Free parking on premises. Lacking these (any) could significantly impact bookings.
- Popular amenities like Wifi, Smoke alarm, Outdoor dining area are common but not universal. Offering these can provide a competitive edge.
- Warning: Wifi is not universally provided but is considered essential globally. Ensure reliable Wifi is offered.
Recommendations for Hosts
- Ensure your listing includes all essential amenities for Lucas: BBQ grill, Free parking on premises.
- Consider adding popular differentiators like Wifi or Smoke alarm to increase appeal.
- Highlight unique or less common amenities you offer (e.g., hot tub, dedicated workspace, EV charger) in your listing description and photos.
- Regularly check competitor amenities in Lucas to stay competitive.
Lucas Airbnb Guest Demographics & Profile Analysis (2025)
Guest Profile Summary for Lucas
- The typical guest profile for Airbnb in Lucas consists of primarily domestic travelers (99%), often arriving from nearby Wichita, typically belonging to the Post-2000s (Gen Z/Alpha) group (50%), primarily speaking English or Dutch.
- Domestic travelers account for 99.1% of guests.
- Key international markets include United States (99.1%) and Australia (0.9%).
- Top languages spoken are English (93%) followed by Dutch (2.3%).
- A significant demographic segment is the Post-2000s (Gen Z/Alpha) group, representing 50% of guests.
Recommendations for Hosts
- Target domestic marketing efforts towards travelers from Wichita and Kansas City.
- Tailor amenities and listing descriptions to appeal to the dominant Post-2000s (Gen Z/Alpha) demographic (e.g., highlight fast WiFi, smart home features, local guides).
- Highlight unique local experiences or amenities relevant to the primary guest profile.
- Consider seasonal promotions aligned with peak travel times for key origin markets.
Nearby Short-Term Rental Market Comparison
How does the Lucas Airbnb market stack up against its neighbors? Compare key performance metrics like average monthly revenue, ADR, and occupancy rates in surrounding areas to understand the broader regional STR landscape.
| Market | Active Properties | Monthly Revenue | Daily Rate | Avg. Occupancy |
|---|---|---|---|---|
| Johnson Lake | 11 | $3,105 | $264.27 | 52% |
| Lindsborg | 26 | $2,236 | $168.33 | 47% |
| Grand Island | 56 | $2,096 | $165.59 | 49% |
| Kearney | 59 | $2,047 | $182.95 | 47% |
| Clay Center | 10 | $2,003 | $233.66 | 35% |
| Republican City | 10 | $1,990 | $285.18 | 35% |
| Seward | 14 | $1,877 | $229.22 | 38% |
| Salina | 59 | $1,855 | $139.04 | 49% |
| Hastings | 24 | $1,836 | $174.17 | 43% |
| Great Bend | 21 | $1,812 | $165.59 | 47% |