Chalmette Airbnb Market Analysis 2026: Short Term Rental Data & Vacation Rental Statistics in Louisiana, United States
Is Airbnb profitable in Chalmette in 2026? Explore comprehensive Airbnb analytics for Chalmette, Louisiana, United States to uncover income potential. This 2026 STR market report for Chalmette, based on AirROI data from February 2025 to January 2026, reveals key trends in the niche market of 36 active listings.
Whether you're considering an Airbnb investment in Chalmette, optimizing your existing vacation rental, or exploring rental arbitrage opportunities, understanding the Chalmette Airbnb data is crucial. Leveraging the low regulation environment is key to maximizing your short term rental income potential. Let's dive into the specifics.
Key Chalmette Airbnb Performance Metrics Overview
Monthly Airbnb Revenue Variations & Income Potential in Chalmette (2026)
Understanding the monthly revenue variations for Airbnb listings in Chalmette is key to maximizing your short term rental income potential. Seasonality significantly impacts earnings. Our analysis, based on data from the past 12 months, shows that the peak revenue month for STRs in Chalmette is typically February, while August often presents the lowest earnings, highlighting opportunities for strategic pricing adjustments during shoulder and low seasons. Explore the typical Airbnb income in Chalmette across different performance tiers:
- Best-in-class properties (Top 10%) achieve $4,643+ monthly, often utilizing dynamic pricing and superior guest experiences.
- Strong performing properties (Top 25%) earn $2,993 or more, indicating effective management and desirable locations/amenities.
- Typical properties (Median) generate around $1,922 per month, representing the average market performance.
- Entry-level properties (Bottom 25%) see earnings around $1,036, often with potential for optimization.
Average Monthly Airbnb Earnings Trend in Chalmette
Chalmette Airbnb Occupancy Rate Trends (2026)
Maximize your bookings by understanding the Chalmette STR occupancy trends. Seasonal demand shifts significantly influence how often properties are booked. Typically, Februarysees the highest demand (peak season occupancy), while September experiences the lowest (low season). Effective strategies, like adjusting minimum stays or offering promotions, can boost occupancy during slower periods. Here's how different property tiers perform in Chalmette:
- Best-in-class properties (Top 10%) achieve 70%+ occupancy, indicating high desirability and potentially optimized availability.
- Strong performing properties (Top 25%) maintain 55% or higher occupancy, suggesting good market fit and guest satisfaction.
- Typical properties (Median) have an occupancy rate around 36%.
- Entry-level properties (Bottom 25%) average 18% occupancy, potentially facing higher vacancy.
Average Monthly Occupancy Rate Trend in Chalmette
Average Daily Rate (ADR) Airbnb Trends in Chalmette (2026)
Effective short term rental pricing strategy in Chalmette involves understanding monthly ADR fluctuations. The Average Daily Rate (ADR) for Airbnb in Chalmette typically peaks in February and dips lowest during November. Leveraging Airbnb dynamic pricing tools or strategies based on this seasonality can significantly boost revenue. Here's a look at the typical nightly rates achieved:
- Best-in-class properties (Top 10%) command rates of $632+ per night, often due to premium features or locations.
- Strong performing properties (Top 25%) achieve nightly rates of $285 or more.
- Typical properties (Median) charge around $162 per night.
- Entry-level properties (Bottom 25%) earn around $112 per night.
Average Daily Rate (ADR) Trend by Month in Chalmette
Get Live Chalmette Market Intelligence 👇

Explore Real-time Analytics
Airbnb Seasonality Analysis & Trends in Chalmette (2026)
Peak Season (February, March, October)
- Revenue averages $3,350 per month
- Occupancy rates average 47.5%
- Daily rates average $274
Shoulder Season
- Revenue averages $2,286 per month
- Occupancy maintains around 37.0%
- Daily rates hold near $259
Low Season (July, August, September)
- Revenue drops to average $1,720 per month
- Occupancy decreases to average 29.7%
- Daily rates adjust to average $258
Seasonality Insights for Chalmette
- The Airbnb seasonality in Chalmette shows highly seasonal trends requiring careful strategy. While the sections above show seasonal averages, it's also insightful to look at the extremes:
- During the high season, the absolute peak month showcases Chalmette's highest earning potential, with monthly revenues capable of climbing to $4,053, occupancy reaching a high of 51.4%, and ADRs peaking at $292.
- Conversely, the slowest single month of the year, typically falling within the low season, marks the market's lowest point. In this month, revenue might dip to $1,640, occupancy could drop to 27.3%, and ADRs may adjust down to $243.
- Understanding both the seasonal averages and these monthly peaks and troughs in revenue, occupancy, and ADR is crucial for maximizing your Airbnb profit potential in Chalmette.
Seasonal Strategies for Maximizing Profit
- Peak Season: Maximize revenue through premium pricing and potentially longer minimum stays. Ensure high availability.
- Low Season: Offer competitive pricing, special promotions (e.g., extended stay discounts), and flexible cancellation policies. Target off-season travelers like remote workers or budget-conscious guests.
- Shoulder Seasons: Implement dynamic pricing that balances peak and low rates. Target weekend travelers or specific events. Offer slightly more flexible terms than peak season.
- Regularly analyze your own performance against these Chalmette seasonality benchmarks and adjust your pricing and availability strategy accordingly.
Best Areas for Airbnb Investment in Chalmette (2026)
Exploring the top neighborhoods for short-term rentals in Chalmette? This section highlights key areas, outlining why they are attractive for hosts and guests, along with notable local attractions. Consider these locations based on your target guest profile and investment strategy.
| Neighborhood / Area | Why Host Here? (Target Guests & Appeal) | Key Attractions & Landmarks |
|---|---|---|
| Chalmette Historic District | Rich in history and culture, this area offers visitors a glimpse into the past with well-preserved homes and landmarks. It's a perfect spot for tourists interested in history and local culture. | Battle of New Orleans Site, Chalmette Battlefield, St. Bernard Parish Library, Chalmette National Cemetery, Historic St. Bernard Parish Courthouse |
| Lakewood Estates | A quiet suburban neighborhood that appeals to families and those looking for a peaceful stay while still being close to New Orleans attractions. Ideal for weekend getaways and longer stays. | Lakewood Estates Park, Lake Pontchartrain, Local eateries, Wildlife viewing areas |
| Cypress Gardens | A charming residential district surrounded by nature and friendly community vibes. Great for those looking to escape the hustle and bustle of city life while still being near New Orleans. | Cypress Park, Kayaking spots, Local shops, Community events |
| The Village | A growing commercial area with shopping and dining options. This area is popular among visitors looking for convenience and access to local amenities. | Chalmette Shopping Center, Restaurants and cafes, Fitness centers, Local markets |
| Meraux | A suburban area with a close-knit community, perfect for families and visitors who enjoy a neighborhood feel. Provides a good balance between proximity to New Orleans and peaceful living. | Meraux Park, Local dining spots, Family-friendly activities |
| St. Bernard Parish | Encompassing the wider region around Chalmette, this area offers a diverse array of attractions including parks, museums, and cultural sites. Great for those looking to explore beyond Chalmette. | St. Bernard Parish Museum, Bayou Bonfouca, Regional parks and wildlife areas |
| Chalmette Marina | Located near the water, this area is ideal for visitors interested in fishing and outdoor activities. A great spot for recreational opportunities and nature enthusiasts. | Chalmette Marina, Fishing spots, Boat rentals, Waterfront dining |
| Bywater District (nearby New Orleans) | While technically not in Chalmette, this vibrant neighborhood is very close and offers a hip atmosphere with art, music, and food. Perfect for visitors who want to experience the New Orleans culture and nightlife. | Bywater Art District, Local breweries, Unique dining options, Music venues |
Understanding Airbnb License Requirements & STR Laws in Chalmette (2026)
While Chalmette, Louisiana, United States currently shows low STR regulations, specific Airbnb license requirements might still exist or change. Always verify the latest short term rental regulations and Airbnb license requirements directly with local government authorities for Chalmette to ensure full compliance before hosting.
(Source: AirROI data, 2026, finding no licensed listings among those analyzed)
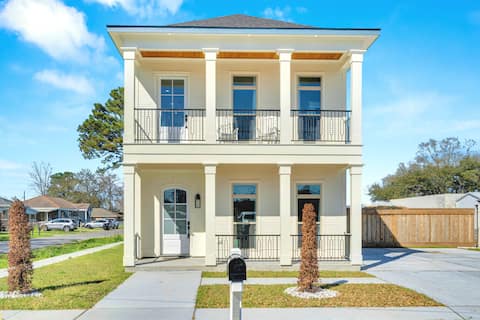
Top Performing Airbnb Properties in Chalmette (2026)
Benchmark your potential! Explore examples of top-performing Airbnb properties in Chalmettebased on Trailing Twelve Month (TTM) revenue. Analyze their characteristics, revenue, occupancy rate, and ADR to understand what drives success in this market.
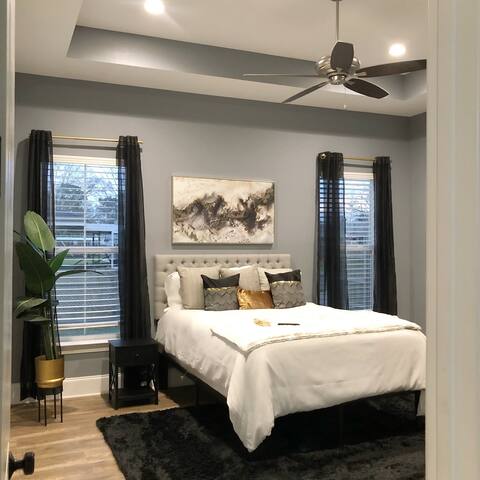
Madison Square Garden
Entire Place • 2 bedrooms
Outdoor Kitchen, 2 Living Rooms | New Construction
Entire Place • 4 bedrooms

Arcade + Pool Table + Roulette + Hidden Duplex
Entire Place • 2 bedrooms
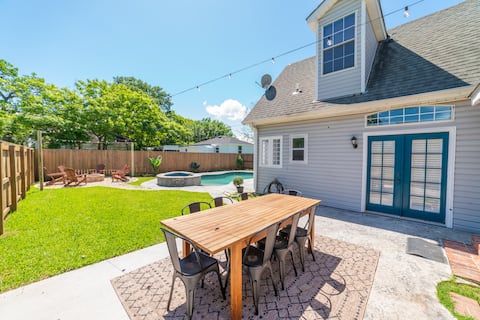
Gas Heated pool/Jacuzzi | bonfire| 2-Story cottage
Entire Place • 3 bedrooms

Peaceful Safe NOLA Charm under Oaks•Natural Light
Entire Place • 2 bedrooms

Cozy New Orleans Three Bedroom
Entire Place • 3 bedrooms
Note: Performance varies based on location, size, amenities, seasonality, and management quality. Data reflects the past 12 months.
Top Performing Airbnb Hosts in Chalmette (2026)
Learn from the best! This table showcases top-performing Airbnb hosts in Chalmette based on the number of properties managed and estimated total revenue over the past year. Analyze their scale and performance metrics.
| Host Name | Properties | Grossing Revenue | Stay Reviews | Avg Rating |
|---|---|---|---|---|
| Tenesha | 1 | $64,582 | 4 | 5.00/5.0 |
| David | 1 | $56,615 | 38 | 5.00/5.0 |
| Alaysha And Terence | 1 | $56,536 | 45 | 5.00/5.0 |
| Huynh | 1 | $54,757 | 53 | 4.77/5.0 |
| Larry | 2 | $47,234 | 2 | Not Rated |
| Desiree | 1 | $44,310 | 55 | 4.91/5.0 |
| Andre | 1 | $34,350 | 466 | 4.82/5.0 |
| Steven | 1 | $34,292 | 88 | 4.83/5.0 |
| Robin | 1 | $28,980 | 172 | 4.98/5.0 |
| Cleila | 1 | $27,819 | 96 | 4.85/5.0 |
Analyzing the strategies of top hosts, such as their property selection, pricing, and guest communication, can offer valuable lessons for optimizing your own Airbnb operations in Chalmette.
Dive Deeper: Advanced Chalmette STR Market Data (2026)
Ready to unlock more insights? AirROI provides access to advanced metrics and comprehensive Airbnb data for Chalmette. Explore detailed analytics beyond this report to refine your investment strategy, optimize pricing, and maximize your vacation rental profits.
Explore Advanced MetricsChalmette Short-Term Rental Market Composition (2026): Property & Room Types
Room Type Distribution
Property Type Distribution
Market Composition Insights for Chalmette
- The Chalmette Airbnb market composition is heavily skewed towards Entire Home/Apt listings, which make up 91.7% of the 36 active rentals. This indicates strong guest preference for privacy and space.
- Looking at the property type distribution in Chalmette, House properties are the most common (80.6%), reflecting the local real estate landscape.
- Houses represent a significant 80.6% portion, catering likely to families or larger groups.
- The presence of 5.6% Hotel/Boutique listings indicates integration with traditional hospitality.
Chalmette Airbnb Room Capacity Analysis (2026): Bedroom Distribution
Distribution of Listings by Number of Bedrooms
Room Capacity Insights for Chalmette
- The dominant room capacity in Chalmette is 2 bedrooms listings, making up 41.7% of the market. This suggests a strong demand for properties suitable for couples or solo travelers.
- Together, 2 bedrooms and 3 bedrooms properties represent 75.0% of the active Airbnb listings in Chalmette, indicating a high concentration in these sizes.
- A significant 38.9% of listings offer 3+ bedrooms, catering to larger groups and families seeking more space in Chalmette.
Chalmette Vacation Rental Guest Capacity Trends (2026)
Distribution of Listings by Guest Capacity
Guest Capacity Insights for Chalmette
- The most common guest capacity trend in Chalmette vacation rentals is listings accommodating 4 guests (30.6%). This suggests the primary traveler segment is likely small families or groups.
- Properties designed for 4 guests and 6 guests dominate the Chalmette STR market, accounting for 52.8% of listings.
- 47.2% of properties accommodate 6+ guests, serving the market segment for larger families or group travel in Chalmette.
- On average, properties in Chalmette are equipped to host 4.9 guests.
Chalmette Airbnb Booking Patterns (2026): Available vs. Booked Days
Available Days Distribution
Booked Days Distribution
Booking Pattern Insights for Chalmette
- The most common availability pattern in Chalmette falls within the 271-366 days range, representing 50% of listings. This suggests many properties have significant open periods on their calendars.
- Approximately 86.1% of listings show high availability (181+ days open annually), indicating potential for increased bookings or specific owner usage patterns.
- For booked days, the 91-180 days range is most frequent in Chalmette (36.1%), reflecting common guest stay durations or potential owner blocking patterns.
- A notable 13.9% of properties secure long booking periods (181+ days booked per year), highlighting successful long-term rental strategies or significant owner usage.
Chalmette Airbnb Minimum Stay Requirements Analysis
Distribution of Listings by Minimum Night Requirement
1 Night
7 listings
19.4% of total
2 Nights
9 listings
25% of total
3 Nights
3 listings
8.3% of total
7-29 Nights
3 listings
8.3% of total
30+ Nights
14 listings
38.9% of total
Key Insights
- The most prevalent minimum stay requirement in Chalmette is 30+ Nights, adopted by 38.9% of listings. This highlights the market's preference for longer commitments.
- A significant segment (38.9%) caters to monthly stays (30+ nights) in Chalmette, pointing to opportunities in the extended-stay market.
Recommendations
- Align with the market by considering a 30+ Nights minimum stay, as 38.9% of Chalmette hosts use this setting.
- If feasible, allowing 1-night stays, especially midweek or during low season, could capture last-minute bookings, as only 19.4% currently do.
- Explore offering discounts for stays of 30+ nights to attract the 38.9% of the market seeking extended stays.
- Adjust minimum nights based on seasonality – potentially shorter during low season and longer during peak demand periods in Chalmette.
Chalmette Airbnb Cancellation Policy Trends Analysis (2026)
Limited
2 listings
5.6% of total
Flexible
10 listings
27.8% of total
Moderate
5 listings
13.9% of total
Firm
14 listings
38.9% of total
Strict
5 listings
13.9% of total
Cancellation Policy Insights for Chalmette
- The prevailing Airbnb cancellation policy trend in Chalmette is Firm, used by 38.9% of listings.
- A majority (52.8%) of hosts in Chalmette utilize Firm or Strict policies, indicating a market where hosts prioritize booking security.
Recommendations for Hosts
- Consider adopting a Firm policy to align with the 38.9% market standard in Chalmette.
- Using a Strict policy might deter some guests, as only 13.9% of listings use it. Evaluate if potential revenue protection outweighs possible lower booking rates.
- Regularly review your cancellation policy against competitors and market demand shifts in Chalmette.
Chalmette STR Booking Lead Time Analysis (2026)
Average Booking Lead Time by Month
Booking Lead Time Insights for Chalmette
- The overall average booking lead time for vacation rentals in Chalmette is 34 days.
- Guests book furthest in advance for stays during February (average 77 days), likely coinciding with peak travel demand or local events.
- The shortest booking windows occur for stays in September (average 13 days), indicating more last-minute travel plans during this time.
- Seasonally, Spring (50 days avg.) sees the longest lead times, while Summer (27 days avg.) has the shortest, reflecting typical travel planning cycles.
Recommendations for Hosts
- Use the overall average lead time (34 days) as a baseline for your pricing and availability strategy in Chalmette.
- For February stays, consider implementing length-of-stay discounts or slightly higher rates for bookings made less than 77 days out to capitalize on advance planning.
- During September, focus on last-minute booking availability and promotions, as guests book with very short notice (13 days avg.).
- Target marketing efforts for the Spring season well in advance (at least 50 days) to capture early planners.
- Monitor your own booking lead times against these Chalmette averages to identify opportunities for dynamic pricing adjustments.
Popular & Essential Airbnb Amenities in Chalmette (2026)
Amenity Prevalence
Amenity Insights for Chalmette
- Essential amenities in Chalmette that guests expect include: Air conditioning, Wifi, Free parking on premises, TV. Lacking these (any) could significantly impact bookings.
- Popular amenities like Kitchen, Smoke alarm, Heating are common but not universal. Offering these can provide a competitive edge.
Recommendations for Hosts
- Ensure your listing includes all essential amenities for Chalmette: Air conditioning, Wifi, Free parking on premises, TV.
- Prioritize adding missing essentials: Free parking on premises, TV.
- Consider adding popular differentiators like Kitchen or Smoke alarm to increase appeal.
- Highlight unique or less common amenities you offer (e.g., hot tub, dedicated workspace, EV charger) in your listing description and photos.
- Regularly check competitor amenities in Chalmette to stay competitive.
Chalmette Airbnb Guest Demographics & Profile Analysis (2026)
Guest Profile Summary for Chalmette
- The typical guest profile for Airbnb in Chalmette consists of primarily domestic travelers (96%), often arriving from nearby Houston, typically belonging to the Post-2000s (Gen Z/Alpha) group (50%), primarily speaking English or Spanish.
- Domestic travelers account for 95.8% of guests.
- Key international markets include United States (95.8%) and China (0.8%).
- Top languages spoken are English (73.3%) followed by Spanish (17%).
- A significant demographic segment is the Post-2000s (Gen Z/Alpha) group, representing 50% of guests.
Recommendations for Hosts
- Target domestic marketing efforts towards travelers from Houston and Dallas.
- Tailor amenities and listing descriptions to appeal to the dominant Post-2000s (Gen Z/Alpha) demographic (e.g., highlight fast WiFi, smart home features, local guides).
- Highlight unique local experiences or amenities relevant to the primary guest profile.
- Consider seasonal promotions aligned with peak travel times for key origin markets.
Nearby Short-Term Rental Market Comparison
How does the Chalmette Airbnb market stack up against its neighbors? Compare key performance metrics like average monthly revenue, ADR, and occupancy rates in surrounding areas to understand the broader regional STR landscape.
| Market | Active Properties | Monthly Revenue | Daily Rate | Avg. Occupancy |
|---|---|---|---|---|
| Plaquemines Parish | 28 | $4,733 | $413.26 | 40% |
| Dauphin Island | 612 | $3,407 | $376.02 | 38% |
| New Orleans | 4,857 | $3,260 | $298.03 | 42% |
| Grand Isle | 106 | $3,149 | $432.40 | 32% |
| Killian | 14 | $3,089 | $360.39 | 37% |
| Pass Christian | 179 | $2,762 | $294.40 | 36% |
| Ocean Springs | 259 | $2,518 | $217.19 | 42% |
| Ponchatoula | 49 | $2,512 | $231.70 | 39% |
| Bay Saint Louis | 286 | $2,488 | $265.09 | 35% |
| Covington | 65 | $2,427 | $204.72 | 47% |