Bucksport Airbnb Market Analysis 2026: Short Term Rental Data & Vacation Rental Statistics in Maine, United States
Is Airbnb profitable in Bucksport in 2026? Explore comprehensive Airbnb analytics for Bucksport, Maine, United States to uncover income potential. This 2026 STR market report for Bucksport, based on AirROI data from February 2025 to January 2026, reveals key trends in the niche market of 43 active listings.
Whether you're considering an Airbnb investment in Bucksport, optimizing your existing vacation rental, or exploring rental arbitrage opportunities, understanding the Bucksport Airbnb data is crucial. Leveraging the low regulation environment is key to maximizing your short term rental income potential. Let's dive into the specifics.
Key Bucksport Airbnb Performance Metrics Overview
Monthly Airbnb Revenue Variations & Income Potential in Bucksport (2026)
Understanding the monthly revenue variations for Airbnb listings in Bucksport is key to maximizing your short term rental income potential. Seasonality significantly impacts earnings. Our analysis, based on data from the past 12 months, shows that the peak revenue month for STRs in Bucksport is typically August, while January often presents the lowest earnings, highlighting opportunities for strategic pricing adjustments during shoulder and low seasons. Explore the typical Airbnb income in Bucksport across different performance tiers:
- Best-in-class properties (Top 10%) achieve $7,862+ monthly, often utilizing dynamic pricing and superior guest experiences.
- Strong performing properties (Top 25%) earn $5,128 or more, indicating effective management and desirable locations/amenities.
- Typical properties (Median) generate around $3,009 per month, representing the average market performance.
- Entry-level properties (Bottom 25%) see earnings around $1,495, often with potential for optimization.
Average Monthly Airbnb Earnings Trend in Bucksport
Bucksport Airbnb Occupancy Rate Trends (2026)
Maximize your bookings by understanding the Bucksport STR occupancy trends. Seasonal demand shifts significantly influence how often properties are booked. Typically, Augustsees the highest demand (peak season occupancy), while January experiences the lowest (low season). Effective strategies, like adjusting minimum stays or offering promotions, can boost occupancy during slower periods. Here's how different property tiers perform in Bucksport:
- Best-in-class properties (Top 10%) achieve 84%+ occupancy, indicating high desirability and potentially optimized availability.
- Strong performing properties (Top 25%) maintain 70% or higher occupancy, suggesting good market fit and guest satisfaction.
- Typical properties (Median) have an occupancy rate around 46%.
- Entry-level properties (Bottom 25%) average 25% occupancy, potentially facing higher vacancy.
Average Monthly Occupancy Rate Trend in Bucksport
Average Daily Rate (ADR) Airbnb Trends in Bucksport (2026)
Effective short term rental pricing strategy in Bucksport involves understanding monthly ADR fluctuations. The Average Daily Rate (ADR) for Airbnb in Bucksport typically peaks in September and dips lowest during February. Leveraging Airbnb dynamic pricing tools or strategies based on this seasonality can significantly boost revenue. Here's a look at the typical nightly rates achieved:
- Best-in-class properties (Top 10%) command rates of $662+ per night, often due to premium features or locations.
- Strong performing properties (Top 25%) achieve nightly rates of $322 or more.
- Typical properties (Median) charge around $208 per night.
- Entry-level properties (Bottom 25%) earn around $134 per night.
Average Daily Rate (ADR) Trend by Month in Bucksport
Get Live Bucksport Market Intelligence 👇

Explore Real-time Analytics
Airbnb Seasonality Analysis & Trends in Bucksport (2026)
Peak Season (August, July, September)
- Revenue averages $6,184 per month
- Occupancy rates average 62.2%
- Daily rates average $344
Shoulder Season
- Revenue averages $3,377 per month
- Occupancy maintains around 46.4%
- Daily rates hold near $315
Low Season (January, February, March)
- Revenue drops to average $2,170 per month
- Occupancy decreases to average 38.8%
- Daily rates adjust to average $297
Seasonality Insights for Bucksport
- The Airbnb seasonality in Bucksport shows highly seasonal trends requiring careful strategy. While the sections above show seasonal averages, it's also insightful to look at the extremes:
- During the high season, the absolute peak month showcases Bucksport's highest earning potential, with monthly revenues capable of climbing to $7,308, occupancy reaching a high of 69.5%, and ADRs peaking at $375.
- Conversely, the slowest single month of the year, typically falling within the low season, marks the market's lowest point. In this month, revenue might dip to $1,718, occupancy could drop to 29.3%, and ADRs may adjust down to $252.
- Understanding both the seasonal averages and these monthly peaks and troughs in revenue, occupancy, and ADR is crucial for maximizing your Airbnb profit potential in Bucksport.
Seasonal Strategies for Maximizing Profit
- Peak Season: Maximize revenue through premium pricing and potentially longer minimum stays. Ensure high availability.
- Low Season: Offer competitive pricing, special promotions (e.g., extended stay discounts), and flexible cancellation policies. Target off-season travelers like remote workers or budget-conscious guests.
- Shoulder Seasons: Implement dynamic pricing that balances peak and low rates. Target weekend travelers or specific events. Offer slightly more flexible terms than peak season.
- Regularly analyze your own performance against these Bucksport seasonality benchmarks and adjust your pricing and availability strategy accordingly.
Best Areas for Airbnb Investment in Bucksport (2026)
Exploring the top neighborhoods for short-term rentals in Bucksport? This section highlights key areas, outlining why they are attractive for hosts and guests, along with notable local attractions. Consider these locations based on your target guest profile and investment strategy.
| Neighborhood / Area | Why Host Here? (Target Guests & Appeal) | Key Attractions & Landmarks |
|---|---|---|
| Riverfront Park | Scenic area along the Penobscot River with beautiful views and recreational activities. Ideal for guests looking to enjoy nature, walking trails, and a peaceful environment. | Riverfront Park Trail, Penobscot River, Bucksport Historical Society, Bucksport Marina, Jonathan Buck Cemetery |
| Main Street | The downtown area of Bucksport featuring local shops, cafes, and restaurants. Perfect for visitors who want to experience the small-town charm and community vibe. | Bucksport Village, local boutiques, Maine Coast Impressions, Bucksport Theatre, Bucksport Waterfront |
| Fort Knox | Historic fort offering tours and panoramic views of the Penobscot Narrows Bridge. Great for history enthusiasts and families looking for educational activities. | Fort Knox State Historic Site, Penobscot Narrows Observatory, Fort Knox Visitor Center |
| Castine | Nearby coastal town known for its historic architecture and maritime heritage. Appeals to those looking for a charming seaside getaway. | Castine Historical Society, Wharves and Marina, Dyce Head Lighthouse, Castine Golf Club |
| Orland | Rural area nearby that offers a more laid-back experience. Perfect for families and individuals looking to connect with nature through hikes and outdoor activities. | Dora the Explorer trail, Tunk Mountain, Maine Coast Heritage Trust Trails |
| Acadia National Park (nearby) | While not in Bucksport, the proximity to Acadia National Park draws tourists who want to explore this beautiful national park with breathtaking landscapes and outdoor activities. | Cadillac Mountain, Jordan Pond, Park Loop Road, Bar Harbor |
| Swan Lake | Peaceful area offering a relaxing getaway with opportunities for fishing and boating. Ideal for couples and nature lovers. | Swan Lake State Park, fishing spots, hiking trails |
| Blue Hill | A quaint, artistically inclined coastal town nearby Bucksport, offering unique shops and cultural experiences. Attracts tourists interested in art and community events. | Blue Hill Heritage Trust, Blue Hill Mountain, local art galleries, farmers markets |
Understanding Airbnb License Requirements & STR Laws in Bucksport (2026)
While Bucksport, Maine, United States currently shows low STR regulations, specific Airbnb license requirements might still exist or change. Always verify the latest short term rental regulations and Airbnb license requirements directly with local government authorities for Bucksport to ensure full compliance before hosting.
(Source: AirROI data, 2026, finding no licensed listings among those analyzed)
Top Performing Airbnb Properties in Bucksport (2026)
Benchmark your potential! Explore examples of top-performing Airbnb properties in Bucksportbased on Trailing Twelve Month (TTM) revenue. Analyze their characteristics, revenue, occupancy rate, and ADR to understand what drives success in this market.

Lake Front-Maine Themed-Soaking Tub-Fire Pit-Kayak
Entire Place • 4 bedrooms

Bucksport gem, w/hot tub! One hour to Acadia NP!
Entire Place • 4 bedrooms

Lake Front-Spa Tub-Fire Pit-Full Kitchen-Canoe
Entire Place • 2 bedrooms
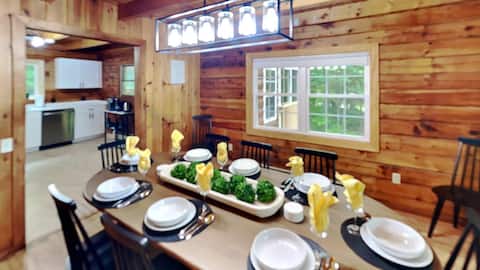
Luxe Log Cabin. Waterview & Private.
Entire Place • 4 bedrooms

Large Home Amazing Mountain Sunrise Views
Entire Place • 6 bedrooms
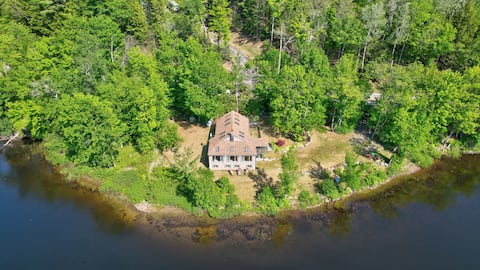
180 Degree Lakefront Views-Fire Pit-Swimming
Entire Place • 2 bedrooms
Note: Performance varies based on location, size, amenities, seasonality, and management quality. Data reflects the past 12 months.
Top Performing Airbnb Hosts in Bucksport (2026)
Learn from the best! This table showcases top-performing Airbnb hosts in Bucksport based on the number of properties managed and estimated total revenue over the past year. Analyze their scale and performance metrics.
| Host Name | Properties | Grossing Revenue | Stay Reviews | Avg Rating |
|---|---|---|---|---|
| Eddie | 4 | $307,909 | 649 | 4.92/5.0 |
| Wallace | 4 | $147,883 | 45 | 4.77/5.0 |
| Evolve | 3 | $100,262 | 54 | 4.68/5.0 |
| Stephanie | 2 | $93,718 | 208 | 4.96/5.0 |
| Nikki | 1 | $93,079 | 60 | 5.00/5.0 |
| Alex Pelling | 3 | $76,932 | 80 | 4.98/5.0 |
| Coastal Maine Vacations | 1 | $65,155 | 9 | 4.78/5.0 |
| Ron | 3 | $61,978 | 366 | 4.97/5.0 |
| Chausey | 1 | $50,773 | 119 | 4.89/5.0 |
| Chris | 1 | $46,332 | 47 | 5.00/5.0 |
Analyzing the strategies of top hosts, such as their property selection, pricing, and guest communication, can offer valuable lessons for optimizing your own Airbnb operations in Bucksport.
Dive Deeper: Advanced Bucksport STR Market Data (2026)
Ready to unlock more insights? AirROI provides access to advanced metrics and comprehensive Airbnb data for Bucksport. Explore detailed analytics beyond this report to refine your investment strategy, optimize pricing, and maximize your vacation rental profits.
Explore Advanced MetricsBucksport Short-Term Rental Market Composition (2026): Property & Room Types
Room Type Distribution
Property Type Distribution
Market Composition Insights for Bucksport
- The Bucksport Airbnb market composition is heavily skewed towards Entire Home/Apt listings, which make up 86% of the 43 active rentals. This indicates strong guest preference for privacy and space.
- Looking at the property type distribution in Bucksport, House properties are the most common (51.2%), reflecting the local real estate landscape.
- Houses represent a significant 51.2% portion, catering likely to families or larger groups.
- Smaller segments like hotel/boutique (combined 2.3%) offer potential for unique stay experiences.
Bucksport Airbnb Room Capacity Analysis (2026): Bedroom Distribution
Distribution of Listings by Number of Bedrooms
Room Capacity Insights for Bucksport
- The dominant room capacity in Bucksport is 2 bedrooms listings, making up 32.6% of the market. This suggests a strong demand for properties suitable for couples or solo travelers.
- Together, 2 bedrooms and 1 bedroom properties represent 58.2% of the active Airbnb listings in Bucksport, indicating a high concentration in these sizes.
- A significant 30.3% of listings offer 3+ bedrooms, catering to larger groups and families seeking more space in Bucksport.
Bucksport Vacation Rental Guest Capacity Trends (2026)
Distribution of Listings by Guest Capacity
Guest Capacity Insights for Bucksport
- The most common guest capacity trend in Bucksport vacation rentals is listings accommodating 4 guests (27.9%). This suggests the primary traveler segment is likely small families or groups.
- Properties designed for 4 guests and 2 guests dominate the Bucksport STR market, accounting for 48.8% of listings.
- 39.5% of properties accommodate 6+ guests, serving the market segment for larger families or group travel in Bucksport.
- On average, properties in Bucksport are equipped to host 4.3 guests.
Bucksport Airbnb Booking Patterns (2026): Available vs. Booked Days
Available Days Distribution
Booked Days Distribution
Booking Pattern Insights for Bucksport
- The most common availability pattern in Bucksport falls within the 271-366 days range, representing 48.8% of listings. This suggests many properties have significant open periods on their calendars.
- Approximately 79.0% of listings show high availability (181+ days open annually), indicating potential for increased bookings or specific owner usage patterns.
- For booked days, the 31-90 days range is most frequent in Bucksport (34.9%), reflecting common guest stay durations or potential owner blocking patterns.
- A notable 20.9% of properties secure long booking periods (181+ days booked per year), highlighting successful long-term rental strategies or significant owner usage.
Bucksport Airbnb Minimum Stay Requirements Analysis
Distribution of Listings by Minimum Night Requirement
1 Night
9 listings
20.9% of total
2 Nights
9 listings
20.9% of total
3 Nights
3 listings
7% of total
4-6 Nights
5 listings
11.6% of total
30+ Nights
17 listings
39.5% of total
Key Insights
- The most prevalent minimum stay requirement in Bucksport is 30+ Nights, adopted by 39.5% of listings. This highlights the market's preference for longer commitments.
- A significant segment (39.5%) caters to monthly stays (30+ nights) in Bucksport, pointing to opportunities in the extended-stay market.
Recommendations
- Align with the market by considering a 30+ Nights minimum stay, as 39.5% of Bucksport hosts use this setting.
- If feasible, allowing 1-night stays, especially midweek or during low season, could capture last-minute bookings, as only 20.9% currently do.
- Explore offering discounts for stays of 30+ nights to attract the 39.5% of the market seeking extended stays.
- Adjust minimum nights based on seasonality – potentially shorter during low season and longer during peak demand periods in Bucksport.
Bucksport Airbnb Cancellation Policy Trends Analysis (2026)
Super Strict 30 Days
6 listings
14% of total
Flexible
4 listings
9.3% of total
Moderate
9 listings
20.9% of total
Firm
19 listings
44.2% of total
Strict
5 listings
11.6% of total
Cancellation Policy Insights for Bucksport
- The prevailing Airbnb cancellation policy trend in Bucksport is Firm, used by 44.2% of listings.
- A majority (55.8%) of hosts in Bucksport utilize Firm or Strict policies, indicating a market where hosts prioritize booking security.
Recommendations for Hosts
- Consider adopting a Firm policy to align with the 44.2% market standard in Bucksport.
- Using a Strict policy might deter some guests, as only 11.6% of listings use it. Evaluate if potential revenue protection outweighs possible lower booking rates.
- Regularly review your cancellation policy against competitors and market demand shifts in Bucksport.
Bucksport STR Booking Lead Time Analysis (2026)
Average Booking Lead Time by Month
Booking Lead Time Insights for Bucksport
- The overall average booking lead time for vacation rentals in Bucksport is 49 days.
- Guests book furthest in advance for stays during April (average 77 days), likely coinciding with peak travel demand or local events.
- The shortest booking windows occur for stays in January (average 21 days), indicating more last-minute travel plans during this time.
- Seasonally, Spring (62 days avg.) sees the longest lead times, while Winter (30 days avg.) has the shortest, reflecting typical travel planning cycles.
Recommendations for Hosts
- Use the overall average lead time (49 days) as a baseline for your pricing and availability strategy in Bucksport.
- For April stays, consider implementing length-of-stay discounts or slightly higher rates for bookings made less than 77 days out to capitalize on advance planning.
- Target marketing efforts for the Spring season well in advance (at least 62 days) to capture early planners.
- Monitor your own booking lead times against these Bucksport averages to identify opportunities for dynamic pricing adjustments.
Popular & Essential Airbnb Amenities in Bucksport (2026)
Amenity Prevalence
Amenity Insights for Bucksport
- Essential amenities in Bucksport that guests expect include: Carbon monoxide alarm, Heating, Free parking on premises, Smoke alarm, Dishes and silverware, Wifi. Lacking these (any) could significantly impact bookings.
- Popular amenities like Hot water, Fire extinguisher, Coffee maker are common but not universal. Offering these can provide a competitive edge.
Recommendations for Hosts
- Ensure your listing includes all essential amenities for Bucksport: Carbon monoxide alarm, Heating, Free parking on premises, Smoke alarm, Dishes and silverware, Wifi.
- Prioritize adding missing essentials: Dishes and silverware, Wifi.
- Consider adding popular differentiators like Hot water or Fire extinguisher to increase appeal.
- Highlight unique or less common amenities you offer (e.g., hot tub, dedicated workspace, EV charger) in your listing description and photos.
- Regularly check competitor amenities in Bucksport to stay competitive.
Bucksport Airbnb Guest Demographics & Profile Analysis (2026)
Guest Profile Summary for Bucksport
- The typical guest profile for Airbnb in Bucksport consists of primarily domestic travelers (92%), often arriving from nearby New York, typically belonging to the Post-2000s (Gen Z/Alpha) group (50%), primarily speaking English or Spanish.
- Domestic travelers account for 92.1% of guests.
- Key international markets include United States (92.1%) and Canada (1.9%).
- Top languages spoken are English (70.1%) followed by Spanish (8.7%).
- A significant demographic segment is the Post-2000s (Gen Z/Alpha) group, representing 50% of guests.
Recommendations for Hosts
- Target domestic marketing efforts towards travelers from New York and Boston.
- Tailor amenities and listing descriptions to appeal to the dominant Post-2000s (Gen Z/Alpha) demographic (e.g., highlight fast WiFi, smart home features, local guides).
- Highlight unique local experiences or amenities relevant to the primary guest profile.
- Consider seasonal promotions aligned with peak travel times for key origin markets.
Nearby Short-Term Rental Market Comparison
How does the Bucksport Airbnb market stack up against its neighbors? Compare key performance metrics like average monthly revenue, ADR, and occupancy rates in surrounding areas to understand the broader regional STR landscape.
| Market | Active Properties | Monthly Revenue | Daily Rate | Avg. Occupancy |
|---|---|---|---|---|
| Bar Harbor | 510 | $5,047 | $413.86 | 58% |
| Mount Desert | 198 | $4,605 | $435.23 | 52% |
| Trenton | 141 | $4,555 | $388.61 | 57% |
| Tremont | 158 | $4,450 | $380.52 | 55% |
| Manchester | 12 | $4,389 | $406.26 | 46% |
| Southwest Harbor | 260 | $4,311 | $406.14 | 54% |
| Lamoine | 97 | $3,923 | $327.88 | 55% |
| Georgetown | 45 | $3,816 | $379.01 | 50% |
| Otis | 38 | $3,656 | $334.83 | 51% |
| Gouldsboro | 127 | $3,459 | $365.85 | 48% |