New Gloucester Airbnb Market Analysis 2026: Short Term Rental Data & Vacation Rental Statistics in Maine, United States
Is Airbnb profitable in New Gloucester in 2026? Explore comprehensive Airbnb analytics for New Gloucester, Maine, United States to uncover income potential. This 2026 STR market report for New Gloucester, based on AirROI data from November 2024 to October 2025, reveals key trends in the niche market of 18 active listings.
Whether you're considering an Airbnb investment in New Gloucester, optimizing your existing vacation rental, or exploring rental arbitrage opportunities, understanding the New Gloucester Airbnb data is crucial. Leveraging the low regulation environment is key to maximizing your short term rental income potential. Let's dive into the specifics.
Key New Gloucester Airbnb Performance Metrics Overview
Monthly Airbnb Revenue Variations & Income Potential in New Gloucester (2026)
Understanding the monthly revenue variations for Airbnb listings in New Gloucester is key to maximizing your short term rental income potential. Seasonality significantly impacts earnings. Our analysis, based on data from the past 12 months, shows that the peak revenue month for STRs in New Gloucester is typically July, while March often presents the lowest earnings, highlighting opportunities for strategic pricing adjustments during shoulder and low seasons. Explore the typical Airbnb income in New Gloucester across different performance tiers:
- Best-in-class properties (Top 10%) achieve $5,633+ monthly, often utilizing dynamic pricing and superior guest experiences.
- Strong performing properties (Top 25%) earn $3,871 or more, indicating effective management and desirable locations/amenities.
- Typical properties (Median) generate around $2,461 per month, representing the average market performance.
- Entry-level properties (Bottom 25%) see earnings around $1,488, often with potential for optimization.
Average Monthly Airbnb Earnings Trend in New Gloucester
New Gloucester Airbnb Occupancy Rate Trends (2026)
Maximize your bookings by understanding the New Gloucester STR occupancy trends. Seasonal demand shifts significantly influence how often properties are booked. Typically, Augustsees the highest demand (peak season occupancy), while December experiences the lowest (low season). Effective strategies, like adjusting minimum stays or offering promotions, can boost occupancy during slower periods. Here's how different property tiers perform in New Gloucester:
- Best-in-class properties (Top 10%) achieve 72%+ occupancy, indicating high desirability and potentially optimized availability.
- Strong performing properties (Top 25%) maintain 55% or higher occupancy, suggesting good market fit and guest satisfaction.
- Typical properties (Median) have an occupancy rate around 37%.
- Entry-level properties (Bottom 25%) average 23% occupancy, potentially facing higher vacancy.
Average Monthly Occupancy Rate Trend in New Gloucester
Average Daily Rate (ADR) Airbnb Trends in New Gloucester (2026)
Effective short term rental pricing strategy in New Gloucester involves understanding monthly ADR fluctuations. The Average Daily Rate (ADR) for Airbnb in New Gloucester typically peaks in June and dips lowest during March. Leveraging Airbnb dynamic pricing tools or strategies based on this seasonality can significantly boost revenue. Here's a look at the typical nightly rates achieved:
- Best-in-class properties (Top 10%) command rates of $430+ per night, often due to premium features or locations.
- Strong performing properties (Top 25%) achieve nightly rates of $300 or more.
- Typical properties (Median) charge around $214 per night.
- Entry-level properties (Bottom 25%) earn around $157 per night.
Average Daily Rate (ADR) Trend by Month in New Gloucester
Get Live New Gloucester Market Intelligence 👇
Explore Real-time Analytics
Airbnb Seasonality Analysis & Trends in New Gloucester (2025)
Peak Season (July, August, October)
- Revenue averages $4,780 per month
- Occupancy rates average 58.5%
- Daily rates average $262
Shoulder Season
- Revenue averages $2,613 per month
- Occupancy maintains around 37.0%
- Daily rates hold near $245
Low Season (March, November, December)
- Revenue drops to average $1,832 per month
- Occupancy decreases to average 25.7%
- Daily rates adjust to average $239
Seasonality Insights for New Gloucester
- The Airbnb seasonality in New Gloucester shows highly seasonal trends requiring careful strategy. While the sections above show seasonal averages, it's also insightful to look at the extremes:
- During the high season, the absolute peak month showcases New Gloucester's highest earning potential, with monthly revenues capable of climbing to $5,482, occupancy reaching a high of 64.1%, and ADRs peaking at $269.
- Conversely, the slowest single month of the year, typically falling within the low season, marks the market's lowest point. In this month, revenue might dip to $1,744, occupancy could drop to 24.7%, and ADRs may adjust down to $231.
- Understanding both the seasonal averages and these monthly peaks and troughs in revenue, occupancy, and ADR is crucial for maximizing your Airbnb profit potential in New Gloucester.
Seasonal Strategies for Maximizing Profit
- Peak Season: Maximize revenue through premium pricing and potentially longer minimum stays. Ensure high availability.
- Low Season: Offer competitive pricing, special promotions (e.g., extended stay discounts), and flexible cancellation policies. Target off-season travelers like remote workers or budget-conscious guests.
- Shoulder Seasons: Implement dynamic pricing that balances peak and low rates. Target weekend travelers or specific events. Offer slightly more flexible terms than peak season.
- Regularly analyze your own performance against these New Gloucester seasonality benchmarks and adjust your pricing and availability strategy accordingly.
Best Areas for Airbnb Investment in New Gloucester (2026)
Exploring the top neighborhoods for short-term rentals in New Gloucester? This section highlights key areas, outlining why they are attractive for hosts and guests, along with notable local attractions. Consider these locations based on your target guest profile and investment strategy.
| Neighborhood / Area | Why Host Here? (Target Guests & Appeal) | Key Attractions & Landmarks |
|---|---|---|
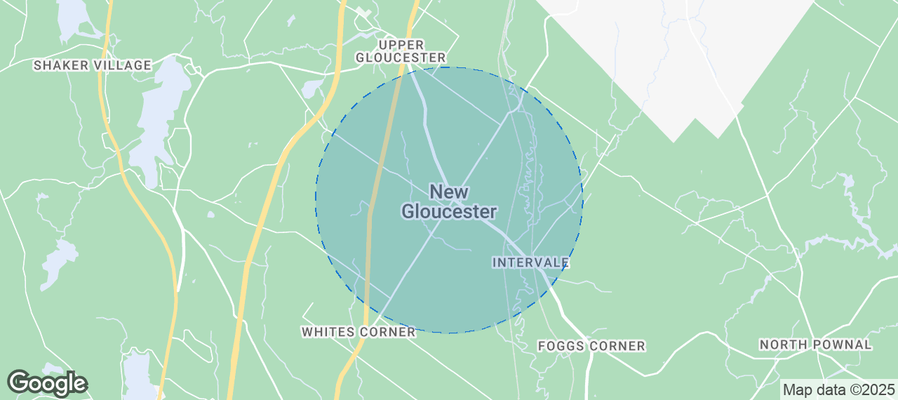
| New Gloucester Village | Centrally located with a quaint and charming atmosphere, perfect for those looking to relax in a small town setting. Visitors enjoy local shops and community events. | New Gloucester Village, Interstate 95 access, Local parks, Cobbossee Lake, Pine Tree State Arboretum |
| Royal River Park | A beautiful park area with recreational opportunities and nature trails, attracting families and outdoor enthusiasts. Ideal for those seeking nature-driven stays close to amenities. | Royal River, Picnic areas, Nature trails, Fishing spots, Nearby restaurants |
| Donnelly Farm | A rural area known for its scenic landscapes and agricultural activities. Perfect for travelers interested in farm experiences, hiking, and local produce. | Donnelly Farm, Farmers market, Hiking trails, Scenic views |
| Lost Valley | A popular destination for skiing and snowboarding in the winter, and outdoor activities year-round. Great option for adventure-seekers and families alike. | Lost Valley Ski Area, Snowboarding, Hiking trails, Family-friendly activities |
| Maine Wildlife Park | Attracts nature lovers and families, offering a chance to see native Maine animals in a natural setting. Great for educational trips and family outings. | Maine Wildlife Park, Animal exhibits, Nature trails, Education programs |
| Brunswick | A neighboring town with a vibrant downtown area, offering a variety of shops, restaurants, and cultural amenities. Close to beaches and outdoor activities. | Bowdoin College, Downtown Brunswick, Popham Beach State Park, Androscoggin River |
| Auburn | A bustling town with numerous dining and shopping options, situated near lakes and parks. Ideal for visitors looking for convenience and local attractions. | Auburn Twin Cities, Lake Auburn, Festival Plaza, Local dining |
| Sebago Lake | A prime spot for summer activities such as boating, fishing, and swimming. Visitors are drawn to the beautiful lake and surrounding natural beauty. | Sebago Lake, Sebago State Park, Boating, Camping, Fishing |
Understanding Airbnb License Requirements & STR Laws in New Gloucester (2026)
While New Gloucester, Maine, United States currently shows low STR regulations, specific Airbnb license requirements might still exist or change. Always verify the latest short term rental regulations and Airbnb license requirements directly with local government authorities for New Gloucester to ensure full compliance before hosting.
(Source: AirROI data, 2026, finding no licensed listings among those analyzed)
Top Performing Airbnb Properties in New Gloucester (2026)
Benchmark your potential! Explore examples of top-performing Airbnb properties in New Gloucesterbased on Trailing Twelve Month (TTM) revenue. Analyze their characteristics, revenue, occupancy rate, and ADR to understand what drives success in this market.
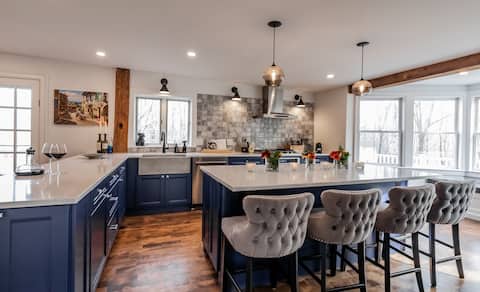
The Old Bell Tavern - Luxury Meets History
Entire Place • 3 bedrooms
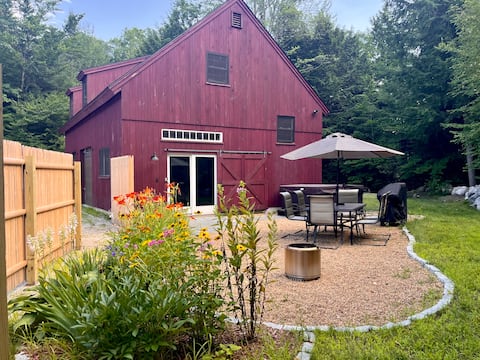
The Barnhouse with hot tub
Entire Place • 2 bedrooms
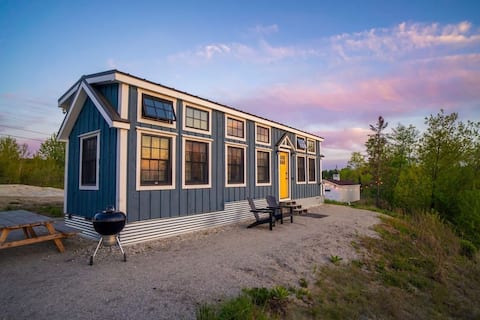
Cedar Brook Cabin - a modern tiny house in Maine
Entire Place • 2 bedrooms
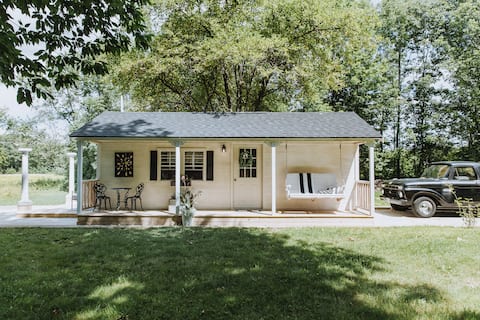
Romantic Hidden Cottage!
Entire Place • 1 bedroom
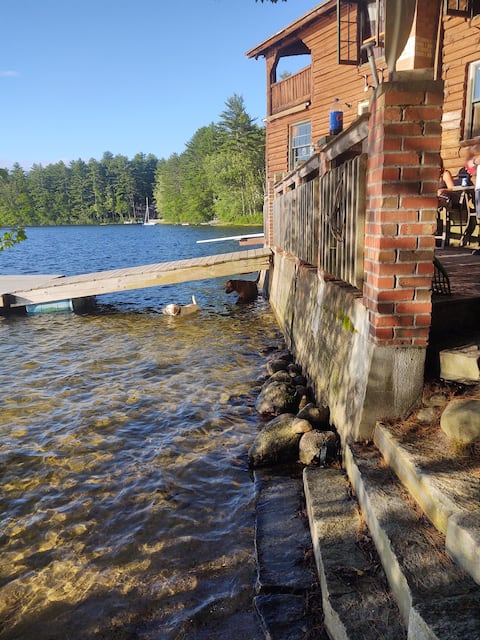
On the water Boathouse!
Entire Place • 1 bedroom

Fresh Spring Suite & Hot Tub
Entire Place • 2 bedrooms
Note: Performance varies based on location, size, amenities, seasonality, and management quality. Data reflects the past 12 months.
Top Performing Airbnb Hosts in New Gloucester (2026)
Learn from the best! This table showcases top-performing Airbnb hosts in New Gloucester based on the number of properties managed and estimated total revenue over the past year. Analyze their scale and performance metrics.
| Host Name | Properties | Grossing Revenue | Stay Reviews | Avg Rating |
|---|---|---|---|---|
| Cody | 4 | $103,039 | 142 | 4.92/5.0 |
| Cynthia | 1 | $71,757 | 27 | 4.96/5.0 |
| Bethany | 1 | $56,004 | 126 | 4.98/5.0 |
| Wildwood Collective | 1 | $55,883 | 228 | 4.89/5.0 |
| Mark | 2 | $52,424 | 171 | 4.87/5.0 |
| Misty | 1 | $34,322 | 58 | 4.76/5.0 |
| Martin | 1 | $24,440 | 75 | 4.99/5.0 |
| Kimberly | 1 | $23,784 | 219 | 4.94/5.0 |
| Scott | 1 | $10,451 | 12 | 4.92/5.0 |
| Ghafri | 1 | $9,742 | 3 | 5.00/5.0 |
Analyzing the strategies of top hosts, such as their property selection, pricing, and guest communication, can offer valuable lessons for optimizing your own Airbnb operations in New Gloucester.
Dive Deeper: Advanced New Gloucester STR Market Data (2026)
Ready to unlock more insights? AirROI provides access to advanced metrics and comprehensive Airbnb data for New Gloucester. Explore detailed analytics beyond this report to refine your investment strategy, optimize pricing, and maximize your vacation rental profits.
Explore Advanced MetricsNew Gloucester Short-Term Rental Market Composition (2026): Property & Room Types
Room Type Distribution
Property Type Distribution
Market Composition Insights for New Gloucester
- The New Gloucester Airbnb market composition is heavily skewed towards Entire Home/Apt listings, which make up 88.9% of the 18 active rentals. This indicates strong guest preference for privacy and space.
- Looking at the property type distribution in New Gloucester, House properties are the most common (50%), reflecting the local real estate landscape.
- Houses represent a significant 50% portion, catering likely to families or larger groups.
- The presence of 5.6% Hotel/Boutique listings indicates integration with traditional hospitality.
New Gloucester Airbnb Room Capacity Analysis (2026): Bedroom Distribution
Distribution of Listings by Number of Bedrooms
Room Capacity Insights for New Gloucester
- The dominant room capacity in New Gloucester is 2 bedrooms listings, making up 44.4% of the market. This suggests a strong demand for properties suitable for couples or solo travelers.
- Together, 2 bedrooms and 1 bedroom properties represent 77.7% of the active Airbnb listings in New Gloucester, indicating a high concentration in these sizes.
New Gloucester Vacation Rental Guest Capacity Trends (2026)
Distribution of Listings by Guest Capacity
Guest Capacity Insights for New Gloucester
- The most common guest capacity trend in New Gloucester vacation rentals is listings accommodating 6 guests (33.3%). This suggests the primary traveler segment is likely larger groups.
- Properties designed for 6 guests and 4 guests dominate the New Gloucester STR market, accounting for 55.5% of listings.
- 55.5% of properties accommodate 6+ guests, serving the market segment for larger families or group travel in New Gloucester.
- On average, properties in New Gloucester are equipped to host 4.8 guests.
New Gloucester Airbnb Booking Patterns (2026): Available vs. Booked Days
Available Days Distribution
Booked Days Distribution
Booking Pattern Insights for New Gloucester
- The most common availability pattern in New Gloucester falls within the 181-270 days range, representing 50% of listings. This suggests many properties have significant open periods on their calendars.
- Approximately 88.9% of listings show high availability (181+ days open annually), indicating potential for increased bookings or specific owner usage patterns.
- For booked days, the 91-180 days range is most frequent in New Gloucester (55.6%), reflecting common guest stay durations or potential owner blocking patterns.
- A notable 11.1% of properties secure long booking periods (181+ days booked per year), highlighting successful long-term rental strategies or significant owner usage.
New Gloucester Airbnb Minimum Stay Requirements Analysis
Distribution of Listings by Minimum Night Requirement
1 Night
11 listings
61.1% of total
2 Nights
4 listings
22.2% of total
3 Nights
2 listings
11.1% of total
30+ Nights
1 listings
5.6% of total
Key Insights
- The most prevalent minimum stay requirement in New Gloucester is 1 Night, adopted by 61.1% of listings. This highlights the market's preference for shorter, flexible bookings.
- A strong majority (83.3%) of the New Gloucester Airbnb data shows acceptance of very short stays (1-2 nights), indicating a dynamic, high-turnover market.
Recommendations
- Align with the market by considering a 1 Night minimum stay, as 61.1% of New Gloucester hosts use this setting.
- Explore offering discounts for stays of 30+ nights to attract the 5.6% of the market seeking extended stays.
- Adjust minimum nights based on seasonality – potentially shorter during low season and longer during peak demand periods in New Gloucester.
New Gloucester Airbnb Cancellation Policy Trends Analysis (2026)
Super Strict 30 Days
2 listings
11.1% of total
Flexible
7 listings
38.9% of total
Moderate
7 listings
38.9% of total
Firm
2 listings
11.1% of total
Cancellation Policy Insights for New Gloucester
- The prevailing Airbnb cancellation policy trend in New Gloucester is Flexible, used by 38.9% of listings.
- The market strongly favors guest-friendly terms, with 77.8% of listings offering Flexible or Moderate policies. This suggests guests in New Gloucester may expect booking flexibility.
Recommendations for Hosts
- Consider adopting a Flexible policy to align with the 38.9% market standard in New Gloucester.
- Regularly review your cancellation policy against competitors and market demand shifts in New Gloucester.
New Gloucester STR Booking Lead Time Analysis (2026)
Average Booking Lead Time by Month
Booking Lead Time Insights for New Gloucester
- The overall average booking lead time for vacation rentals in New Gloucester is 57 days.
- Guests book furthest in advance for stays during October (average 101 days), likely coinciding with peak travel demand or local events.
- The shortest booking windows occur for stays in January (average 6 days), indicating more last-minute travel plans during this time.
- Seasonally, Summer (71 days avg.) sees the longest lead times, while Winter (21 days avg.) has the shortest, reflecting typical travel planning cycles.
Recommendations for Hosts
- Use the overall average lead time (57 days) as a baseline for your pricing and availability strategy in New Gloucester.
- For October stays, consider implementing length-of-stay discounts or slightly higher rates for bookings made less than 101 days out to capitalize on advance planning.
- During January, focus on last-minute booking availability and promotions, as guests book with very short notice (6 days avg.).
- Target marketing efforts for the Summer season well in advance (at least 71 days) to capture early planners.
- Monitor your own booking lead times against these New Gloucester averages to identify opportunities for dynamic pricing adjustments.
Popular & Essential Airbnb Amenities in New Gloucester (2026)
Amenity Prevalence
Amenity Insights for New Gloucester
- Essential amenities in New Gloucester that guests expect include: Free parking on premises, Wifi. Lacking these (any) could significantly impact bookings.
- Popular amenities like Hot water, Kitchen, TV are common but not universal. Offering these can provide a competitive edge.
Recommendations for Hosts
- Ensure your listing includes all essential amenities for New Gloucester: Free parking on premises, Wifi.
- Consider adding popular differentiators like Hot water or Kitchen to increase appeal.
- Highlight unique or less common amenities you offer (e.g., hot tub, dedicated workspace, EV charger) in your listing description and photos.
- Regularly check competitor amenities in New Gloucester to stay competitive.
New Gloucester Airbnb Guest Demographics & Profile Analysis (2026)
Guest Profile Summary for New Gloucester
- The typical guest profile for Airbnb in New Gloucester consists of primarily domestic travelers (94%), often arriving from nearby Boston, typically belonging to the Post-2000s (Gen Z/Alpha) group (50%), primarily speaking English or Spanish.
- Domestic travelers account for 93.8% of guests.
- Key international markets include United States (93.8%) and Canada (2.1%).
- Top languages spoken are English (76.3%) followed by Spanish (9.3%).
- A significant demographic segment is the Post-2000s (Gen Z/Alpha) group, representing 50% of guests.
Recommendations for Hosts
- Target domestic marketing efforts towards travelers from Boston and Maine.
- Tailor amenities and listing descriptions to appeal to the dominant Post-2000s (Gen Z/Alpha) demographic (e.g., highlight fast WiFi, smart home features, local guides).
- Highlight unique local experiences or amenities relevant to the primary guest profile.
- Consider seasonal promotions aligned with peak travel times for key origin markets.
Nearby Short-Term Rental Market Comparison
How does the New Gloucester Airbnb market stack up against its neighbors? Compare key performance metrics like average monthly revenue, ADR, and occupancy rates in surrounding areas to understand the broader regional STR landscape.
| Market | Active Properties | Monthly Revenue | Daily Rate | Avg. Occupancy |
|---|---|---|---|---|
| Nahant | 12 | $6,302 | $639.26 | 43% |
| North Andover | 12 | $5,779 | $461.71 | 46% |
| Wellesley | 19 | $5,685 | $572.19 | 50% |
| Goffstown | 13 | $5,372 | $350.47 | 54% |
| Jefferson | 27 | $5,077 | $487.53 | 41% |
| Kennebunkport | 138 | $5,033 | $659.95 | 41% |
| Barnstead | 33 | $4,988 | $474.77 | 40% |
| Manchester | 12 | $4,978 | $402.51 | 45% |
| South Berwick | 13 | $4,915 | $221.75 | 55% |
| Duxbury | 19 | $4,835 | $533.46 | 43% |