North Haven Airbnb Market Analysis 2025: Short Term Rental Data & Vacation Rental Statistics in Maine, United States
Is Airbnb profitable in North Haven in 2025? Explore comprehensive Airbnb analytics for North Haven, Maine, United States to uncover income potential. This 2025 STR market report for North Haven, based on AirROI data from May 2024 to April 2025, reveals key trends in the niche market of 18 active listings.
Whether you're considering an Airbnb investment in North Haven, optimizing your existing vacation rental, or exploring rental arbitrage opportunities, understanding the North Haven Airbnb data is crucial. Leveraging the low regulation environment is key to maximizing your short term rental income potential. Let's dive into the specifics.
Key North Haven Airbnb Performance Metrics Overview
Monthly Airbnb Revenue Variations & Income Potential in North Haven (2025)
Understanding the monthly revenue variations for Airbnb listings in North Haven is key to maximizing your short term rental income potential. Seasonality significantly impacts earnings. Our analysis, based on data from the past 12 months, shows that the peak revenue month for STRs in North Haven is typically May, while September often presents the lowest earnings, highlighting opportunities for strategic pricing adjustments during shoulder and low seasons. Explore the typical Airbnb income in North Haven across different performance tiers:
- Best-in-class properties (Top 10%) achieve $7,801+ monthly, often utilizing dynamic pricing and superior guest experiences.
- Strong performing properties (Top 25%) earn $6,694 or more, indicating effective management and desirable locations/amenities.
- Typical properties (Median) generate around $3,912 per month, representing the average market performance.
- Entry-level properties (Bottom 25%) see earnings around $2,740, often with potential for optimization.
Average Monthly Airbnb Earnings Trend in North Haven
North Haven Airbnb Occupancy Rate Trends (2025)
Maximize your bookings by understanding the North Haven STR occupancy trends. Seasonal demand shifts significantly influence how often properties are booked. Typically, Maysees the highest demand (peak season occupancy), while December experiences the lowest (low season). Effective strategies, like adjusting minimum stays or offering promotions, can boost occupancy during slower periods. Here's how different property tiers perform in North Haven:
- Best-in-class properties (Top 10%) achieve 46%+ occupancy, indicating high desirability and potentially optimized availability.
- Strong performing properties (Top 25%) maintain 36% or higher occupancy, suggesting good market fit and guest satisfaction.
- Typical properties (Median) have an occupancy rate around 22%.
- Entry-level properties (Bottom 25%) average 18% occupancy, potentially facing higher vacancy.
Average Monthly Occupancy Rate Trend in North Haven
Average Daily Rate (ADR) Airbnb Trends in North Haven (2025)
Effective short term rental pricing strategy in North Haven involves understanding monthly ADR fluctuations. The Average Daily Rate (ADR) for Airbnb in North Haven typically peaks in August and dips lowest during February. Leveraging Airbnb dynamic pricing tools or strategies based on this seasonality can significantly boost revenue. Here's a look at the typical nightly rates achieved:
- Best-in-class properties (Top 10%) command rates of $725+ per night, often due to premium features or locations.
- Strong performing properties (Top 25%) achieve nightly rates of $487 or more.
- Typical properties (Median) charge around $313 per night.
- Entry-level properties (Bottom 25%) earn around $189 per night.
Average Daily Rate (ADR) Trend by Month in North Haven
Get Live North Haven Market Intelligence 👇

Explore Real-time Analytics
Airbnb Seasonality Analysis & Trends in North Haven (2025)
Peak Season (May, June, February)
- Revenue averages $8,184 per month
- Occupancy rates average 37.2%
- Daily rates average $385
Shoulder Season
- Revenue averages $4,207 per month
- Occupancy maintains around 27.8%
- Daily rates hold near $374
Low Season (September, November, December)
- Revenue drops to average $2,206 per month
- Occupancy decreases to average 15.4%
- Daily rates adjust to average $370
Seasonality Insights for North Haven
- The Airbnb seasonality in North Haven shows highly seasonal trends requiring careful strategy. While the sections above show seasonal averages, it's also insightful to look at the extremes:
- During the high season, the absolute peak month showcases North Haven's highest earning potential, with monthly revenues capable of climbing to $9,379, occupancy reaching a high of 49.5%, and ADRs peaking at $412.
- Conversely, the slowest single month of the year, typically falling within the low season, marks the market's lowest point. In this month, revenue might dip to $1,853, occupancy could drop to 12.9%, and ADRs may adjust down to $343.
- Understanding both the seasonal averages and these monthly peaks and troughs in revenue, occupancy, and ADR is crucial for maximizing your Airbnb profit potential in North Haven.
Seasonal Strategies for Maximizing Profit
- Peak Season: Maximize revenue through premium pricing and potentially longer minimum stays. Ensure high availability.
- Low Season: Offer competitive pricing, special promotions (e.g., extended stay discounts), and flexible cancellation policies. Target off-season travelers like remote workers or budget-conscious guests.
- Shoulder Seasons: Implement dynamic pricing that balances peak and low rates. Target weekend travelers or specific events. Offer slightly more flexible terms than peak season.
- Regularly analyze your own performance against these North Haven seasonality benchmarks and adjust your pricing and availability strategy accordingly.
Best Areas for Airbnb Investment in North Haven (2025)
Exploring the top neighborhoods for short-term rentals in North Haven? This section highlights key areas, outlining why they are attractive for hosts and guests, along with notable local attractions. Consider these locations based on your target guest profile and investment strategy.
| Neighborhood / Area | Why Host Here? (Target Guests & Appeal) | Key Attractions & Landmarks |
|---|---|---|
| North Haven Village | The charming village center with local shops, restaurants, and easy access to the ferry to Rockland. Ideal for those looking for a quaint Maine experience close to the water. | North Haven Historical Society, The Island Institute, Local Art Galleries, North Haven Market, Ferry to Rockland |
| Pond Island | A private and serene location, perfect for groups looking for a peaceful retreat. Great for nature lovers and those who want privacy. | Pond Island Nature Reserve, Beach Access, Kayaking Opportunities, Fishing Spots, Wildlife Viewing |
| Long Island | Known for its beautiful shoreline and outdoor activities. A favorite among families and those looking to relax in nature by the water. | Long Island Beach, Hiking Trails, Kayaking and Canoeing, Scenic Views, Wildlife Watching |
| Hurricane Island | An undeveloped island perfect for eco-tourism. Ideal for adventurous travelers seeking unique experiences. | Hiking Trails, Natural Landscapes, Outdoor Activities, Isolated Beaches, Scenic Campsites |
| Carver's Harbor | A picturesque waterfront area with stunning views and access to boating activities. Great for tourists wanting an authentic island experience. | Carver's Harbor Marina, Boating and Sailing, Fishing, Waterfront Dining, Scenic Walks |
| Swans Island | A hidden gem known for its natural beauty and quiet ambiance. Attracts visitors seeking tranquility and natural landscapes. | Swans Island Beach, Secluded Trails, Maritime Heritage, Scenic Views, Photography Opportunities |
| Vinalhaven | Just a ferry ride away, Vinalhaven offers vibrant local culture with plenty of outdoor activities and artistic inspiration. Popular with tourists looking to explore the area. | Vinalhaven Museum, Local Artisans, Beaches, Hiking Opportunities, Fishing |
| Isle au Haut | A remote island with stunning landscapes and a small population, perfect for travelers looking to escape the hustle and bustle and immerse themselves in nature. | Acadia National Park, Remote Trails, Secluded Beaches, Nature Reserves, Wildlife Observation |
Understanding Airbnb License Requirements & STR Laws in North Haven (2025)
While North Haven, Maine, United States currently shows low STR regulations, specific Airbnb license requirements might still exist or change. Always verify the latest short term rental regulations and Airbnb license requirements directly with local government authorities for North Haven to ensure full compliance before hosting.
(Source: AirROI data, 2025, finding no licensed listings among those analyzed)
Top Performing Airbnb Properties in North Haven (2025)
Benchmark your potential! Explore examples of top-performing Airbnb properties in North Havenbased on Trailing Twelve Month (TTM) revenue. Analyze their characteristics, revenue, occupancy rate, and ADR to understand what drives success in this market.

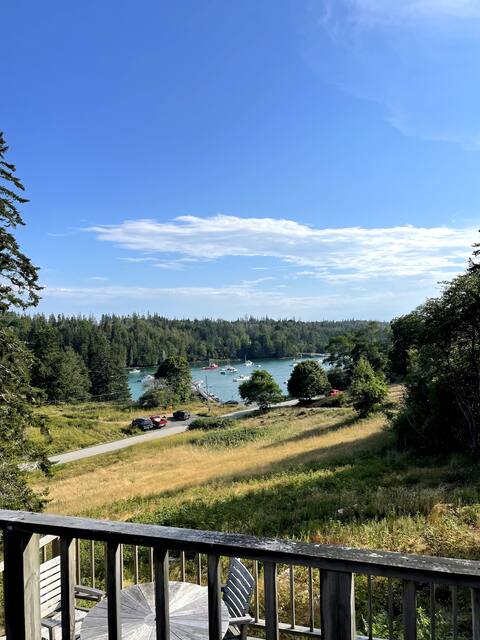
Maine Island Escape Near Ferry
Entire Place • 4 bedrooms

The Church
Entire Place • 3 bedrooms
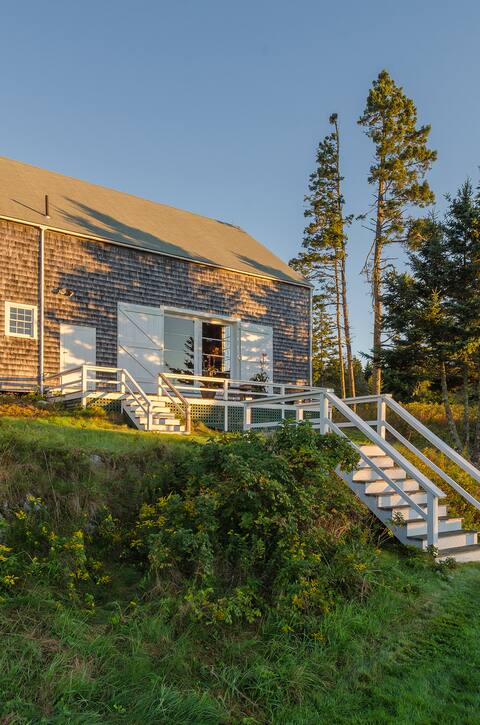
Frank Benson's Barn
Entire Place • N/A
Perfect Maine Island Escape Walk to Ferry & Marina
Entire Place • 4 bedrooms
Perched above Pulpit
Entire Place • 3 bedrooms
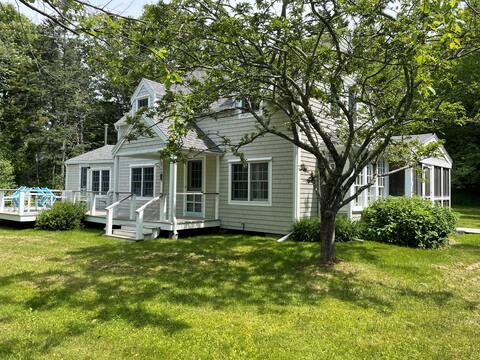
Idyllic summer home on beautiful island
Entire Place • 2 bedrooms
Note: Performance varies based on location, size, amenities, seasonality, and management quality. Data reflects the past 12 months.
Top Performing Airbnb Hosts in North Haven (2025)
Learn from the best! This table showcases top-performing Airbnb hosts in North Haven based on the number of properties managed and estimated total revenue over the past year. Analyze their scale and performance metrics.
| Host Name | Properties | Grossing Revenue | Stay Reviews | Avg Rating |
|---|---|---|---|---|
| Host #64463648 | 3 | $144,789 | 0 | 0.00/5.0 |
| Todd | 2 | $111,308 | 16 | 2.50/5.0 |
| Host #4475195 | 8 | $56,042 | 68 | 4.30/5.0 |
| Host #45308604 | 1 | $37,503 | 0 | 0.00/5.0 |
| Elisabeth | 1 | $36,461 | 20 | 4.95/5.0 |
| Bouzha | 1 | $16,266 | 14 | 5.00/5.0 |
| Becca | 1 | $12,693 | 25 | 4.96/5.0 |
| Host #108760874 | 1 | $11,326 | 0 | 0.00/5.0 |
Analyzing the strategies of top hosts, such as their property selection, pricing, and guest communication, can offer valuable lessons for optimizing your own Airbnb operations in North Haven.
Dive Deeper: Advanced North Haven STR Market Data (2025)
Ready to unlock more insights? AirROI provides access to advanced metrics and comprehensive Airbnb data for North Haven. Explore detailed analytics beyond this report to refine your investment strategy, optimize pricing, and maximize your vacation rental profits.
Explore Advanced MetricsNorth Haven Short-Term Rental Market Composition (2025): Property & Room Types
Room Type Distribution
Property Type Distribution
Market Composition Insights for North Haven
- The North Haven Airbnb market composition is heavily skewed towards Entire Home/Apt listings, which make up 72.2% of the 18 active rentals. This indicates strong guest preference for privacy and space.
- Looking at the property type distribution in North Haven, House properties are the most common (83.3%), reflecting the local real estate landscape.
- Houses represent a significant 83.3% portion, catering likely to families or larger groups.
North Haven Airbnb Room Capacity Analysis (2025): Bedroom Distribution
Distribution of Listings by Number of Bedrooms
Room Capacity Insights for North Haven
- The dominant room capacity in North Haven is 1 bedroom listings, making up 50% of the market. This suggests a strong demand for properties suitable for couples or solo travelers.
- Together, 1 bedroom and 3 bedrooms properties represent 66.7% of the active Airbnb listings in North Haven, indicating a high concentration in these sizes.
- A significant 33.4% of listings offer 3+ bedrooms, catering to larger groups and families seeking more space in North Haven.
North Haven Vacation Rental Guest Capacity Trends (2025)
Distribution of Listings by Guest Capacity
Guest Capacity Insights for North Haven
- The most common guest capacity trend in North Haven vacation rentals is listings accommodating 8+ guests (22.2%). This suggests the primary traveler segment is likely larger groups.
- Properties designed for 8+ guests and 4 guests dominate the North Haven STR market, accounting for 44.4% of listings.
- 33.3% of properties accommodate 6+ guests, serving the market segment for larger families or group travel in North Haven.
- On average, properties in North Haven are equipped to host 4.8 guests.
North Haven Airbnb Booking Patterns (2025): Available vs. Booked Days
Available Days Distribution
Booked Days Distribution
Booking Pattern Insights for North Haven
- The most common availability pattern in North Haven falls within the 271-366 days range, representing 83.3% of listings. This suggests many properties have significant open periods on their calendars.
- Approximately 100.0% of listings show high availability (181+ days open annually), indicating potential for increased bookings or specific owner usage patterns.
- For booked days, the 31-90 days range is most frequent in North Haven (44.4%), reflecting common guest stay durations or potential owner blocking patterns.
North Haven Airbnb Minimum Stay Requirements Analysis
Distribution of Listings by Minimum Night Requirement
1 Night
1 listings
10% of total
4-6 Nights
1 listings
10% of total
7-29 Nights
6 listings
60% of total
30+ Nights
2 listings
20% of total
Key Insights
- The most prevalent minimum stay requirement in North Haven is 7-29 Nights, adopted by 60% of listings. This highlights the market's preference for shorter, flexible bookings.
- Very short stays (1-2 nights) are less common (10.0%), suggesting hosts prefer slightly longer bookings to optimize turnover.
- A significant segment (20%) caters to monthly stays (30+ nights) in North Haven, pointing to opportunities in the extended-stay market.
Recommendations
- Align with the market by considering a 7-29 Nights minimum stay, as 60% of North Haven hosts use this setting.
- If feasible, allowing 1-night stays, especially midweek or during low season, could capture last-minute bookings, as only 10% currently do.
- Explore offering discounts for stays of 30+ nights to attract the 20% of the market seeking extended stays.
- Adjust minimum nights based on seasonality – potentially shorter during low season and longer during peak demand periods in North Haven.
North Haven Airbnb Cancellation Policy Trends Analysis (2025)
Strict
4 listings
100% of total
Cancellation Policy Insights for North Haven
- The prevailing Airbnb cancellation policy trend in North Haven is Strict, used by 100% of listings.
- A majority (100.0%) of hosts in North Haven utilize Firm or Strict policies, indicating a market where hosts prioritize booking security.
Recommendations for Hosts
- Consider adopting a Strict policy to align with the 100% market standard in North Haven.
- With 100% using Strict terms, this is a viable option in North Haven, particularly for high-value properties or during peak demand periods.
- Regularly review your cancellation policy against competitors and market demand shifts in North Haven.
North Haven STR Booking Lead Time Analysis (2025)
Average Booking Lead Time by Month
Booking Lead Time Insights for North Haven
- The overall average booking lead time for vacation rentals in North Haven is 76 days.
- Guests book furthest in advance for stays during May (average 138 days), likely coinciding with peak travel demand or local events.
- The shortest booking windows occur for stays in April (average 1 days), indicating more last-minute travel plans during this time.
- Seasonally, Summer (96 days avg.) sees the longest lead times, while Fall (48 days avg.) has the shortest, reflecting typical travel planning cycles.
Recommendations for Hosts
- Use the overall average lead time (76 days) as a baseline for your pricing and availability strategy in North Haven.
- For May stays, consider implementing length-of-stay discounts or slightly higher rates for bookings made less than 138 days out to capitalize on advance planning.
- During April, focus on last-minute booking availability and promotions, as guests book with very short notice (1 days avg.).
- Target marketing efforts for the Summer season well in advance (at least 96 days) to capture early planners.
- Monitor your own booking lead times against these North Haven averages to identify opportunities for dynamic pricing adjustments.
Popular & Essential Airbnb Amenities in North Haven (2025)
Amenity Prevalence
Amenity Insights for North Haven
- Essential amenities in North Haven that guests expect include: Kitchen, Washer, Dryer, Wifi, Smoke alarm, Essentials. Lacking these (any) could significantly impact bookings.
- Popular amenities like TV, Free parking on premises, Carbon monoxide alarm are common but not universal. Offering these can provide a competitive edge.
Recommendations for Hosts
- Ensure your listing includes all essential amenities for North Haven: Kitchen, Washer, Dryer, Wifi, Smoke alarm, Essentials.
- Consider adding popular differentiators like TV or Free parking on premises to increase appeal.
- Highlight unique or less common amenities you offer (e.g., hot tub, dedicated workspace, EV charger) in your listing description and photos.
- Regularly check competitor amenities in North Haven to stay competitive.
North Haven Airbnb Guest Demographics & Profile Analysis (2025)
Guest Profile Summary for North Haven
- The typical guest profile for Airbnb in North Haven consists of primarily domestic travelers (100%), often arriving from nearby Boston, typically belonging to the Post-2000s (Gen Z/Alpha) group (50%), primarily speaking English or French.
- Domestic travelers account for 100.0% of guests.
- Top languages spoken are English (75%) followed by French (25%).
- A significant demographic segment is the Post-2000s (Gen Z/Alpha) group, representing 50% of guests.
Recommendations for Hosts
- Target domestic marketing efforts towards travelers from Boston and Becket.
- Tailor amenities and listing descriptions to appeal to the dominant Post-2000s (Gen Z/Alpha) demographic (e.g., highlight fast WiFi, smart home features, local guides).
- Highlight unique local experiences or amenities relevant to the primary guest profile.
- Consider seasonal promotions aligned with peak travel times for key origin markets.
Nearby Short-Term Rental Market Comparison
How does the North Haven Airbnb market stack up against its neighbors? Compare key performance metrics like average monthly revenue, ADR, and occupancy rates in surrounding areas to understand the broader regional STR landscape.
| Market | Active Properties | Monthly Revenue | Daily Rate | Avg. Occupancy |
|---|---|---|---|---|
| Manchester | 11 | $5,721 | $410.57 | 48% |
| Trenton | 77 | $5,185 | $398.17 | 59% |
| Bar Harbor | 469 | $4,739 | $375.04 | 61% |
| Tremont | 141 | $4,481 | $360.25 | 58% |
| Mount Desert | 184 | $4,115 | $377.17 | 54% |
| Southwest Harbor | 230 | $4,093 | $373.78 | 56% |
| Taunton & Raynham Academy Grant | 12 | $3,876 | $327.29 | 52% |
| Otis | 33 | $3,718 | $301.01 | 58% |
| Wakefield | 57 | $3,677 | $340.62 | 43% |
| Dedham | 37 | $3,677 | $347.82 | 51% |