Sidney Airbnb Market Analysis 2026: Short Term Rental Data & Vacation Rental Statistics in Maine, United States
Is Airbnb profitable in Sidney in 2026? Explore comprehensive Airbnb analytics for Sidney, Maine, United States to uncover income potential. This 2026 STR market report for Sidney, based on AirROI data from February 2025 to January 2026, reveals key trends in the niche market of 20 active listings.
Whether you're considering an Airbnb investment in Sidney, optimizing your existing vacation rental, or exploring rental arbitrage opportunities, understanding the Sidney Airbnb data is crucial. Leveraging the low regulation environment is key to maximizing your short term rental income potential. Let's dive into the specifics.
Key Sidney Airbnb Performance Metrics Overview
Monthly Airbnb Revenue Variations & Income Potential in Sidney (2026)
Understanding the monthly revenue variations for Airbnb listings in Sidney is key to maximizing your short term rental income potential. Seasonality significantly impacts earnings. Our analysis, based on data from the past 12 months, shows that the peak revenue month for STRs in Sidney is typically July, while January often presents the lowest earnings, highlighting opportunities for strategic pricing adjustments during shoulder and low seasons. Explore the typical Airbnb income in Sidney across different performance tiers:
- Best-in-class properties (Top 10%) achieve $8,427+ monthly, often utilizing dynamic pricing and superior guest experiences.
- Strong performing properties (Top 25%) earn $6,063 or more, indicating effective management and desirable locations/amenities.
- Typical properties (Median) generate around $4,026 per month, representing the average market performance.
- Entry-level properties (Bottom 25%) see earnings around $2,370, often with potential for optimization.
Average Monthly Airbnb Earnings Trend in Sidney
Sidney Airbnb Occupancy Rate Trends (2026)
Maximize your bookings by understanding the Sidney STR occupancy trends. Seasonal demand shifts significantly influence how often properties are booked. Typically, Augustsees the highest demand (peak season occupancy), while January experiences the lowest (low season). Effective strategies, like adjusting minimum stays or offering promotions, can boost occupancy during slower periods. Here's how different property tiers perform in Sidney:
- Best-in-class properties (Top 10%) achieve 70%+ occupancy, indicating high desirability and potentially optimized availability.
- Strong performing properties (Top 25%) maintain 50% or higher occupancy, suggesting good market fit and guest satisfaction.
- Typical properties (Median) have an occupancy rate around 36%.
- Entry-level properties (Bottom 25%) average 22% occupancy, potentially facing higher vacancy.
Average Monthly Occupancy Rate Trend in Sidney
Average Daily Rate (ADR) Airbnb Trends in Sidney (2026)
Effective short term rental pricing strategy in Sidney involves understanding monthly ADR fluctuations. The Average Daily Rate (ADR) for Airbnb in Sidney typically peaks in September and dips lowest during March. Leveraging Airbnb dynamic pricing tools or strategies based on this seasonality can significantly boost revenue. Here's a look at the typical nightly rates achieved:
- Best-in-class properties (Top 10%) command rates of $546+ per night, often due to premium features or locations.
- Strong performing properties (Top 25%) achieve nightly rates of $470 or more.
- Typical properties (Median) charge around $283 per night.
- Entry-level properties (Bottom 25%) earn around $182 per night.
Average Daily Rate (ADR) Trend by Month in Sidney
Get Live Sidney Market Intelligence 👇

Explore Real-time Analytics
Airbnb Seasonality Analysis & Trends in Sidney (2026)
Peak Season (July, August, June)
- Revenue averages $8,277 per month
- Occupancy rates average 60.5%
- Daily rates average $331
Shoulder Season
- Revenue averages $3,967 per month
- Occupancy maintains around 36.1%
- Daily rates hold near $325
Low Season (January, February, March)
- Revenue drops to average $2,128 per month
- Occupancy decreases to average 20.7%
- Daily rates adjust to average $308
Seasonality Insights for Sidney
- The Airbnb seasonality in Sidney shows highly seasonal trends requiring careful strategy. While the sections above show seasonal averages, it's also insightful to look at the extremes:
- During the high season, the absolute peak month showcases Sidney's highest earning potential, with monthly revenues capable of climbing to $9,507, occupancy reaching a high of 69.5%, and ADRs peaking at $338.
- Conversely, the slowest single month of the year, typically falling within the low season, marks the market's lowest point. In this month, revenue might dip to $1,548, occupancy could drop to 11.3%, and ADRs may adjust down to $295.
- Understanding both the seasonal averages and these monthly peaks and troughs in revenue, occupancy, and ADR is crucial for maximizing your Airbnb profit potential in Sidney.
Seasonal Strategies for Maximizing Profit
- Peak Season: Maximize revenue through premium pricing and potentially longer minimum stays. Ensure high availability.
- Low Season: Offer competitive pricing, special promotions (e.g., extended stay discounts), and flexible cancellation policies. Target off-season travelers like remote workers or budget-conscious guests.
- Shoulder Seasons: Implement dynamic pricing that balances peak and low rates. Target weekend travelers or specific events. Offer slightly more flexible terms than peak season.
- Regularly analyze your own performance against these Sidney seasonality benchmarks and adjust your pricing and availability strategy accordingly.
Best Areas for Airbnb Investment in Sidney (2026)
Exploring the top neighborhoods for short-term rentals in Sidney? This section highlights key areas, outlining why they are attractive for hosts and guests, along with notable local attractions. Consider these locations based on your target guest profile and investment strategy.
| Neighborhood / Area | Why Host Here? (Target Guests & Appeal) | Key Attractions & Landmarks |
|---|---|---|
| Lakewood | A serene area featuring waterfront properties, perfect for nature lovers and families seeking relaxation by the water. | Lakewood Beach, Maine State Campground, Maine Wildlife Park, The Lakewood Theater, Fishing and boating opportunities |
| Downtown Skowhegan | The vibrant center of Skowhegan, known for its charming historic buildings and community events, ideal for guests looking for local culture. | Skowhegan History House, Margaret Chase Smith Library, Skowhegan Fairgrounds, Lake George Regional Park, Local shops and cafes |
| Waterville | A college town atmosphere with a mix of culture, arts, and local dining, appealing to students and younger travelers. | Colby College Museum of Art, Waterville Opera House, The Kennebec River Rail Trail, Local breweries, Waterville Main Street |
| Belgrade Lakes | A picturesque area with beautiful lakes, perfect for outdoor enthusiasts and those looking to escape the hustle and bustle of city life. | Belgrade Lakes Village, Great Pond, Kayaking and fishing, Local hiking trails, Belgrade Lakes Golf Club |
| Monmouth | A quaint, small-town experience with access to lakes and parks, appealing to families and individuals looking for a peaceful getaway. | Maranacook Lake, Monmouth Museum, Local craft fairs, Fishing and boating, Monmouth Community Park |
| Mount Abram | Known for outdoor activities year-round, this area attracts visitors for skiing, hiking, and mountain biking in the beautiful Maine landscape. | Mount Abram Ski Resort, Local hiking trails, Mountain biking courses, Scenic views, Outdoor festivals |
| Rangeley | A destination for those seeking nature and adventure, with stunning scenery and numerous outdoor activities throughout the year. | Rangeley Lakes, Rangeley Outdoor Sporting Heritage Museum, Fishing, hiking, and snowmobiling, Mooselookmeguntic Lake, Rangeley Town Park |
| New Gloucester | Proximity to Portland while retaining a rural charm, making it ideal for those wanting a balance of city and country living. | Pineland Farms, Local farms and markets, Royal River Park, Hiking trails, New Gloucester Village |
Understanding Airbnb License Requirements & STR Laws in Sidney (2026)
While Sidney, Maine, United States currently shows low STR regulations, specific Airbnb license requirements might still exist or change. Always verify the latest short term rental regulations and Airbnb license requirements directly with local government authorities for Sidney to ensure full compliance before hosting.
(Source: AirROI data, 2026, finding no licensed listings among those analyzed)
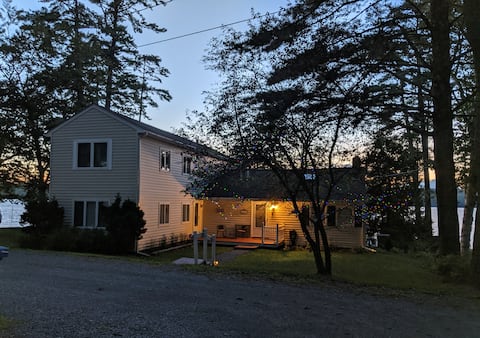
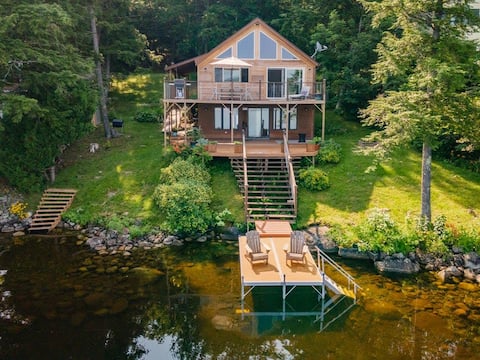
Top Performing Airbnb Properties in Sidney (2026)
Benchmark your potential! Explore examples of top-performing Airbnb properties in Sidneybased on Trailing Twelve Month (TTM) revenue. Analyze their characteristics, revenue, occupancy rate, and ADR to understand what drives success in this market.
"Sweet Sunsets"4 b/r Lake Home great ice fishing
Entire Place • 4 bedrooms
Red Cedar Haven | Lakefront • Dock • Kayaks
Entire Place • 3 bedrooms
Large Water Front Chateau (5 BR's)
Entire Place • 5 bedrooms
Waterfront Cottage
Entire Place • 1 bedroom
Picturesque Lakefront Retreat in Belgrade Lakes
Entire Place • 3 bedrooms

Peaceful home in Central Maine
Entire Place • 4 bedrooms
Note: Performance varies based on location, size, amenities, seasonality, and management quality. Data reflects the past 12 months.
Top Performing Airbnb Hosts in Sidney (2026)
Learn from the best! This table showcases top-performing Airbnb hosts in Sidney based on the number of properties managed and estimated total revenue over the past year. Analyze their scale and performance metrics.
| Host Name | Properties | Grossing Revenue | Stay Reviews | Avg Rating |
|---|---|---|---|---|
| Laura | 1 | $89,519 | 36 | 4.89/5.0 |
| Jessica | 2 | $84,035 | 163 | 4.96/5.0 |
| Feras | 1 | $75,873 | 20 | 5.00/5.0 |
| Michael | 1 | $70,034 | 9 | 5.00/5.0 |
| Rosa | 1 | $52,844 | 25 | 5.00/5.0 |
| Kristafer | 1 | $46,578 | 18 | 4.83/5.0 |
| Shelly | 1 | $40,747 | 4 | 5.00/5.0 |
| Rebecca | 1 | $37,325 | 15 | 5.00/5.0 |
| Charles | 1 | $36,682 | 77 | 4.90/5.0 |
| Denise | 1 | $36,560 | 12 | 5.00/5.0 |
Analyzing the strategies of top hosts, such as their property selection, pricing, and guest communication, can offer valuable lessons for optimizing your own Airbnb operations in Sidney.
Dive Deeper: Advanced Sidney STR Market Data (2026)
Ready to unlock more insights? AirROI provides access to advanced metrics and comprehensive Airbnb data for Sidney. Explore detailed analytics beyond this report to refine your investment strategy, optimize pricing, and maximize your vacation rental profits.
Explore Advanced MetricsSidney Short-Term Rental Market Composition (2026): Property & Room Types
Room Type Distribution
Property Type Distribution
Market Composition Insights for Sidney
- The Sidney Airbnb market composition is heavily skewed towards Entire Home/Apt listings, which make up 90% of the 20 active rentals. This indicates strong guest preference for privacy and space.
- Looking at the property type distribution in Sidney, House properties are the most common (100%), reflecting the local real estate landscape.
- Houses represent a significant 100% portion, catering likely to families or larger groups.
Sidney Airbnb Room Capacity Analysis (2026): Bedroom Distribution
Distribution of Listings by Number of Bedrooms
Room Capacity Insights for Sidney
- The dominant room capacity in Sidney is 3 bedrooms listings, making up 30% of the market. This suggests a strong demand for properties suitable for families or small groups.
- Together, 3 bedrooms and 4 bedrooms properties represent 55.0% of the active Airbnb listings in Sidney, indicating a high concentration in these sizes.
- A significant 60.0% of listings offer 3+ bedrooms, catering to larger groups and families seeking more space in Sidney.
Sidney Vacation Rental Guest Capacity Trends (2026)
Distribution of Listings by Guest Capacity
Guest Capacity Insights for Sidney
- The most common guest capacity trend in Sidney vacation rentals is listings accommodating 8+ guests (30%). This suggests the primary traveler segment is likely larger groups.
- Properties designed for 8+ guests and 4 guests dominate the Sidney STR market, accounting for 55.0% of listings.
- 50.0% of properties accommodate 6+ guests, serving the market segment for larger families or group travel in Sidney.
- On average, properties in Sidney are equipped to host 5.3 guests.
Sidney Airbnb Booking Patterns (2026): Available vs. Booked Days
Available Days Distribution
Booked Days Distribution
Booking Pattern Insights for Sidney
- The most common availability pattern in Sidney falls within the 181-270 days range, representing 55% of listings. This suggests many properties have significant open periods on their calendars.
- Approximately 100.0% of listings show high availability (181+ days open annually), indicating potential for increased bookings or specific owner usage patterns.
- For booked days, the 91-180 days range is most frequent in Sidney (55%), reflecting common guest stay durations or potential owner blocking patterns.
Sidney Airbnb Minimum Stay Requirements Analysis
Distribution of Listings by Minimum Night Requirement
1 Night
4 listings
20% of total
2 Nights
4 listings
20% of total
4-6 Nights
3 listings
15% of total
7-29 Nights
1 listings
5% of total
30+ Nights
8 listings
40% of total
Key Insights
- The most prevalent minimum stay requirement in Sidney is 30+ Nights, adopted by 40% of listings. This highlights the market's preference for longer commitments.
- A significant segment (40%) caters to monthly stays (30+ nights) in Sidney, pointing to opportunities in the extended-stay market.
Recommendations
- Align with the market by considering a 30+ Nights minimum stay, as 40% of Sidney hosts use this setting.
- If feasible, allowing 1-night stays, especially midweek or during low season, could capture last-minute bookings, as only 20% currently do.
- Explore offering discounts for stays of 30+ nights to attract the 40% of the market seeking extended stays.
- Adjust minimum nights based on seasonality – potentially shorter during low season and longer during peak demand periods in Sidney.
Sidney Airbnb Cancellation Policy Trends Analysis (2026)
Flexible
5 listings
25% of total
Moderate
4 listings
20% of total
Firm
7 listings
35% of total
Strict
4 listings
20% of total
Cancellation Policy Insights for Sidney
- The prevailing Airbnb cancellation policy trend in Sidney is Firm, used by 35% of listings.
- A majority (55.0%) of hosts in Sidney utilize Firm or Strict policies, indicating a market where hosts prioritize booking security.
Recommendations for Hosts
- Consider adopting a Firm policy to align with the 35% market standard in Sidney.
- Regularly review your cancellation policy against competitors and market demand shifts in Sidney.
Sidney STR Booking Lead Time Analysis (2026)
Average Booking Lead Time by Month
Booking Lead Time Insights for Sidney
- The overall average booking lead time for vacation rentals in Sidney is 95 days.
- Guests book furthest in advance for stays during May (average 152 days), likely coinciding with peak travel demand or local events.
- The shortest booking windows occur for stays in November (average 35 days), indicating more last-minute travel plans during this time.
- Seasonally, Spring (131 days avg.) sees the longest lead times, while Fall (44 days avg.) has the shortest, reflecting typical travel planning cycles.
Recommendations for Hosts
- Use the overall average lead time (95 days) as a baseline for your pricing and availability strategy in Sidney.
- For May stays, consider implementing length-of-stay discounts or slightly higher rates for bookings made less than 152 days out to capitalize on advance planning.
- Target marketing efforts for the Spring season well in advance (at least 131 days) to capture early planners.
- Monitor your own booking lead times against these Sidney averages to identify opportunities for dynamic pricing adjustments.
Popular & Essential Airbnb Amenities in Sidney (2026)
Amenity Prevalence
Amenity Insights for Sidney
- Essential amenities in Sidney that guests expect include: Wifi, Heating, Oven, TV, Free parking on premises, Hot water, BBQ grill, Dishes and silverware, Microwave, Smoke alarm. Lacking these (any) could significantly impact bookings.
Recommendations for Hosts
- Ensure your listing includes all essential amenities for Sidney: Wifi, Heating, Oven, TV, Free parking on premises, Hot water, BBQ grill, Dishes and silverware, Microwave, Smoke alarm.
- Prioritize adding missing essentials: BBQ grill, Dishes and silverware, Microwave, Smoke alarm.
- Highlight unique or less common amenities you offer (e.g., hot tub, dedicated workspace, EV charger) in your listing description and photos.
- Regularly check competitor amenities in Sidney to stay competitive.
Sidney Airbnb Guest Demographics & Profile Analysis (2026)
Guest Profile Summary for Sidney
- The typical guest profile for Airbnb in Sidney consists of primarily domestic travelers (97%), often arriving from nearby Portland, typically belonging to the Post-2000s (Gen Z/Alpha) group (50%), primarily speaking English or Portuguese.
- Domestic travelers account for 96.5% of guests.
- Key international markets include United States (96.5%) and DC (1.2%).
- Top languages spoken are English (73%) followed by Portuguese (10.8%).
- A significant demographic segment is the Post-2000s (Gen Z/Alpha) group, representing 50% of guests.
Recommendations for Hosts
- Target domestic marketing efforts towards travelers from Portland and New York.
- Tailor amenities and listing descriptions to appeal to the dominant Post-2000s (Gen Z/Alpha) demographic (e.g., highlight fast WiFi, smart home features, local guides).
- Highlight unique local experiences or amenities relevant to the primary guest profile.
- Consider seasonal promotions aligned with peak travel times for key origin markets.
Nearby Short-Term Rental Market Comparison
How does the Sidney Airbnb market stack up against its neighbors? Compare key performance metrics like average monthly revenue, ADR, and occupancy rates in surrounding areas to understand the broader regional STR landscape.
| Market | Active Properties | Monthly Revenue | Daily Rate | Avg. Occupancy |
|---|---|---|---|---|
| South Berwick | 12 | $5,351 | $228.88 | 58% |
| Kennebunkport | 152 | $5,309 | $669.87 | 43% |
| Bar Harbor | 510 | $5,047 | $413.86 | 58% |
| Kennebunk | 228 | $4,794 | $523.86 | 45% |
| Falmouth | 63 | $4,691 | $450.26 | 51% |
| Mount Desert | 198 | $4,605 | $435.23 | 52% |
| Trenton | 141 | $4,555 | $388.61 | 57% |
| Tremont | 158 | $4,450 | $380.52 | 55% |
| Manchester | 12 | $4,389 | $406.26 | 46% |
| Sanford | 25 | $4,331 | $328.21 | 47% |