Annapolis Neck Airbnb Market Analysis 2025: Short Term Rental Data & Vacation Rental Statistics in Maryland, United States
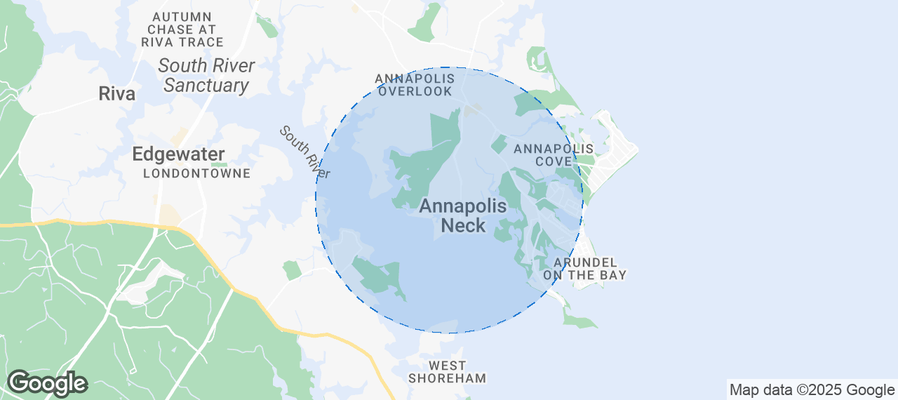
Is Airbnb profitable in Annapolis Neck in 2025? Explore comprehensive Airbnb analytics for Annapolis Neck, Maryland, United States to uncover income potential. This 2025 STR market report for Annapolis Neck, based on AirROI data from October 2024 to September 2025, reveals key trends in the niche market of 18 active listings.
Whether you're considering an Airbnb investment in Annapolis Neck, optimizing your existing vacation rental, or exploring rental arbitrage opportunities, understanding the Annapolis Neck Airbnb data is crucial. Navigating the high regulation landscape is key to maximizing your short term rental income potential. Let's dive into the specifics.
Key Annapolis Neck Airbnb Performance Metrics Overview
Monthly Airbnb Revenue Variations & Income Potential in Annapolis Neck (2025)
Understanding the monthly revenue variations for Airbnb listings in Annapolis Neck is key to maximizing your short term rental income potential. Seasonality significantly impacts earnings. Our analysis, based on data from the past 12 months, shows that the peak revenue month for STRs in Annapolis Neck is typically August, while January often presents the lowest earnings, highlighting opportunities for strategic pricing adjustments during shoulder and low seasons. Explore the typical Airbnb income in Annapolis Neck across different performance tiers:
- Best-in-class properties (Top 10%) achieve $7,272+ monthly, often utilizing dynamic pricing and superior guest experiences.
- Strong performing properties (Top 25%) earn $4,648 or more, indicating effective management and desirable locations/amenities.
- Typical properties (Median) generate around $2,983 per month, representing the average market performance.
- Entry-level properties (Bottom 25%) see earnings around $1,817, often with potential for optimization.
Average Monthly Airbnb Earnings Trend in Annapolis Neck
Annapolis Neck Airbnb Occupancy Rate Trends (2025)
Maximize your bookings by understanding the Annapolis Neck STR occupancy trends. Seasonal demand shifts significantly influence how often properties are booked. Typically, Junesees the highest demand (peak season occupancy), while November experiences the lowest (low season). Effective strategies, like adjusting minimum stays or offering promotions, can boost occupancy during slower periods. Here's how different property tiers perform in Annapolis Neck:
- Best-in-class properties (Top 10%) achieve 81%+ occupancy, indicating high desirability and potentially optimized availability.
- Strong performing properties (Top 25%) maintain 64% or higher occupancy, suggesting good market fit and guest satisfaction.
- Typical properties (Median) have an occupancy rate around 40%.
- Entry-level properties (Bottom 25%) average 27% occupancy, potentially facing higher vacancy.
Average Monthly Occupancy Rate Trend in Annapolis Neck
Average Daily Rate (ADR) Airbnb Trends in Annapolis Neck (2025)
Effective short term rental pricing strategy in Annapolis Neck involves understanding monthly ADR fluctuations. The Average Daily Rate (ADR) for Airbnb in Annapolis Neck typically peaks in October and dips lowest during March. Leveraging Airbnb dynamic pricing tools or strategies based on this seasonality can significantly boost revenue. Here's a look at the typical nightly rates achieved:
- Best-in-class properties (Top 10%) command rates of $513+ per night, often due to premium features or locations.
- Strong performing properties (Top 25%) achieve nightly rates of $416 or more.
- Typical properties (Median) charge around $256 per night.
- Entry-level properties (Bottom 25%) earn around $165 per night.
Average Daily Rate (ADR) Trend by Month in Annapolis Neck
Get Live Annapolis Neck Market Intelligence 👇
Explore Real-time Analytics
Airbnb Seasonality Analysis & Trends in Annapolis Neck (2025)
Peak Season (August, July, June)
- Revenue averages $5,233 per month
- Occupancy rates average 56.9%
- Daily rates average $307
Shoulder Season
- Revenue averages $3,400 per month
- Occupancy maintains around 44.2%
- Daily rates hold near $307
Low Season (January, February, November)
- Revenue drops to average $2,505 per month
- Occupancy decreases to average 37.1%
- Daily rates adjust to average $310
Seasonality Insights for Annapolis Neck
- The Airbnb seasonality in Annapolis Neck shows highly seasonal trends requiring careful strategy. While the sections above show seasonal averages, it's also insightful to look at the extremes:
- During the high season, the absolute peak month showcases Annapolis Neck's highest earning potential, with monthly revenues capable of climbing to $5,392, occupancy reaching a high of 61.4%, and ADRs peaking at $316.
- Conversely, the slowest single month of the year, typically falling within the low season, marks the market's lowest point. In this month, revenue might dip to $2,459, occupancy could drop to 34.4%, and ADRs may adjust down to $299.
- Understanding both the seasonal averages and these monthly peaks and troughs in revenue, occupancy, and ADR is crucial for maximizing your Airbnb profit potential in Annapolis Neck.
Seasonal Strategies for Maximizing Profit
- Peak Season: Maximize revenue through premium pricing and potentially longer minimum stays. Ensure high availability.
- Low Season: Offer competitive pricing, special promotions (e.g., extended stay discounts), and flexible cancellation policies. Target off-season travelers like remote workers or budget-conscious guests.
- Shoulder Seasons: Implement dynamic pricing that balances peak and low rates. Target weekend travelers or specific events. Offer slightly more flexible terms than peak season.
- Regularly analyze your own performance against these Annapolis Neck seasonality benchmarks and adjust your pricing and availability strategy accordingly.
Best Areas for Airbnb Investment in Annapolis Neck (2025)
Exploring the top neighborhoods for short-term rentals in Annapolis Neck? This section highlights key areas, outlining why they are attractive for hosts and guests, along with notable local attractions. Consider these locations based on your target guest profile and investment strategy.
| Neighborhood / Area | Why Host Here? (Target Guests & Appeal) | Key Attractions & Landmarks |
|---|---|---|
| Eastport | Charming waterfront neighborhood known for its historic homes and vibrant maritime culture. Ideal for those seeking a picturesque harbor view and proximity to downtown Annapolis. | Annapolis Maritime Museum, Eastport Yacht Club, Broadneck Park, Sandy Point State Park, Historic Eastport District |
| Annapolis City Dock | The heart of Annapolis, this area offers direct access to shops, restaurants, and waterfront activities. Perfect for visitors wanting to experience the city's rich history and lively atmosphere. | Maryland State House, United States Naval Academy, Annapolis Towne Centre, Ego Alley, St. Anne's Church |
| West Annapolis | A quaint neighborhood known for its local boutiques and cozy eateries. Appeals to travelers looking for a more relaxed vibe while still being close to the action of downtown. | West Annapolis Shopping District, B&A Trail, Broadneck Park, The Naval Academy Museum, West Annapolis Ice Cream |
| Historic District | Filled with colonial architecture and historical significance, this area draws tourists interested in walking tours and cultural experiences. | William Paca House and Garden, Banneker-Douglass Museum, St. John's College, Annapolis Summer Garden Theatre, Chase-Lloyd House |
| Sandy Point State Park | A beautiful natural area offering beaches, picnic areas, and outdoor activities. Great for families and nature lovers looking to escape the city. | Sandy Point State Park Beach, Nature trails, Fishing opportunities, Picnic areas, Birdwatching spots |
| Cape St. Claire | A waterfront community that blends residential life with beach access, ideal for those looking for a more suburban feel while still close to Annapolis. | Cape St. Claire Community Beach, Broadneck Park, Fishing and crabbing spots, Nature trails, Local boating |
| Parole | A growing area with shopping and dining options, suitable for visitors needing convenient access to amenities with a suburban vibe. | Westfield Annapolis Mall, Local restaurants, Broadneck Park, Giant Food, Target |
| Arnold | A peaceful residential area appealing to visitors seeking tranquility while still being near Annapolis attractions, making it a great retreat. | Broadneck Park, Sandy Point State Park, Arnold Road Park, Local trails and nature areas, Community events |
Understanding Airbnb License Requirements & STR Laws in Annapolis Neck (2025)
Yes, Annapolis Neck, Maryland, United States enforces high STR regulations. Obtaining a license and ensuring compliance is almost certainly required according to current 2025 STR laws. Always verify the latest short term rental regulations and Airbnb license requirements directly with local government authorities for Annapolis Neck to ensure full compliance before hosting.
(Source: AirROI data, 2025, based on 83% licensed listings)
Top Performing Airbnb Properties in Annapolis Neck (2025)
Benchmark your potential! Explore examples of top-performing Airbnb properties in Annapolis Neckbased on Trailing Twelve Month (TTM) revenue. Analyze their characteristics, revenue, occupancy rate, and ADR to understand what drives success in this market.
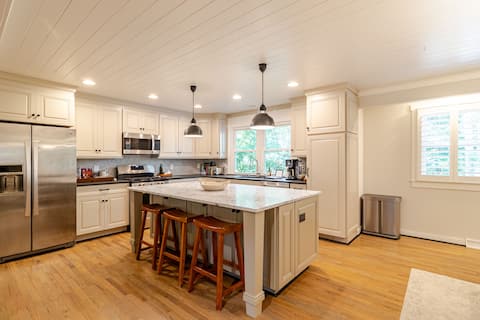
Captain's Retreat, Outdoor Oasis <10 mins USNA
Entire Place • 3 bedrooms

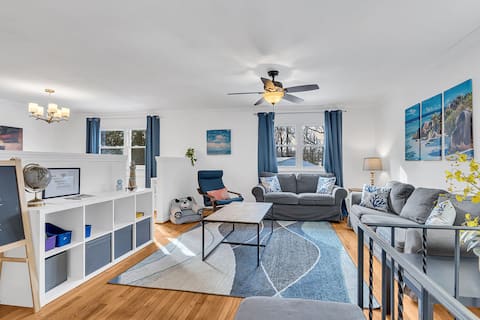
Light, Bright and Comfortable! No cleaning fee!
Entire Place • 3 bedrooms
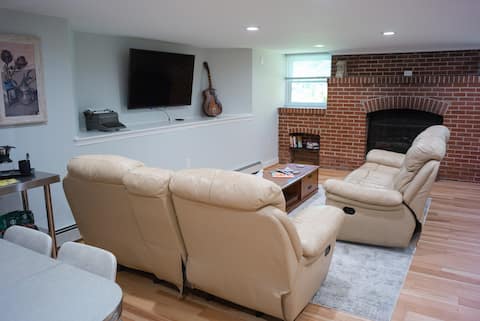
Quiet Home Close to Downtown Annapolis and Parks
Entire Place • 4 bedrooms

Annapolis Retreat - Near DTA & Great for Families!
Entire Place • 5 bedrooms
Restful guest suite, scent-free, step-free
Entire Place • 3 bedrooms
Cute cozy rancher close to down town Annapolis
Entire Place • 2 bedrooms
Note: Performance varies based on location, size, amenities, seasonality, and management quality. Data reflects the past 12 months.
Top Performing Airbnb Hosts in Annapolis Neck (2025)
Learn from the best! This table showcases top-performing Airbnb hosts in Annapolis Neck based on the number of properties managed and estimated total revenue over the past year. Analyze their scale and performance metrics.
| Host Name | Properties | Grossing Revenue | Stay Reviews | Avg Rating |
|---|---|---|---|---|
| Brittany | 1 | $66,815 | 26 | 4.96/5.0 |
| Susannah | 1 | $65,607 | 46 | 4.96/5.0 |
| Christopher | 1 | $62,743 | 48 | 4.90/5.0 |
| Ronny | 1 | $62,054 | 61 | 4.97/5.0 |
| Grey Havens LLC | 1 | $47,363 | 29 | 5.00/5.0 |
| Terencia | 1 | $41,965 | 47 | 4.77/5.0 |
| Jonathan & Mary | 1 | $32,287 | 241 | 4.98/5.0 |
| Linda | 1 | $25,085 | 53 | 4.92/5.0 |
| Cara | 1 | $22,740 | 65 | 4.94/5.0 |
| Sean | 1 | $16,971 | 2 | Not Rated |
Analyzing the strategies of top hosts, such as their property selection, pricing, and guest communication, can offer valuable lessons for optimizing your own Airbnb operations in Annapolis Neck.
Dive Deeper: Advanced Annapolis Neck STR Market Data (2025)
Ready to unlock more insights? AirROI provides access to advanced metrics and comprehensive Airbnb data for Annapolis Neck. Explore detailed analytics beyond this report to refine your investment strategy, optimize pricing, and maximize your vacation rental profits.
Explore Advanced MetricsAnnapolis Neck Short-Term Rental Market Composition (2025): Property & Room Types
Room Type Distribution
Property Type Distribution
Market Composition Insights for Annapolis Neck
- The Annapolis Neck Airbnb market composition is heavily skewed towards Entire Home/Apt listings, which make up 94.4% of the 18 active rentals. This indicates strong guest preference for privacy and space.
- Looking at the property type distribution in Annapolis Neck, House properties are the most common (66.7%), reflecting the local real estate landscape.
- Houses represent a significant 66.7% portion, catering likely to families or larger groups.
- The presence of 5.6% Hotel/Boutique listings indicates integration with traditional hospitality.
Annapolis Neck Airbnb Room Capacity Analysis (2025): Bedroom Distribution
Distribution of Listings by Number of Bedrooms
Room Capacity Insights for Annapolis Neck
- The dominant room capacity in Annapolis Neck is 3 bedrooms listings, making up 27.8% of the market. This suggests a strong demand for properties suitable for families or small groups.
- Together, 3 bedrooms and 2 bedrooms properties represent 50.0% of the active Airbnb listings in Annapolis Neck, indicating a high concentration in these sizes.
- A significant 50.1% of listings offer 3+ bedrooms, catering to larger groups and families seeking more space in Annapolis Neck.
Annapolis Neck Vacation Rental Guest Capacity Trends (2025)
Distribution of Listings by Guest Capacity
Guest Capacity Insights for Annapolis Neck
- The most common guest capacity trend in Annapolis Neck vacation rentals is listings accommodating 4 guests (27.8%). This suggests the primary traveler segment is likely small families or groups.
- Properties designed for 4 guests and 8+ guests dominate the Annapolis Neck STR market, accounting for 55.6% of listings.
- 50.1% of properties accommodate 6+ guests, serving the market segment for larger families or group travel in Annapolis Neck.
- On average, properties in Annapolis Neck are equipped to host 5.2 guests.
Annapolis Neck Airbnb Booking Patterns (2025): Available vs. Booked Days
Available Days Distribution
Booked Days Distribution
Booking Pattern Insights for Annapolis Neck
- The most common availability pattern in Annapolis Neck falls within the 271-366 days range, representing 44.4% of listings. This suggests many properties have significant open periods on their calendars.
- Approximately 77.7% of listings show high availability (181+ days open annually), indicating potential for increased bookings or specific owner usage patterns.
- For booked days, the 91-180 days range is most frequent in Annapolis Neck (33.3%), reflecting common guest stay durations or potential owner blocking patterns.
- A notable 22.3% of properties secure long booking periods (181+ days booked per year), highlighting successful long-term rental strategies or significant owner usage.
Annapolis Neck Airbnb Minimum Stay Requirements Analysis
Distribution of Listings by Minimum Night Requirement
1 Night
5 listings
27.8% of total
2 Nights
6 listings
33.3% of total
3 Nights
1 listings
5.6% of total
4-6 Nights
1 listings
5.6% of total
7-29 Nights
1 listings
5.6% of total
30+ Nights
4 listings
22.2% of total
Key Insights
- The most prevalent minimum stay requirement in Annapolis Neck is 2 Nights, adopted by 33.3% of listings. This highlights the market's preference for shorter, flexible bookings.
- A strong majority (61.1%) of the Annapolis Neck Airbnb data shows acceptance of very short stays (1-2 nights), indicating a dynamic, high-turnover market.
- A significant segment (22.2%) caters to monthly stays (30+ nights) in Annapolis Neck, pointing to opportunities in the extended-stay market.
Recommendations
- Align with the market by considering a 2 Nights minimum stay, as 33.3% of Annapolis Neck hosts use this setting.
- If feasible, allowing 1-night stays, especially midweek or during low season, could capture last-minute bookings, as only 27.8% currently do.
- Explore offering discounts for stays of 30+ nights to attract the 22.2% of the market seeking extended stays.
- Adjust minimum nights based on seasonality – potentially shorter during low season and longer during peak demand periods in Annapolis Neck.
Annapolis Neck Airbnb Cancellation Policy Trends Analysis (2025)
Flexible
2 listings
11.1% of total
Moderate
7 listings
38.9% of total
Firm
6 listings
33.3% of total
Strict
3 listings
16.7% of total
Cancellation Policy Insights for Annapolis Neck
- The prevailing Airbnb cancellation policy trend in Annapolis Neck is Moderate, used by 38.9% of listings.
- There's a relatively balanced mix between guest-friendly (50.0%) and stricter (50.0%) policies, offering choices for different guest needs.
Recommendations for Hosts
- Consider adopting a Moderate policy to align with the 38.9% market standard in Annapolis Neck.
- Regularly review your cancellation policy against competitors and market demand shifts in Annapolis Neck.
Annapolis Neck STR Booking Lead Time Analysis (2025)
Average Booking Lead Time by Month
Booking Lead Time Insights for Annapolis Neck
- The overall average booking lead time for vacation rentals in Annapolis Neck is 46 days.
- Guests book furthest in advance for stays during May (average 103 days), likely coinciding with peak travel demand or local events.
- The shortest booking windows occur for stays in January (average 20 days), indicating more last-minute travel plans during this time.
- Seasonally, Spring (62 days avg.) sees the longest lead times, while Winter (24 days avg.) has the shortest, reflecting typical travel planning cycles.
Recommendations for Hosts
- Use the overall average lead time (46 days) as a baseline for your pricing and availability strategy in Annapolis Neck.
- For May stays, consider implementing length-of-stay discounts or slightly higher rates for bookings made less than 103 days out to capitalize on advance planning.
- Target marketing efforts for the Spring season well in advance (at least 62 days) to capture early planners.
- Monitor your own booking lead times against these Annapolis Neck averages to identify opportunities for dynamic pricing adjustments.
Popular & Essential Airbnb Amenities in Annapolis Neck (2025)
Amenity Prevalence
Amenity Insights for Annapolis Neck
- Essential amenities in Annapolis Neck that guests expect include: Smoke alarm, Refrigerator, Air conditioning, Heating, Coffee maker, Free parking on premises, Wifi, Microwave, Hangers. Lacking these (any) could significantly impact bookings.
- Popular amenities like Essentials are common but not universal. Offering these can provide a competitive edge.
Recommendations for Hosts
- Ensure your listing includes all essential amenities for Annapolis Neck: Smoke alarm, Refrigerator, Air conditioning, Heating, Coffee maker, Free parking on premises, Wifi, Microwave, Hangers.
- Consider adding popular differentiators like Essentials to increase appeal.
- Highlight unique or less common amenities you offer (e.g., hot tub, dedicated workspace, EV charger) in your listing description and photos.
- Regularly check competitor amenities in Annapolis Neck to stay competitive.
Annapolis Neck Airbnb Guest Demographics & Profile Analysis (2025)
Guest Profile Summary for Annapolis Neck
- The typical guest profile for Airbnb in Annapolis Neck consists of primarily domestic travelers (91%), often arriving from nearby Washington, typically belonging to the Post-2000s (Gen Z/Alpha) group (50%), primarily speaking English or Spanish.
- Domestic travelers account for 90.6% of guests.
- Key international markets include United States (90.6%) and DC (6.7%).
- Top languages spoken are English (69.6%) followed by Spanish (10.1%).
- A significant demographic segment is the Post-2000s (Gen Z/Alpha) group, representing 50% of guests.
Recommendations for Hosts
- Target domestic marketing efforts towards travelers from Washington and Annapolis.
- Tailor amenities and listing descriptions to appeal to the dominant Post-2000s (Gen Z/Alpha) demographic (e.g., highlight fast WiFi, smart home features, local guides).
- Highlight unique local experiences or amenities relevant to the primary guest profile.
- Consider seasonal promotions aligned with peak travel times for key origin markets.
Nearby Short-Term Rental Market Comparison
How does the Annapolis Neck Airbnb market stack up against its neighbors? Compare key performance metrics like average monthly revenue, ADR, and occupancy rates in surrounding areas to understand the broader regional STR landscape.
| Market | Active Properties | Monthly Revenue | Daily Rate | Avg. Occupancy |
|---|---|---|---|---|
| Centreville | 16 | $6,087 | $577.14 | 44% |
| Mayo | 14 | $5,844 | $448.25 | 47% |
| Stevensville | 79 | $5,518 | $546.03 | 40% |
| Lower Windsor Township | 14 | $5,253 | $421.97 | 46% |
| Shannondale | 49 | $5,211 | $309.96 | 55% |
| Easton | 43 | $5,106 | $646.64 | 39% |
| Arundel on the Bay | 33 | $4,884 | $499.41 | 38% |
| Chester | 17 | $4,837 | $506.12 | 41% |
| Queenstown | 22 | $4,804 | $599.60 | 34% |
| Mineral | 205 | $4,787 | $450.56 | 35% |