Forest Glen Airbnb Market Analysis 2026: Short Term Rental Data & Vacation Rental Statistics in Maryland, United States
Is Airbnb profitable in Forest Glen in 2026? Explore comprehensive Airbnb analytics for Forest Glen, Maryland, United States to uncover income potential. This 2026 STR market report for Forest Glen, based on AirROI data from February 2025 to January 2026, reveals key trends in the niche market of 19 active listings.
Whether you're considering an Airbnb investment in Forest Glen, optimizing your existing vacation rental, or exploring rental arbitrage opportunities, understanding the Forest Glen Airbnb data is crucial. Leveraging the low regulation environment is key to maximizing your short term rental income potential. Let's dive into the specifics.
Key Forest Glen Airbnb Performance Metrics Overview
Monthly Airbnb Revenue Variations & Income Potential in Forest Glen (2026)
Understanding the monthly revenue variations for Airbnb listings in Forest Glen is key to maximizing your short term rental income potential. Seasonality significantly impacts earnings. Our analysis, based on data from the past 12 months, shows that the peak revenue month for STRs in Forest Glen is typically October, while February often presents the lowest earnings, highlighting opportunities for strategic pricing adjustments during shoulder and low seasons. Explore the typical Airbnb income in Forest Glen across different performance tiers:
- Best-in-class properties (Top 10%) achieve $6,277+ monthly, often utilizing dynamic pricing and superior guest experiences.
- Strong performing properties (Top 25%) earn $3,278 or more, indicating effective management and desirable locations/amenities.
- Typical properties (Median) generate around $1,007 per month, representing the average market performance.
- Entry-level properties (Bottom 25%) see earnings around $482, often with potential for optimization.
Average Monthly Airbnb Earnings Trend in Forest Glen
Forest Glen Airbnb Occupancy Rate Trends (2026)
Maximize your bookings by understanding the Forest Glen STR occupancy trends. Seasonal demand shifts significantly influence how often properties are booked. Typically, Novembersees the highest demand (peak season occupancy), while December experiences the lowest (low season). Effective strategies, like adjusting minimum stays or offering promotions, can boost occupancy during slower periods. Here's how different property tiers perform in Forest Glen:
- Best-in-class properties (Top 10%) achieve 81%+ occupancy, indicating high desirability and potentially optimized availability.
- Strong performing properties (Top 25%) maintain 65% or higher occupancy, suggesting good market fit and guest satisfaction.
- Typical properties (Median) have an occupancy rate around 38%.
- Entry-level properties (Bottom 25%) average 26% occupancy, potentially facing higher vacancy.
Average Monthly Occupancy Rate Trend in Forest Glen
Average Daily Rate (ADR) Airbnb Trends in Forest Glen (2026)
Effective short term rental pricing strategy in Forest Glen involves understanding monthly ADR fluctuations. The Average Daily Rate (ADR) for Airbnb in Forest Glen typically peaks in June and dips lowest during January. Leveraging Airbnb dynamic pricing tools or strategies based on this seasonality can significantly boost revenue. Here's a look at the typical nightly rates achieved:
- Best-in-class properties (Top 10%) command rates of $235+ per night, often due to premium features or locations.
- Strong performing properties (Top 25%) achieve nightly rates of $93 or more.
- Typical properties (Median) charge around $35 per night.
- Entry-level properties (Bottom 25%) earn around $32 per night.
Average Daily Rate (ADR) Trend by Month in Forest Glen
Get Live Forest Glen Market Intelligence 👇
Explore Real-time Analytics
Airbnb Seasonality Analysis & Trends in Forest Glen (2026)
Peak Season (October, January, November)
- Revenue averages $3,593 per month
- Occupancy rates average 50.1%
- Daily rates average $78
Shoulder Season
- Revenue averages $2,163 per month
- Occupancy maintains around 44.6%
- Daily rates hold near $91
Low Season (February, April, May)
- Revenue drops to average $1,378 per month
- Occupancy decreases to average 42.5%
- Daily rates adjust to average $93
Seasonality Insights for Forest Glen
- The Airbnb seasonality in Forest Glen shows highly seasonal trends requiring careful strategy. While the sections above show seasonal averages, it's also insightful to look at the extremes:
- During the high season, the absolute peak month showcases Forest Glen's highest earning potential, with monthly revenues capable of climbing to $4,337, occupancy reaching a high of 58.4%, and ADRs peaking at $99.
- Conversely, the slowest single month of the year, typically falling within the low season, marks the market's lowest point. In this month, revenue might dip to $902, occupancy could drop to 28.6%, and ADRs may adjust down to $78.
- Understanding both the seasonal averages and these monthly peaks and troughs in revenue, occupancy, and ADR is crucial for maximizing your Airbnb profit potential in Forest Glen.
Seasonal Strategies for Maximizing Profit
- Peak Season: Maximize revenue through premium pricing and potentially longer minimum stays. Ensure high availability.
- Low Season: Offer competitive pricing, special promotions (e.g., extended stay discounts), and flexible cancellation policies. Target off-season travelers like remote workers or budget-conscious guests.
- Shoulder Seasons: Implement dynamic pricing that balances peak and low rates. Target weekend travelers or specific events. Offer slightly more flexible terms than peak season.
- Regularly analyze your own performance against these Forest Glen seasonality benchmarks and adjust your pricing and availability strategy accordingly.
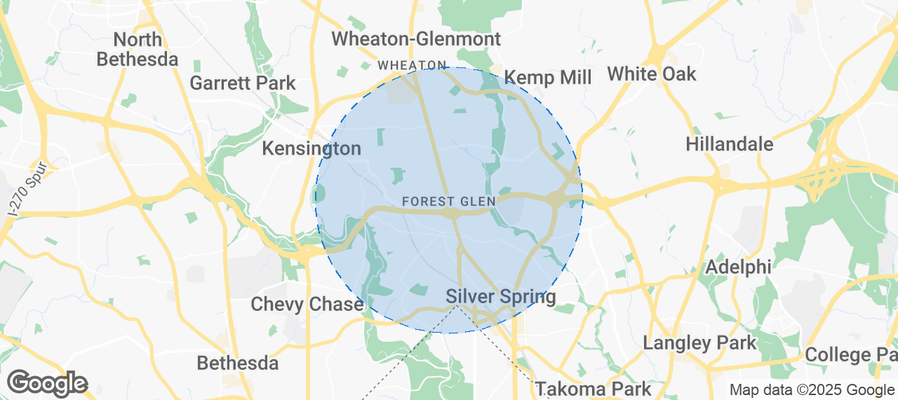
Best Areas for Airbnb Investment in Forest Glen (2026)
Exploring the top neighborhoods for short-term rentals in Forest Glen? This section highlights key areas, outlining why they are attractive for hosts and guests, along with notable local attractions. Consider these locations based on your target guest profile and investment strategy.
| Neighborhood / Area | Why Host Here? (Target Guests & Appeal) | Key Attractions & Landmarks |
|---|---|---|
| Forest Glen | A charming suburban neighborhood with a rich history and close proximity to Washington, D.C. Ideal for families and business travelers looking for a peaceful stay near the capital's attractions and amenities. | Forest Glen Park, Rock Creek Park, Maryland-National Capital Park and Planning Commission, Washington, D.C. metropolitan area, Sligo Creek Parkway |
| Silver Spring | A vibrant downtown area with a mix of urban conveniences and suburban charm. Perfect for guests who want a blend of cultural experiences, dining options, and easy access to public transit connecting to D.C. | Silver Spring Town Center, AFI Silver Theatre and Cultural Center, Brookside Gardens, The Fillmore Silver Spring, Sligo Creek Trail |
| Chevy Chase | An affluent community known for its boutique shopping, fine dining, and excellent schools. Attractive to travelers looking for upscale accommodations just a short distance from downtown D.C. | Chevy Chase Pavilion, Rock Creek Park, The Shops at Wisconsin Place, Strathmore Music Center, Sumner Park |
| Bethesda | A bustling urban center with a lively arts scene and numerous restaurants. It attracts visitors for its cultural events, shopping, and proximity to D.C. Perfect for business and leisure travelers alike. | Bethesda Row, The Bethesda Art Gallery, Walter Reed National Military Medical Center, Woodmont Triangle, Strathmore Music Center |
| Takoma Park | Known for its historic preservation and vibrant community, this neighborhood offers a unique blend of urban and suburban living. It's appealing to guests interested in a quaint yet cultural atmosphere. | Takoma Park Farmers Market, Takoma Park Community Center, The Takoma Theatre, Sligo Creek Park, Historic Takoma |
| Rockville | A rapidly growing suburb with a mix of modern developments and historic sites. Something for every traveler, making it a versatile location for Airbnb investments. | Rockville Town Square, Maryland SoccerPlex, Hungerford Valley Park, Lake Needwood, Rockville Memorial Library |
| Glenmont | A residential neighborhood benefiting from the nearby Glenmont Metro Station, providing transit access to D.C. Popular with budget-conscious travelers looking for affordable and convenient stays. | Explore More Discovery Museum, Glenmont Shopping Center, New Hampshire Estates Park, Kemp Mill Park, Rock Creek Park |
| Wheaton | A diverse community known for its excellent cuisine and park offerings. Ideal for guests looking to experience local culture and enjoy the large Wheaton Regional Park. | Wheaton Regional Park, Brookside Gardens, Wheaton Mall, Kemp Mill Park, Sligo Creek Trail |
Understanding Airbnb License Requirements & STR Laws in Forest Glen (2026)
While Forest Glen, Maryland, United States currently shows low STR regulations, specific Airbnb license requirements might still exist or change. Always verify the latest short term rental regulations and Airbnb license requirements directly with local government authorities for Forest Glen to ensure full compliance before hosting.
(Source: AirROI data, 2026, finding no licensed listings among those analyzed)
Top Performing Airbnb Properties in Forest Glen (2026)
Benchmark your potential! Explore examples of top-performing Airbnb properties in Forest Glenbased on Trailing Twelve Month (TTM) revenue. Analyze their characteristics, revenue, occupancy rate, and ADR to understand what drives success in this market.
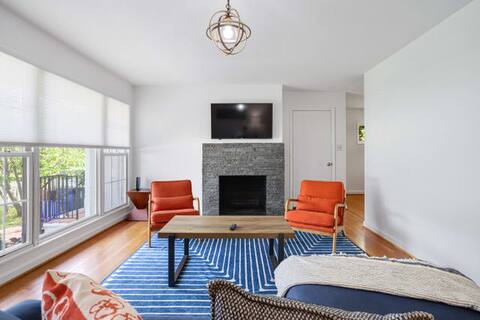
Forest Glen Silver Spring Gem - Parking
Entire Place • 4 bedrooms
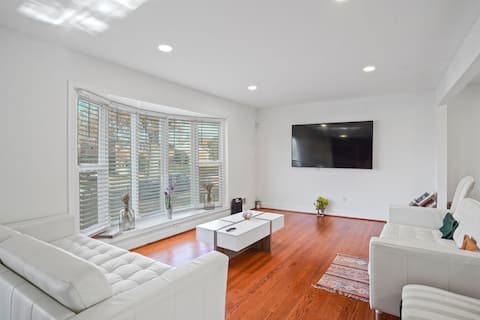
Entire 3-Bedroom Silver Spring-5 min walk to Metro
Entire Place • 3 bedrooms

Private 1 BR apt w/patio, 1/2 mile to Metro
Entire Place • 1 bedroom
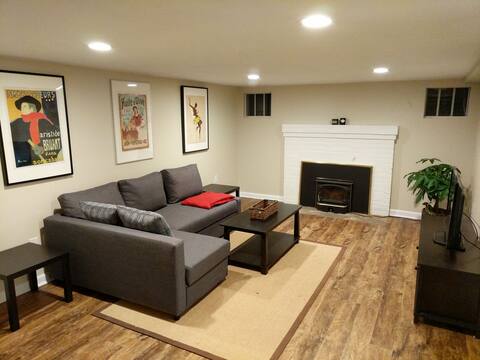
Beautiful Basement Apartment
Entire Place • 1 bedroom
Entire-2 bedroom -2 Full bath-5 min walk to Metro
Entire Place • 2 bedrooms

Cozy looking room few mins to forestglen metro
Private Room • 4 bedrooms
Note: Performance varies based on location, size, amenities, seasonality, and management quality. Data reflects the past 12 months.
Top Performing Airbnb Hosts in Forest Glen (2026)
Learn from the best! This table showcases top-performing Airbnb hosts in Forest Glen based on the number of properties managed and estimated total revenue over the past year. Analyze their scale and performance metrics.
| Host Name | Properties | Grossing Revenue | Stay Reviews | Avg Rating |
|---|---|---|---|---|
| Home Sweet City | 1 | $84,410 | 61 | 4.61/5.0 |
| Tee | 4 | $70,947 | 52 | 4.93/5.0 |
| John | 11 | $30,651 | 106 | 4.71/5.0 |
| Kathleen | 1 | $16,816 | 27 | 4.96/5.0 |
| Adam | 1 | $14,923 | 88 | 4.84/5.0 |
| Sterling | 1 | $756 | 51 | 4.94/5.0 |
Analyzing the strategies of top hosts, such as their property selection, pricing, and guest communication, can offer valuable lessons for optimizing your own Airbnb operations in Forest Glen.
Dive Deeper: Advanced Forest Glen STR Market Data (2026)
Ready to unlock more insights? AirROI provides access to advanced metrics and comprehensive Airbnb data for Forest Glen. Explore detailed analytics beyond this report to refine your investment strategy, optimize pricing, and maximize your vacation rental profits.
Explore Advanced MetricsForest Glen Short-Term Rental Market Composition (2026): Property & Room Types
Room Type Distribution
Property Type Distribution
Market Composition Insights for Forest Glen
- The Forest Glen Airbnb market composition is heavily skewed towards Private Room listings, which make up 73.7% of the 19 active rentals. This indicates strong guest preference for privacy and space.
- Looking at the property type distribution in Forest Glen, House properties are the most common (78.9%), reflecting the local real estate landscape.
- Houses represent a significant 78.9% portion, catering likely to families or larger groups.
Forest Glen Airbnb Room Capacity Analysis (2026): Bedroom Distribution
Distribution of Listings by Number of Bedrooms
Room Capacity Insights for Forest Glen
- The dominant room capacity in Forest Glen is 4 bedrooms listings, making up 26.3% of the market. This suggests a strong demand for properties suitable for families or small groups.
- Together, 4 bedrooms and 1 bedroom properties represent 42.1% of the active Airbnb listings in Forest Glen, indicating a high concentration in these sizes.
- A significant 36.8% of listings offer 3+ bedrooms, catering to larger groups and families seeking more space in Forest Glen.
Forest Glen Vacation Rental Guest Capacity Trends (2026)
Distribution of Listings by Guest Capacity
Guest Capacity Insights for Forest Glen
- The most common guest capacity trend in Forest Glen vacation rentals is listings accommodating 2 guests (10.5%). This suggests the primary traveler segment is likely couples or solo travelers.
- Properties designed for 2 guests and 4 guests dominate the Forest Glen STR market, accounting for 15.8% of listings.
- 10.6% of properties accommodate 6+ guests, serving the market segment for larger families or group travel in Forest Glen.
- On average, properties in Forest Glen are equipped to host 1.2 guests.
Forest Glen Airbnb Booking Patterns (2026): Available vs. Booked Days
Available Days Distribution
Booked Days Distribution
Booking Pattern Insights for Forest Glen
- The most common availability pattern in Forest Glen falls within the 271-366 days range, representing 63.2% of listings. This suggests many properties have significant open periods on their calendars.
- Approximately 89.5% of listings show high availability (181+ days open annually), indicating potential for increased bookings or specific owner usage patterns.
- For booked days, the 91-180 days range is most frequent in Forest Glen (36.8%), reflecting common guest stay durations or potential owner blocking patterns.
- A notable 10.5% of properties secure long booking periods (181+ days booked per year), highlighting successful long-term rental strategies or significant owner usage.
Forest Glen Airbnb Minimum Stay Requirements Analysis
Distribution of Listings by Minimum Night Requirement
1 Night
5 listings
26.3% of total
4-6 Nights
1 listings
5.3% of total
7-29 Nights
11 listings
57.9% of total
30+ Nights
2 listings
10.5% of total
Key Insights
- The most prevalent minimum stay requirement in Forest Glen is 7-29 Nights, adopted by 57.9% of listings. This highlights the market's preference for shorter, flexible bookings.
- A significant segment (10.5%) caters to monthly stays (30+ nights) in Forest Glen, pointing to opportunities in the extended-stay market.
Recommendations
- Align with the market by considering a 7-29 Nights minimum stay, as 57.9% of Forest Glen hosts use this setting.
- If feasible, allowing 1-night stays, especially midweek or during low season, could capture last-minute bookings, as only 26.3% currently do.
- Explore offering discounts for stays of 30+ nights to attract the 10.5% of the market seeking extended stays.
- Adjust minimum nights based on seasonality – potentially shorter during low season and longer during peak demand periods in Forest Glen.
Forest Glen Airbnb Cancellation Policy Trends Analysis (2026)
Flexible
5 listings
26.3% of total
Moderate
2 listings
10.5% of total
Firm
1 listings
5.3% of total
Strict
11 listings
57.9% of total
Cancellation Policy Insights for Forest Glen
- The prevailing Airbnb cancellation policy trend in Forest Glen is Strict, used by 57.9% of listings.
- A majority (63.2%) of hosts in Forest Glen utilize Firm or Strict policies, indicating a market where hosts prioritize booking security.
Recommendations for Hosts
- Consider adopting a Strict policy to align with the 57.9% market standard in Forest Glen.
- With 57.9% using Strict terms, this is a viable option in Forest Glen, particularly for high-value properties or during peak demand periods.
- Regularly review your cancellation policy against competitors and market demand shifts in Forest Glen.
Forest Glen STR Booking Lead Time Analysis (2026)
Average Booking Lead Time by Month
Booking Lead Time Insights for Forest Glen
- The overall average booking lead time for vacation rentals in Forest Glen is 12 days.
- Guests book furthest in advance for stays during July (average 56 days), likely coinciding with peak travel demand or local events.
- The shortest booking windows occur for stays in January (average 6 days), indicating more last-minute travel plans during this time.
- Seasonally, Spring (33 days avg.) sees the longest lead times, while Winter (24 days avg.) has the shortest, reflecting typical travel planning cycles.
Recommendations for Hosts
- Use the overall average lead time (12 days) as a baseline for your pricing and availability strategy in Forest Glen.
- For July stays, consider implementing length-of-stay discounts or slightly higher rates for bookings made less than 56 days out to capitalize on advance planning.
- Target marketing efforts for the Spring season well in advance (at least 33 days) to capture early planners.
- Monitor your own booking lead times against these Forest Glen averages to identify opportunities for dynamic pricing adjustments.
Popular & Essential Airbnb Amenities in Forest Glen (2026)
Amenity Prevalence
Amenity Insights for Forest Glen
- Essential amenities in Forest Glen that guests expect include: Hot water, Wifi, Microwave, Air conditioning, Dishes and silverware, Heating, Essentials, Refrigerator. Lacking these (any) could significantly impact bookings.
- Popular amenities like Cooking basics, Hangers are common but not universal. Offering these can provide a competitive edge.
Recommendations for Hosts
- Ensure your listing includes all essential amenities for Forest Glen: Hot water, Wifi, Microwave, Air conditioning, Dishes and silverware, Heating, Essentials, Refrigerator.
- Consider adding popular differentiators like Cooking basics or Hangers to increase appeal.
- Highlight unique or less common amenities you offer (e.g., hot tub, dedicated workspace, EV charger) in your listing description and photos.
- Regularly check competitor amenities in Forest Glen to stay competitive.
Forest Glen Airbnb Guest Demographics & Profile Analysis (2026)
Guest Profile Summary for Forest Glen
- The typical guest profile for Airbnb in Forest Glen consists of primarily domestic travelers (84%), often arriving from nearby Silver Spring, typically belonging to the Post-2000s (Gen Z/Alpha) group (50%), primarily speaking English or Spanish.
- Domestic travelers account for 84.0% of guests.
- Key international markets include United States (84%) and United Kingdom (4%).
- Top languages spoken are English (63.9%) followed by Spanish (13.9%).
- A significant demographic segment is the Post-2000s (Gen Z/Alpha) group, representing 50% of guests.
Recommendations for Hosts
- Target domestic marketing efforts towards travelers from Silver Spring and New York.
- Tailor amenities and listing descriptions to appeal to the dominant Post-2000s (Gen Z/Alpha) demographic (e.g., highlight fast WiFi, smart home features, local guides).
- Highlight unique local experiences or amenities relevant to the primary guest profile.
- Consider seasonal promotions aligned with peak travel times for key origin markets.
Nearby Short-Term Rental Market Comparison
How does the Forest Glen Airbnb market stack up against its neighbors? Compare key performance metrics like average monthly revenue, ADR, and occupancy rates in surrounding areas to understand the broader regional STR landscape.
| Market | Active Properties | Monthly Revenue | Daily Rate | Avg. Occupancy |
|---|---|---|---|---|
| Polk Township | 15 | $6,974 | $520.26 | 38% |
| Lemont | 21 | $6,940 | $873.93 | 37% |
| College Township | 83 | $6,551 | $848.63 | 36% |
| Centreville | 17 | $6,298 | $565.66 | 45% |
| McGaheysville | 83 | $6,156 | $431.72 | 45% |
| State College | 192 | $6,081 | $712.29 | 40% |
| Mayo | 13 | $5,915 | $447.58 | 51% |
| Shannondale | 45 | $5,808 | $337.30 | 54% |
| Hellam Township | 24 | $5,496 | $386.69 | 45% |
| Stevensville | 80 | $5,412 | $556.79 | 41% |