Duxbury Airbnb Market Analysis 2026: Short Term Rental Data & Vacation Rental Statistics in Massachusetts, United States
Is Airbnb profitable in Duxbury in 2026? Explore comprehensive Airbnb analytics for Duxbury, Massachusetts, United States to uncover income potential. This 2026 STR market report for Duxbury, based on AirROI data from January 2025 to December 2025, reveals key trends in the niche market of 19 active listings.
Whether you're considering an Airbnb investment in Duxbury, optimizing your existing vacation rental, or exploring rental arbitrage opportunities, understanding the Duxbury Airbnb data is crucial. Leveraging the low regulation environment is key to maximizing your short term rental income potential. Let's dive into the specifics.
Key Duxbury Airbnb Performance Metrics Overview
Monthly Airbnb Revenue Variations & Income Potential in Duxbury (2026)
Understanding the monthly revenue variations for Airbnb listings in Duxbury is key to maximizing your short term rental income potential. Seasonality significantly impacts earnings. Our analysis, based on data from the past 12 months, shows that the peak revenue month for STRs in Duxbury is typically July, while February often presents the lowest earnings, highlighting opportunities for strategic pricing adjustments during shoulder and low seasons. Explore the typical Airbnb income in Duxbury across different performance tiers:
- Best-in-class properties (Top 10%) achieve $12,463+ monthly, often utilizing dynamic pricing and superior guest experiences.
- Strong performing properties (Top 25%) earn $8,972 or more, indicating effective management and desirable locations/amenities.
- Typical properties (Median) generate around $5,130 per month, representing the average market performance.
- Entry-level properties (Bottom 25%) see earnings around $3,332, often with potential for optimization.
Average Monthly Airbnb Earnings Trend in Duxbury
Duxbury Airbnb Occupancy Rate Trends (2026)
Maximize your bookings by understanding the Duxbury STR occupancy trends. Seasonal demand shifts significantly influence how often properties are booked. Typically, Julysees the highest demand (peak season occupancy), while February experiences the lowest (low season). Effective strategies, like adjusting minimum stays or offering promotions, can boost occupancy during slower periods. Here's how different property tiers perform in Duxbury:
- Best-in-class properties (Top 10%) achieve 72%+ occupancy, indicating high desirability and potentially optimized availability.
- Strong performing properties (Top 25%) maintain 61% or higher occupancy, suggesting good market fit and guest satisfaction.
- Typical properties (Median) have an occupancy rate around 44%.
- Entry-level properties (Bottom 25%) average 29% occupancy, potentially facing higher vacancy.
Average Monthly Occupancy Rate Trend in Duxbury
Average Daily Rate (ADR) Airbnb Trends in Duxbury (2026)
Effective short term rental pricing strategy in Duxbury involves understanding monthly ADR fluctuations. The Average Daily Rate (ADR) for Airbnb in Duxbury typically peaks in July and dips lowest during March. Leveraging Airbnb dynamic pricing tools or strategies based on this seasonality can significantly boost revenue. Here's a look at the typical nightly rates achieved:
- Best-in-class properties (Top 10%) command rates of $728+ per night, often due to premium features or locations.
- Strong performing properties (Top 25%) achieve nightly rates of $539 or more.
- Typical properties (Median) charge around $383 per night.
- Entry-level properties (Bottom 25%) earn around $274 per night.
Average Daily Rate (ADR) Trend by Month in Duxbury
Get Live Duxbury Market Intelligence 👇

Explore Real-time Analytics
Airbnb Seasonality Analysis & Trends in Duxbury (2025)
Peak Season (July, August, June)
- Revenue averages $14,376 per month
- Occupancy rates average 67.3%
- Daily rates average $565
Shoulder Season
- Revenue averages $5,799 per month
- Occupancy maintains around 45.5%
- Daily rates hold near $477
Low Season (January, February, March)
- Revenue drops to average $2,657 per month
- Occupancy decreases to average 24.4%
- Daily rates adjust to average $425
Seasonality Insights for Duxbury
- The Airbnb seasonality in Duxbury shows highly seasonal trends requiring careful strategy. While the sections above show seasonal averages, it's also insightful to look at the extremes:
- During the high season, the absolute peak month showcases Duxbury's highest earning potential, with monthly revenues capable of climbing to $18,292, occupancy reaching a high of 78.8%, and ADRs peaking at $572.
- Conversely, the slowest single month of the year, typically falling within the low season, marks the market's lowest point. In this month, revenue might dip to $1,905, occupancy could drop to 21.1%, and ADRs may adjust down to $411.
- Understanding both the seasonal averages and these monthly peaks and troughs in revenue, occupancy, and ADR is crucial for maximizing your Airbnb profit potential in Duxbury.
Seasonal Strategies for Maximizing Profit
- Peak Season: Maximize revenue through premium pricing and potentially longer minimum stays. Ensure high availability.
- Low Season: Offer competitive pricing, special promotions (e.g., extended stay discounts), and flexible cancellation policies. Target off-season travelers like remote workers or budget-conscious guests.
- Shoulder Seasons: Implement dynamic pricing that balances peak and low rates. Target weekend travelers or specific events. Offer slightly more flexible terms than peak season.
- Regularly analyze your own performance against these Duxbury seasonality benchmarks and adjust your pricing and availability strategy accordingly.
Best Areas for Airbnb Investment in Duxbury (2026)
Exploring the top neighborhoods for short-term rentals in Duxbury? This section highlights key areas, outlining why they are attractive for hosts and guests, along with notable local attractions. Consider these locations based on your target guest profile and investment strategy.
| Neighborhood / Area | Why Host Here? (Target Guests & Appeal) | Key Attractions & Landmarks |
|---|---|---|
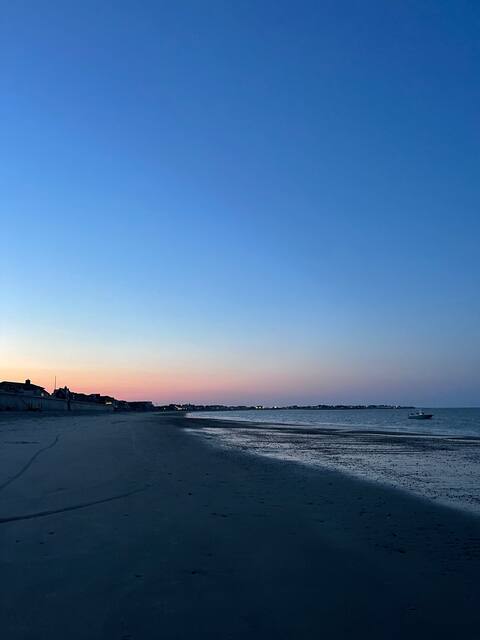
| Duxbury Beach | A picturesque beach area with beautiful sandy shores, ideal for family vacations and summer getaways. Offers access to various water activities and stunning ocean views. | Duxbury Beach Park, Duxbury Village, Mayflower Beach, Duxbury Bay, Waterfront Dining Areas |
| Downtown Duxbury | Historic center with charming shops, restaurants, and a vibrant community atmosphere. Attracts visitors looking for a quaint New England experience. | Duxbury Free Library, The Art Complex Museum, Duxbury Town Green, Local Cafés and Shops, Cultural Events |
| The Powder Point Bridge | Iconic bridge providing scenic views, connecting to beautiful beaches and parks. Great for those who want a relaxing coastal experience. | Powder Point Bridge, Duxbury Beach, Surfers' Beach, Nature Trails, Historic Landmarks |
| Duxbury Bay | Ideal for boating and sailing enthusiasts, offering beautiful views and sunsets. Popular for water sports and outdoor activities. | Duxbury Bay Maritime School, Boat Rentals, Sailing Lessons, Duxbury Yacht Club, Scenic Kayaking |
| Kingston Bay | A serene bay area perfect for those seeking peace and relaxation. Great for nature lovers and outdoor activities like fishing and kayaking. | Kingston Bay Nature Trails, Fishing Spots, Kayak Launch Sites, Bird Watching Areas, Waterfront Parks |
| Long Beach | A quiet beachside neighborhood known for its natural beauty and peaceful environment. Attracts visitors seeking a tranquil retreat. | Long Beach, Scenic Walks and Trails, Family-Friendly Beaches, Quiet Picnic Areas, Nature Observations |
| Duxbury Rural and Historical Society | A cultural destination that showcases Duxbury's rich history and rural charm. Great for educational tours and community events. | Historic Sites, Nature Trails, Community Events, Cultural Exhibits, Educational Workshops |
| Nearby Marshfield | Close proximity to Duxbury, offering additional dining and shopping options. Attracts visitors looking for a mix of beach and suburban experiences. | Marshfield Town Beaches, Local Festivals, Shopping Centers, Restaurants, Marshfield Hills |
Understanding Airbnb License Requirements & STR Laws in Duxbury (2026)
While Duxbury, Massachusetts, United States currently shows low STR regulations, specific Airbnb license requirements might still exist or change. Always verify the latest short term rental regulations and Airbnb license requirements directly with local government authorities for Duxbury to ensure full compliance before hosting.
(Source: AirROI data, 2026, finding no licensed listings among those analyzed)
Top Performing Airbnb Properties in Duxbury (2026)
Benchmark your potential! Explore examples of top-performing Airbnb properties in Duxburybased on Trailing Twelve Month (TTM) revenue. Analyze their characteristics, revenue, occupancy rate, and ADR to understand what drives success in this market.

Gorgeous home steps from private beach.
Entire Place • 5 bedrooms

Tide-Swept - One Of A Kind Ocean Front Home
Entire Place • 3 bedrooms

Welcome to Windansea. Duxbury Beach Vacation Home
Entire Place • 4 bedrooms
Powder Point Bay View Escape
Entire Place • 4 bedrooms

Cozy Apt in Snug Harbor Duxbury
Entire Place • 2 bedrooms

Newly Remodeled Home, Short Walk to Duxbury Beach!
Entire Place • 4 bedrooms
Note: Performance varies based on location, size, amenities, seasonality, and management quality. Data reflects the past 12 months.
Top Performing Airbnb Hosts in Duxbury (2026)
Learn from the best! This table showcases top-performing Airbnb hosts in Duxbury based on the number of properties managed and estimated total revenue over the past year. Analyze their scale and performance metrics.
| Host Name | Properties | Grossing Revenue | Stay Reviews | Avg Rating |
|---|---|---|---|---|
| Elaine | 1 | $213,164 | 24 | 4.96/5.0 |
| Ken | 1 | $135,106 | 89 | 5.00/5.0 |
| Stacey | 2 | $120,814 | 13 | 4.75/5.0 |
| Harry | 1 | $106,629 | 81 | 4.99/5.0 |
| Rick | 1 | $62,445 | 62 | 4.95/5.0 |
| Kelly | 1 | $62,143 | 16 | 4.94/5.0 |
| Ashley | 1 | $61,205 | 79 | 4.99/5.0 |
| Elizabeth | 1 | $53,311 | 9 | 5.00/5.0 |
| Ed | 1 | $46,554 | 41 | 4.83/5.0 |
| John | 1 | $44,284 | 108 | 4.85/5.0 |
Analyzing the strategies of top hosts, such as their property selection, pricing, and guest communication, can offer valuable lessons for optimizing your own Airbnb operations in Duxbury.
Dive Deeper: Advanced Duxbury STR Market Data (2026)
Ready to unlock more insights? AirROI provides access to advanced metrics and comprehensive Airbnb data for Duxbury. Explore detailed analytics beyond this report to refine your investment strategy, optimize pricing, and maximize your vacation rental profits.
Explore Advanced MetricsDuxbury Short-Term Rental Market Composition (2026): Property & Room Types
Room Type Distribution
Property Type Distribution
Market Composition Insights for Duxbury
- The Duxbury Airbnb market composition is heavily skewed towards Entire Home/Apt listings, which make up 100% of the 19 active rentals. This indicates strong guest preference for privacy and space.
- Looking at the property type distribution in Duxbury, House properties are the most common (73.7%), reflecting the local real estate landscape.
- Houses represent a significant 73.7% portion, catering likely to families or larger groups.
- The presence of 10.5% Hotel/Boutique listings indicates integration with traditional hospitality.
Duxbury Airbnb Room Capacity Analysis (2026): Bedroom Distribution
Distribution of Listings by Number of Bedrooms
Room Capacity Insights for Duxbury
- The dominant room capacity in Duxbury is 4 bedrooms listings, making up 36.8% of the market. This suggests a strong demand for properties suitable for families or small groups.
- Together, 4 bedrooms and 2 bedrooms properties represent 63.1% of the active Airbnb listings in Duxbury, indicating a high concentration in these sizes.
- A significant 57.9% of listings offer 3+ bedrooms, catering to larger groups and families seeking more space in Duxbury.
Duxbury Vacation Rental Guest Capacity Trends (2026)
Distribution of Listings by Guest Capacity
Guest Capacity Insights for Duxbury
- The most common guest capacity trend in Duxbury vacation rentals is listings accommodating 8+ guests (36.8%). This suggests the primary traveler segment is likely larger groups.
- Properties designed for 8+ guests and 4 guests dominate the Duxbury STR market, accounting for 63.1% of listings.
- 47.4% of properties accommodate 6+ guests, serving the market segment for larger families or group travel in Duxbury.
- On average, properties in Duxbury are equipped to host 5.7 guests.
Duxbury Airbnb Booking Patterns (2026): Available vs. Booked Days
Available Days Distribution
Booked Days Distribution
Booking Pattern Insights for Duxbury
- The most common availability pattern in Duxbury falls within the 271-366 days range, representing 47.4% of listings. This suggests many properties have significant open periods on their calendars.
- Approximately 79.0% of listings show high availability (181+ days open annually), indicating potential for increased bookings or specific owner usage patterns.
- For booked days, the 31-90 days range is most frequent in Duxbury (31.6%), reflecting common guest stay durations or potential owner blocking patterns.
- A notable 21.1% of properties secure long booking periods (181+ days booked per year), highlighting successful long-term rental strategies or significant owner usage.
Duxbury Airbnb Minimum Stay Requirements Analysis
Distribution of Listings by Minimum Night Requirement
1 Night
4 listings
21.1% of total
2 Nights
1 listings
5.3% of total
3 Nights
2 listings
10.5% of total
4-6 Nights
1 listings
5.3% of total
7-29 Nights
5 listings
26.3% of total
30+ Nights
6 listings
31.6% of total
Key Insights
- The most prevalent minimum stay requirement in Duxbury is 30+ Nights, adopted by 31.6% of listings. This highlights the market's preference for longer commitments.
- A significant segment (31.6%) caters to monthly stays (30+ nights) in Duxbury, pointing to opportunities in the extended-stay market.
Recommendations
- Align with the market by considering a 30+ Nights minimum stay, as 31.6% of Duxbury hosts use this setting.
- If feasible, allowing 1-night stays, especially midweek or during low season, could capture last-minute bookings, as only 21.1% currently do.
- Explore offering discounts for stays of 30+ nights to attract the 31.6% of the market seeking extended stays.
- Adjust minimum nights based on seasonality – potentially shorter during low season and longer during peak demand periods in Duxbury.
Duxbury Airbnb Cancellation Policy Trends Analysis (2026)
Flexible
3 listings
15.8% of total
Moderate
4 listings
21.1% of total
Firm
8 listings
42.1% of total
Strict
4 listings
21.1% of total
Cancellation Policy Insights for Duxbury
- The prevailing Airbnb cancellation policy trend in Duxbury is Firm, used by 42.1% of listings.
- A majority (63.2%) of hosts in Duxbury utilize Firm or Strict policies, indicating a market where hosts prioritize booking security.
Recommendations for Hosts
- Consider adopting a Firm policy to align with the 42.1% market standard in Duxbury.
- Regularly review your cancellation policy against competitors and market demand shifts in Duxbury.
Duxbury STR Booking Lead Time Analysis (2026)
Average Booking Lead Time by Month
Booking Lead Time Insights for Duxbury
- The overall average booking lead time for vacation rentals in Duxbury is 63 days.
- Guests book furthest in advance for stays during August (average 128 days), likely coinciding with peak travel demand or local events.
- The shortest booking windows occur for stays in February (average 9 days), indicating more last-minute travel plans during this time.
- Seasonally, Summer (122 days avg.) sees the longest lead times, while Winter (32 days avg.) has the shortest, reflecting typical travel planning cycles.
Recommendations for Hosts
- Use the overall average lead time (63 days) as a baseline for your pricing and availability strategy in Duxbury.
- For August stays, consider implementing length-of-stay discounts or slightly higher rates for bookings made less than 128 days out to capitalize on advance planning.
- During February, focus on last-minute booking availability and promotions, as guests book with very short notice (9 days avg.).
- Target marketing efforts for the Summer season well in advance (at least 122 days) to capture early planners.
- Monitor your own booking lead times against these Duxbury averages to identify opportunities for dynamic pricing adjustments.
Popular & Essential Airbnb Amenities in Duxbury (2026)
Amenity Prevalence
No amenities with partial availability (less than 100%) were found to display in the chart. All essential amenities might be present in all listings. Check insights below.
Amenity Insights for Duxbury
- Essential amenities in Duxbury that guests expect include: Hot water, Smoke alarm, Carbon monoxide alarm, Free parking on premises, Hangers, TV, Dishes and silverware, Heating, Air conditioning, Wifi. Lacking these (any) could significantly impact bookings.
Recommendations for Hosts
- Ensure your listing includes all essential amenities for Duxbury: Hot water, Smoke alarm, Carbon monoxide alarm, Free parking on premises, Hangers, TV, Dishes and silverware, Heating, Air conditioning, Wifi.
- Highlight unique or less common amenities you offer (e.g., hot tub, dedicated workspace, EV charger) in your listing description and photos.
- Regularly check competitor amenities in Duxbury to stay competitive.
Duxbury Airbnb Guest Demographics & Profile Analysis (2026)
Guest Profile Summary for Duxbury
- The typical guest profile for Airbnb in Duxbury consists of primarily domestic travelers (98%), often arriving from nearby Boston, typically belonging to the Post-2000s (Gen Z/Alpha) group (50%), primarily speaking English or French.
- Domestic travelers account for 97.5% of guests.
- Key international markets include United States (97.5%) and Switzerland (1.3%).
- Top languages spoken are English (56%) followed by French (24%).
- A significant demographic segment is the Post-2000s (Gen Z/Alpha) group, representing 50% of guests.
Recommendations for Hosts
- Target domestic marketing efforts towards travelers from Boston and San Francisco.
- Tailor amenities and listing descriptions to appeal to the dominant Post-2000s (Gen Z/Alpha) demographic (e.g., highlight fast WiFi, smart home features, local guides).
- Highlight unique local experiences or amenities relevant to the primary guest profile.
- Consider seasonal promotions aligned with peak travel times for key origin markets.
Nearby Short-Term Rental Market Comparison
How does the Duxbury Airbnb market stack up against its neighbors? Compare key performance metrics like average monthly revenue, ADR, and occupancy rates in surrounding areas to understand the broader regional STR landscape.
| Market | Active Properties | Monthly Revenue | Daily Rate | Avg. Occupancy |
|---|---|---|---|---|
| Nantucket | 550 | $7,707 | $1048.74 | 41% |
| North Andover | 12 | $5,789 | $446.83 | 45% |
| Goffstown | 12 | $5,728 | $363.08 | 54% |
| Middletown | 406 | $5,720 | $581.23 | 45% |
| Nahant | 13 | $5,590 | $599.46 | 42% |
| New Shoreham | 118 | $5,476 | $643.13 | 45% |
| Wellesley | 21 | $5,410 | $541.29 | 51% |
| South Berwick | 12 | $5,387 | $229.95 | 58% |
| Edgartown | 252 | $5,380 | $833.22 | 40% |
| Kennebunkport | 149 | $5,219 | $667.76 | 42% |