Sandwich Airbnb Market Analysis 2026: Short Term Rental Data & Vacation Rental Statistics in Massachusetts, United States
Is Airbnb profitable in Sandwich in 2026? Explore comprehensive Airbnb analytics for Sandwich, Massachusetts, United States to uncover income potential. This 2026 STR market report for Sandwich, based on AirROI data from February 2025 to January 2026, reveals key trends in the market of 273 active listings.
Whether you're considering an Airbnb investment in Sandwich, optimizing your existing vacation rental, or exploring rental arbitrage opportunities, understanding the Sandwich Airbnb data is crucial. Leveraging the low regulation environment is key to maximizing your short term rental income potential. Let's dive into the specifics.
Key Sandwich Airbnb Performance Metrics Overview
Monthly Airbnb Revenue Variations & Income Potential in Sandwich (2026)
Understanding the monthly revenue variations for Airbnb listings in Sandwich is key to maximizing your short term rental income potential. Seasonality significantly impacts earnings. Our analysis, based on data from the past 12 months, shows that the peak revenue month for STRs in Sandwich is typically July, while January often presents the lowest earnings, highlighting opportunities for strategic pricing adjustments during shoulder and low seasons. Explore the typical Airbnb income in Sandwich across different performance tiers:
- Best-in-class properties (Top 10%) achieve $11,806+ monthly, often utilizing dynamic pricing and superior guest experiences.
- Strong performing properties (Top 25%) earn $6,715 or more, indicating effective management and desirable locations/amenities.
- Typical properties (Median) generate around $3,709 per month, representing the average market performance.
- Entry-level properties (Bottom 25%) see earnings around $1,723, often with potential for optimization.
Average Monthly Airbnb Earnings Trend in Sandwich
Sandwich Airbnb Occupancy Rate Trends (2026)
Maximize your bookings by understanding the Sandwich STR occupancy trends. Seasonal demand shifts significantly influence how often properties are booked. Typically, Julysees the highest demand (peak season occupancy), while January experiences the lowest (low season). Effective strategies, like adjusting minimum stays or offering promotions, can boost occupancy during slower periods. Here's how different property tiers perform in Sandwich:
- Best-in-class properties (Top 10%) achieve 73%+ occupancy, indicating high desirability and potentially optimized availability.
- Strong performing properties (Top 25%) maintain 56% or higher occupancy, suggesting good market fit and guest satisfaction.
- Typical properties (Median) have an occupancy rate around 34%.
- Entry-level properties (Bottom 25%) average 17% occupancy, potentially facing higher vacancy.
Average Monthly Occupancy Rate Trend in Sandwich
Average Daily Rate (ADR) Airbnb Trends in Sandwich (2026)
Effective short term rental pricing strategy in Sandwich involves understanding monthly ADR fluctuations. The Average Daily Rate (ADR) for Airbnb in Sandwich typically peaks in July and dips lowest during March. Leveraging Airbnb dynamic pricing tools or strategies based on this seasonality can significantly boost revenue. Here's a look at the typical nightly rates achieved:
- Best-in-class properties (Top 10%) command rates of $697+ per night, often due to premium features or locations.
- Strong performing properties (Top 25%) achieve nightly rates of $468 or more.
- Typical properties (Median) charge around $339 per night.
- Entry-level properties (Bottom 25%) earn around $243 per night.
Average Daily Rate (ADR) Trend by Month in Sandwich
Get Live Sandwich Market Intelligence 👇

Explore Real-time Analytics
Airbnb Seasonality Analysis & Trends in Sandwich (2026)
Peak Season (July, August, June)
- Revenue averages $9,165 per month
- Occupancy rates average 55.3%
- Daily rates average $448
Shoulder Season
- Revenue averages $4,452 per month
- Occupancy maintains around 34.0%
- Daily rates hold near $404
Low Season (January, February, March)
- Revenue drops to average $2,815 per month
- Occupancy decreases to average 28.1%
- Daily rates adjust to average $380
Seasonality Insights for Sandwich
- The Airbnb seasonality in Sandwich shows highly seasonal trends requiring careful strategy. While the sections above show seasonal averages, it's also insightful to look at the extremes:
- During the high season, the absolute peak month showcases Sandwich's highest earning potential, with monthly revenues capable of climbing to $10,698, occupancy reaching a high of 63.4%, and ADRs peaking at $456.
- Conversely, the slowest single month of the year, typically falling within the low season, marks the market's lowest point. In this month, revenue might dip to $2,707, occupancy could drop to 22.3%, and ADRs may adjust down to $366.
- Understanding both the seasonal averages and these monthly peaks and troughs in revenue, occupancy, and ADR is crucial for maximizing your Airbnb profit potential in Sandwich.
Seasonal Strategies for Maximizing Profit
- Peak Season: Maximize revenue through premium pricing and potentially longer minimum stays. Ensure high availability.
- Low Season: Offer competitive pricing, special promotions (e.g., extended stay discounts), and flexible cancellation policies. Target off-season travelers like remote workers or budget-conscious guests.
- Shoulder Seasons: Implement dynamic pricing that balances peak and low rates. Target weekend travelers or specific events. Offer slightly more flexible terms than peak season.
- Regularly analyze your own performance against these Sandwich seasonality benchmarks and adjust your pricing and availability strategy accordingly.
Best Areas for Airbnb Investment in Sandwich (2026)
Exploring the top neighborhoods for short-term rentals in Sandwich? This section highlights key areas, outlining why they are attractive for hosts and guests, along with notable local attractions. Consider these locations based on your target guest profile and investment strategy.
| Neighborhood / Area | Why Host Here? (Target Guests & Appeal) | Key Attractions & Landmarks |
|---|---|---|
| Sandwich Village | Historic village atmosphere with quaint shops, dining, and close proximity to the Sandwich Boardwalk. Ideal for visitors looking for a charming New England experience. | Sandwich Glass Museum, Heritage Museums & Gardens, Sandwich Boardwalk, Old Town Hall, Sandwich Town Neck Beach |
| Sandwich Town Beach | Breathtaking beach views and great for families looking for a beach vacation. Offers easy access to swimming, sunbathing, and beach activities. | Town Neck Beach, Sandwich Marsh, Boardwalk Beach, Scusset Beach State Reservation, Cape Cod Canal |
| Bourne Bridge | Conveniently located for access to both Cape Cod and the mainland, making it a popular spot for travelers passing through or staying on Cape Cod. | Cape Cod Canal, Bourne Scenic Park, Nearby golf courses, Shopping and dining options, Historic site tours |
| East Sandwich | Serene coastal area with beautiful beaches and a laid-back vibe. Great for visitors looking to relax and enjoy nature during their stay. | East Sandwich Beach, Scusset Beach, Flax Pond, Hathaway's Pond, Nature trails |
| Sandwich Marina | Attracts boating enthusiasts and those looking for waterfront activities. Offers a unique experience for visitors interested in water sports and fishing. | Sandwich Marina, Fishing charters, Kayaking, Boat rentals, Sandwich Recreation Area |
| Forestdale | Quiet residential area that is close to town amenities and beaches, appealing to families and those preferring a more suburban experience. | Forestdale School, Local parks, Nearby shopping, Close to Sandwich Village, Nature trails |
| C Sandwich | Offers proximity to both Cape Cod and the historic sites of Sandwich. Attracts both history buffs and tourists looking to explore the area. | Historic Sandwich Village, Sandwich Glass Museum, Heritage Museums, Old Sandwich Town, Bridges and lighthouses |
| Pond Village | Charming neighborhood with a close-knit community feel, ideal for families and visitors looking to immerse themselves in the local culture. | Local markets, Community events, Scenic views of ponds, Walking trails, Cultural festivals |
Understanding Airbnb License Requirements & STR Laws in Sandwich (2026)
While Sandwich, Massachusetts, United States currently shows low STR regulations, specific Airbnb license requirements might still exist or change. Always verify the latest short term rental regulations and Airbnb license requirements directly with local government authorities for Sandwich to ensure full compliance before hosting.
(Source: AirROI data, 2026, based on 0% licensed listings)
Top Performing Airbnb Properties in Sandwich (2026)
Benchmark your potential! Explore examples of top-performing Airbnb properties in Sandwichbased on Trailing Twelve Month (TTM) revenue. Analyze their characteristics, revenue, occupancy rate, and ADR to understand what drives success in this market.
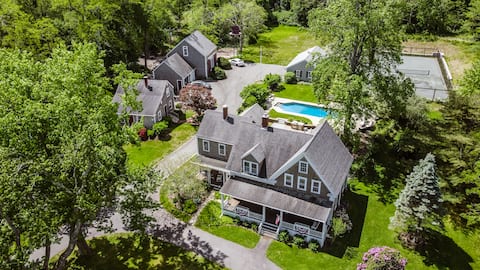
XL Estate: 2 Homes-Pool-Tennis-Game Barn - 20 ppl
Entire Place • 9 bedrooms
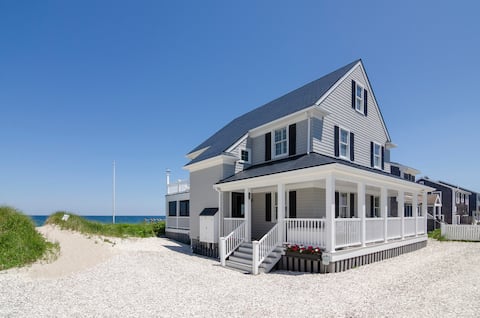
Salt Eire | Oceanfront Beach Home
Entire Place • 4 bedrooms
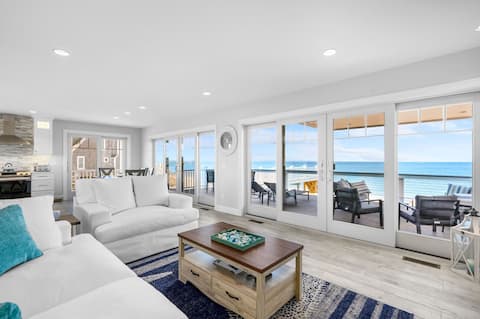
Oceanfront Cape Escape with Panoramic Bay Views
Entire Place • 4 bedrooms
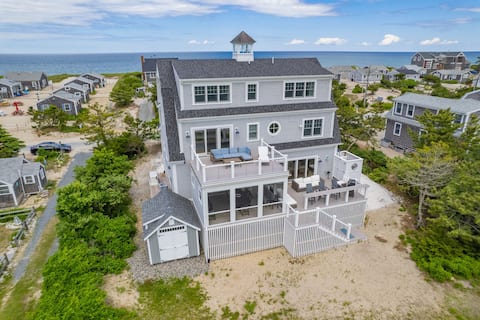
Waterfront home w/ Beach access
Entire Place • 5 bedrooms

Bold Oceanfront Cottage w/Pvt Beach ~ Lil Sea Sass
Entire Place • 3 bedrooms

Quintessential Waterfront Historic Cottage
Entire Place • 5 bedrooms
Note: Performance varies based on location, size, amenities, seasonality, and management quality. Data reflects the past 12 months.
Top Performing Airbnb Hosts in Sandwich (2026)
Learn from the best! This table showcases top-performing Airbnb hosts in Sandwich based on the number of properties managed and estimated total revenue over the past year. Analyze their scale and performance metrics.
| Host Name | Properties | Grossing Revenue | Stay Reviews | Avg Rating |
|---|---|---|---|---|
| New England Vacation Rentals | 36 | $1,142,234 | 116 | 4.59/5.0 |
| Sand Dollar Realty | 40 | $492,060 | 307 | 4.72/5.0 |
| Shannon | 2 | $445,178 | 201 | 5.00/5.0 |
| Joshua | 1 | $303,318 | 53 | 5.00/5.0 |
| Robert Paul Vacations | 2 | $249,307 | 5 | 4.75/5.0 |
| Susan | 1 | $188,976 | 432 | 4.86/5.0 |
| Stephenie Grace | 1 | $188,459 | 223 | 5.00/5.0 |
| Leslie | 1 | $176,495 | 9 | 4.89/5.0 |
| Carl | 3 | $174,992 | 598 | 4.87/5.0 |
| Maureen | 6 | $168,704 | 397 | 4.84/5.0 |
Analyzing the strategies of top hosts, such as their property selection, pricing, and guest communication, can offer valuable lessons for optimizing your own Airbnb operations in Sandwich.
Dive Deeper: Advanced Sandwich STR Market Data (2026)
Ready to unlock more insights? AirROI provides access to advanced metrics and comprehensive Airbnb data for Sandwich. Explore detailed analytics beyond this report to refine your investment strategy, optimize pricing, and maximize your vacation rental profits.
Explore Advanced MetricsSandwich Short-Term Rental Market Composition (2026): Property & Room Types
Room Type Distribution
Property Type Distribution
Market Composition Insights for Sandwich
- The Sandwich Airbnb market composition is heavily skewed towards Entire Home/Apt listings, which make up 89.4% of the 273 active rentals. This indicates strong guest preference for privacy and space.
- Looking at the property type distribution in Sandwich, House properties are the most common (79.9%), reflecting the local real estate landscape.
- Houses represent a significant 79.9% portion, catering likely to families or larger groups.
- The presence of 11% Hotel/Boutique listings indicates integration with traditional hospitality.
- Smaller segments like others, outdoor/unique (combined 3.3%) offer potential for unique stay experiences.
Sandwich Airbnb Room Capacity Analysis (2026): Bedroom Distribution
Distribution of Listings by Number of Bedrooms
Room Capacity Insights for Sandwich
- The dominant room capacity in Sandwich is 3 bedrooms listings, making up 33% of the market. This suggests a strong demand for properties suitable for families or small groups.
- Together, 3 bedrooms and 2 bedrooms properties represent 58.6% of the active Airbnb listings in Sandwich, indicating a high concentration in these sizes.
- A significant 55.4% of listings offer 3+ bedrooms, catering to larger groups and families seeking more space in Sandwich.
Sandwich Vacation Rental Guest Capacity Trends (2026)
Distribution of Listings by Guest Capacity
Guest Capacity Insights for Sandwich
- The most common guest capacity trend in Sandwich vacation rentals is listings accommodating 8+ guests (33%). This suggests the primary traveler segment is likely larger groups.
- Properties designed for 8+ guests and 6 guests dominate the Sandwich STR market, accounting for 55.7% of listings.
- 63.8% of properties accommodate 6+ guests, serving the market segment for larger families or group travel in Sandwich.
- On average, properties in Sandwich are equipped to host 5.8 guests.
Sandwich Airbnb Booking Patterns (2026): Available vs. Booked Days
Available Days Distribution
Booked Days Distribution
Booking Pattern Insights for Sandwich
- The most common availability pattern in Sandwich falls within the 271-366 days range, representing 65.9% of listings. This suggests many properties have significant open periods on their calendars.
- Approximately 91.5% of listings show high availability (181+ days open annually), indicating potential for increased bookings or specific owner usage patterns.
- For booked days, the 31-90 days range is most frequent in Sandwich (35.9%), reflecting common guest stay durations or potential owner blocking patterns.
- A notable 9.6% of properties secure long booking periods (181+ days booked per year), highlighting successful long-term rental strategies or significant owner usage.
Sandwich Airbnb Minimum Stay Requirements Analysis
Distribution of Listings by Minimum Night Requirement
1 Night
15 listings
5.5% of total
2 Nights
28 listings
10.3% of total
3 Nights
21 listings
7.7% of total
4-6 Nights
44 listings
16.1% of total
7-29 Nights
40 listings
14.7% of total
30+ Nights
125 listings
45.8% of total
Key Insights
- The most prevalent minimum stay requirement in Sandwich is 30+ Nights, adopted by 45.8% of listings. This highlights the market's preference for longer commitments.
- Very short stays (1-2 nights) are less common (15.8%), suggesting hosts prefer slightly longer bookings to optimize turnover.
- A significant segment (45.8%) caters to monthly stays (30+ nights) in Sandwich, pointing to opportunities in the extended-stay market.
Recommendations
- Align with the market by considering a 30+ Nights minimum stay, as 45.8% of Sandwich hosts use this setting.
- If feasible, allowing 1-night stays, especially midweek or during low season, could capture last-minute bookings, as only 5.5% currently do.
- Explore offering discounts for stays of 30+ nights to attract the 45.8% of the market seeking extended stays.
- Adjust minimum nights based on seasonality – potentially shorter during low season and longer during peak demand periods in Sandwich.
Sandwich Airbnb Cancellation Policy Trends Analysis (2026)
Super Strict 30 Days
59 listings
21.8% of total
Super Strict 60 Days
12 listings
4.4% of total
Limited
3 listings
1.1% of total
Flexible
15 listings
5.5% of total
Moderate
30 listings
11.1% of total
Firm
84 listings
31% of total
Strict
68 listings
25.1% of total
Cancellation Policy Insights for Sandwich
- The prevailing Airbnb cancellation policy trend in Sandwich is Firm, used by 31% of listings.
- A majority (56.1%) of hosts in Sandwich utilize Firm or Strict policies, indicating a market where hosts prioritize booking security.
Recommendations for Hosts
- Consider adopting a Firm policy to align with the 31% market standard in Sandwich.
- Regularly review your cancellation policy against competitors and market demand shifts in Sandwich.
Sandwich STR Booking Lead Time Analysis (2026)
Average Booking Lead Time by Month
Booking Lead Time Insights for Sandwich
- The overall average booking lead time for vacation rentals in Sandwich is 81 days.
- Guests book furthest in advance for stays during August (average 102 days), likely coinciding with peak travel demand or local events.
- The shortest booking windows occur for stays in February (average 22 days), indicating more last-minute travel plans during this time.
- Seasonally, Summer (96 days avg.) sees the longest lead times, while Winter (35 days avg.) has the shortest, reflecting typical travel planning cycles.
Recommendations for Hosts
- Use the overall average lead time (81 days) as a baseline for your pricing and availability strategy in Sandwich.
- For August stays, consider implementing length-of-stay discounts or slightly higher rates for bookings made less than 102 days out to capitalize on advance planning.
- Target marketing efforts for the Summer season well in advance (at least 96 days) to capture early planners.
- Monitor your own booking lead times against these Sandwich averages to identify opportunities for dynamic pricing adjustments.
Popular & Essential Airbnb Amenities in Sandwich (2026)
Amenity Prevalence
Amenity Insights for Sandwich
- Essential amenities in Sandwich that guests expect include: TV, Smoke alarm, Wifi, Air conditioning, Carbon monoxide alarm, Free parking on premises. Lacking these (any) could significantly impact bookings.
- Popular amenities like Heating, Kitchen, Refrigerator are common but not universal. Offering these can provide a competitive edge.
Recommendations for Hosts
- Ensure your listing includes all essential amenities for Sandwich: TV, Smoke alarm, Wifi, Air conditioning, Carbon monoxide alarm, Free parking on premises.
- Prioritize adding missing essentials: TV, Smoke alarm, Wifi, Air conditioning, Carbon monoxide alarm, Free parking on premises.
- Consider adding popular differentiators like Heating or Kitchen to increase appeal.
- Highlight unique or less common amenities you offer (e.g., hot tub, dedicated workspace, EV charger) in your listing description and photos.
- Regularly check competitor amenities in Sandwich to stay competitive.
Sandwich Airbnb Guest Demographics & Profile Analysis (2026)
Guest Profile Summary for Sandwich
- The typical guest profile for Airbnb in Sandwich consists of primarily domestic travelers (93%), often arriving from nearby Boston, typically belonging to the Post-2000s (Gen Z/Alpha) group (50%), primarily speaking English or Spanish.
- Domestic travelers account for 92.8% of guests.
- Key international markets include United States (92.8%) and United Kingdom (2.2%).
- Top languages spoken are English (70.5%) followed by Spanish (12%).
- A significant demographic segment is the Post-2000s (Gen Z/Alpha) group, representing 50% of guests.
Recommendations for Hosts
- Target domestic marketing efforts towards travelers from Boston and New York.
- Tailor amenities and listing descriptions to appeal to the dominant Post-2000s (Gen Z/Alpha) demographic (e.g., highlight fast WiFi, smart home features, local guides).
- Highlight unique local experiences or amenities relevant to the primary guest profile.
- Consider seasonal promotions aligned with peak travel times for key origin markets.
Nearby Short-Term Rental Market Comparison
How does the Sandwich Airbnb market stack up against its neighbors? Compare key performance metrics like average monthly revenue, ADR, and occupancy rates in surrounding areas to understand the broader regional STR landscape.
| Market | Active Properties | Monthly Revenue | Daily Rate | Avg. Occupancy |
|---|---|---|---|---|
| Nantucket | 539 | $7,748 | $1045.40 | 41% |
| Middletown | 395 | $5,781 | $589.01 | 45% |
| North Andover | 12 | $5,625 | $440.84 | 45% |
| Nahant | 13 | $5,564 | $602.44 | 42% |
| New Shoreham | 120 | $5,359 | $637.79 | 45% |
| Wellesley | 22 | $5,310 | $520.90 | 50% |
| Edgartown | 255 | $5,250 | $818.21 | 40% |
| Mattapoisett | 34 | $5,105 | $476.61 | 52% |
| Amherst | 10 | $5,003 | $366.01 | 44% |
| Chatham | 370 | $4,755 | $532.54 | 43% |