Silver Creek Township Airbnb Market Analysis 2026: Short Term Rental Data & Vacation Rental Statistics in Minnesota, United States
Is Airbnb profitable in Silver Creek Township in 2026? Explore comprehensive Airbnb analytics for Silver Creek Township, Minnesota, United States to uncover income potential. This 2026 STR market report for Silver Creek Township, based on AirROI data from February 2025 to January 2026, reveals key trends in the niche market of 19 active listings.
Whether you're considering an Airbnb investment in Silver Creek Township, optimizing your existing vacation rental, or exploring rental arbitrage opportunities, understanding the Silver Creek Township Airbnb data is crucial. Leveraging the low regulation environment is key to maximizing your short term rental income potential. Let's dive into the specifics.
Key Silver Creek Township Airbnb Performance Metrics Overview
Monthly Airbnb Revenue Variations & Income Potential in Silver Creek Township (2026)
Understanding the monthly revenue variations for Airbnb listings in Silver Creek Township is key to maximizing your short term rental income potential. Seasonality significantly impacts earnings. Our analysis, based on data from the past 12 months, shows that the peak revenue month for STRs in Silver Creek Township is typically August, while February often presents the lowest earnings, highlighting opportunities for strategic pricing adjustments during shoulder and low seasons. Explore the typical Airbnb income in Silver Creek Township across different performance tiers:
- Best-in-class properties (Top 10%) achieve $10,552+ monthly, often utilizing dynamic pricing and superior guest experiences.
- Strong performing properties (Top 25%) earn $8,032 or more, indicating effective management and desirable locations/amenities.
- Typical properties (Median) generate around $5,617 per month, representing the average market performance.
- Entry-level properties (Bottom 25%) see earnings around $3,849, often with potential for optimization.
Average Monthly Airbnb Earnings Trend in Silver Creek Township
Silver Creek Township Airbnb Occupancy Rate Trends (2026)
Maximize your bookings by understanding the Silver Creek Township STR occupancy trends. Seasonal demand shifts significantly influence how often properties are booked. Typically, Julysees the highest demand (peak season occupancy), while January experiences the lowest (low season). Effective strategies, like adjusting minimum stays or offering promotions, can boost occupancy during slower periods. Here's how different property tiers perform in Silver Creek Township:
- Best-in-class properties (Top 10%) achieve 78%+ occupancy, indicating high desirability and potentially optimized availability.
- Strong performing properties (Top 25%) maintain 68% or higher occupancy, suggesting good market fit and guest satisfaction.
- Typical properties (Median) have an occupancy rate around 54%.
- Entry-level properties (Bottom 25%) average 39% occupancy, potentially facing higher vacancy.
Average Monthly Occupancy Rate Trend in Silver Creek Township
Average Daily Rate (ADR) Airbnb Trends in Silver Creek Township (2026)
Effective short term rental pricing strategy in Silver Creek Township involves understanding monthly ADR fluctuations. The Average Daily Rate (ADR) for Airbnb in Silver Creek Township typically peaks in August and dips lowest during February. Leveraging Airbnb dynamic pricing tools or strategies based on this seasonality can significantly boost revenue. Here's a look at the typical nightly rates achieved:
- Best-in-class properties (Top 10%) command rates of $493+ per night, often due to premium features or locations.
- Strong performing properties (Top 25%) achieve nightly rates of $391 or more.
- Typical properties (Median) charge around $307 per night.
- Entry-level properties (Bottom 25%) earn around $253 per night.
Average Daily Rate (ADR) Trend by Month in Silver Creek Township
Get Live Silver Creek Township Market Intelligence 👇

Explore Real-time Analytics
Airbnb Seasonality Analysis & Trends in Silver Creek Township (2026)
Peak Season (August, July, October)
- Revenue averages $10,242 per month
- Occupancy rates average 76.5%
- Daily rates average $379
Shoulder Season
- Revenue averages $5,808 per month
- Occupancy maintains around 53.0%
- Daily rates hold near $336
Low Season (January, February, April)
- Revenue drops to average $3,013 per month
- Occupancy decreases to average 33.5%
- Daily rates adjust to average $294
Seasonality Insights for Silver Creek Township
- The Airbnb seasonality in Silver Creek Township shows highly seasonal trends requiring careful strategy. While the sections above show seasonal averages, it's also insightful to look at the extremes:
- During the high season, the absolute peak month showcases Silver Creek Township's highest earning potential, with monthly revenues capable of climbing to $11,599, occupancy reaching a high of 80.6%, and ADRs peaking at $395.
- Conversely, the slowest single month of the year, typically falling within the low season, marks the market's lowest point. In this month, revenue might dip to $2,853, occupancy could drop to 30.0%, and ADRs may adjust down to $268.
- Understanding both the seasonal averages and these monthly peaks and troughs in revenue, occupancy, and ADR is crucial for maximizing your Airbnb profit potential in Silver Creek Township.
Seasonal Strategies for Maximizing Profit
- Peak Season: Maximize revenue through premium pricing and potentially longer minimum stays. Ensure high availability.
- Low Season: Offer competitive pricing, special promotions (e.g., extended stay discounts), and flexible cancellation policies. Target off-season travelers like remote workers or budget-conscious guests.
- Shoulder Seasons: Implement dynamic pricing that balances peak and low rates. Target weekend travelers or specific events. Offer slightly more flexible terms than peak season.
- Regularly analyze your own performance against these Silver Creek Township seasonality benchmarks and adjust your pricing and availability strategy accordingly.
Best Areas for Airbnb Investment in Silver Creek Township (2026)
Exploring the top neighborhoods for short-term rentals in Silver Creek Township? This section highlights key areas, outlining why they are attractive for hosts and guests, along with notable local attractions. Consider these locations based on your target guest profile and investment strategy.
| Neighborhood / Area | Why Host Here? (Target Guests & Appeal) | Key Attractions & Landmarks |
|---|---|---|
| Valley Park | A tranquil area known for its scenic views and recreational opportunities. Great for families and outdoor enthusiasts looking for a peaceful getaway. | Silver Creek Park, Beaver Island Trail, Cedar Creek Park, Silver Lake, local dining options |
| Lake Sarah | A beautiful lakeside area perfect for water activities and summer vacations. Attracts visitors looking for a relaxing waterfront experience. | Lake Sarah beaches, boating and fishing, picnic areas, local nature trails, Sunset views |
| Silver Creek | The heart of Silver Creek Township known for its quaint charm and community-focused atmosphere. Ideal for travelers seeking a small-town experience. | local shops, community events, farmers market, scenic drives, heritage museums |
| Haven Woods | A serene wooded area providing a retreat for nature lovers. Offers unique staying options for those looking to disconnect and unwind. | trails for hiking, wildlife observation, local art installations, nature photography spots, peaceful picnic areas |
| Buffalo Lake | An area centered around Buffalo Lake, offering recreational activities and beautiful scenery for vacationers. | Buffalo Lake access, fishing spots, water sports, hiking trails, local parks |
| Maple Lake | A charming lakeside destination that draws visitors for weekend retreats and summer fun, popular among families. | Maple Lake beaches, swimming areas, campgrounds, picnic spots, boardwalks |
| Sandy Lake | Famed for its sandy shores and vibrant summer activities, attracting tourists and locals alike seeking fun and relaxation. | Sandy Lake beach, boating and kayaking, summer festivals, local diner, nature walks |
| St. Croix River | A picturesque river area with opportunities for adventure sports and romantic getaways, attracting a diverse range of visitors. | St. Croix river trails, fishing spots, kayaking, biking trails, scenic viewpoints |
Understanding Airbnb License Requirements & STR Laws in Silver Creek Township (2026)
While Silver Creek Township, Minnesota, United States currently shows low STR regulations, specific Airbnb license requirements might still exist or change. Always verify the latest short term rental regulations and Airbnb license requirements directly with local government authorities for Silver Creek Township to ensure full compliance before hosting.
(Source: AirROI data, 2026, finding no licensed listings among those analyzed)
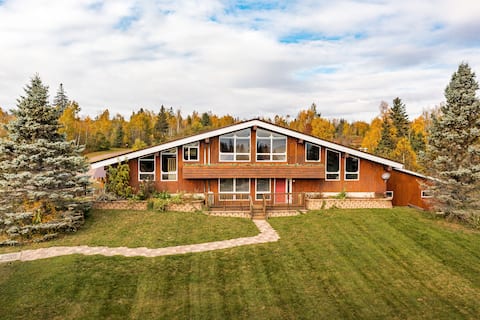
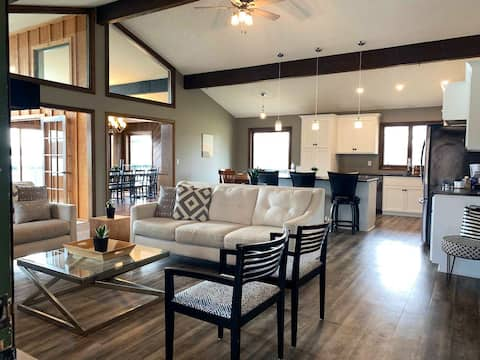
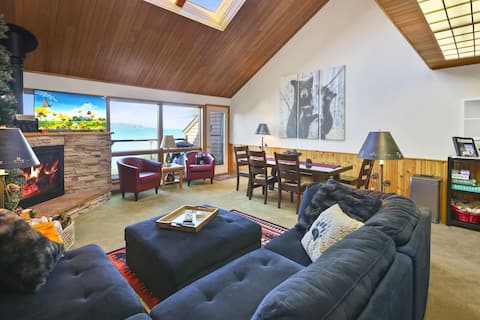
Top Performing Airbnb Properties in Silver Creek Township (2026)
Benchmark your potential! Explore examples of top-performing Airbnb properties in Silver Creek Townshipbased on Trailing Twelve Month (TTM) revenue. Analyze their characteristics, revenue, occupancy rate, and ADR to understand what drives success in this market.
Lakeview chalet by Gooseberry Falls with sauna
Entire Place • 4 bedrooms

Luxurious Home on Lake Superior | Fjordheim
Entire Place • 3 bedrooms

Spectacular Log Home on Majestic Lake Superior
Entire Place • 3 bedrooms
Spectacular Locke Lake Home in Monticello, MN!
Entire Place • 4 bedrooms
North Shore Nirvana: Lakefront, Deck, Fireplace
Entire Place • 3 bedrooms
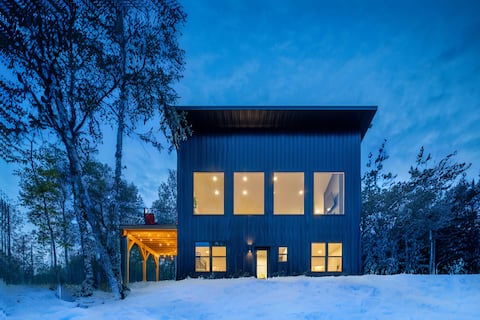
Winter Wonderland: Godegard Haus
Entire Place • 2 bedrooms
Note: Performance varies based on location, size, amenities, seasonality, and management quality. Data reflects the past 12 months.
Top Performing Airbnb Hosts in Silver Creek Township (2026)
Learn from the best! This table showcases top-performing Airbnb hosts in Silver Creek Township based on the number of properties managed and estimated total revenue over the past year. Analyze their scale and performance metrics.
| Host Name | Properties | Grossing Revenue | Stay Reviews | Avg Rating |
|---|---|---|---|---|
| Heirloom Vacations | 5 | $184,918 | 172 | 4.79/5.0 |
| Varsha | 1 | $121,302 | 778 | 4.91/5.0 |
| Tammy | 1 | $104,560 | 138 | 4.83/5.0 |
| Tina | 1 | $94,741 | 142 | 4.94/5.0 |
| Brian | 1 | $86,959 | 157 | 4.97/5.0 |
| Jenna | 1 | $71,386 | 33 | 5.00/5.0 |
| Rachel | 1 | $68,748 | 31 | 4.84/5.0 |
| Brenda June | 1 | $66,458 | 35 | 5.00/5.0 |
| Phil | 1 | $61,745 | 121 | 4.97/5.0 |
| Sharon Rita | 1 | $47,890 | 259 | 4.90/5.0 |
Analyzing the strategies of top hosts, such as their property selection, pricing, and guest communication, can offer valuable lessons for optimizing your own Airbnb operations in Silver Creek Township.
Dive Deeper: Advanced Silver Creek Township STR Market Data (2026)
Ready to unlock more insights? AirROI provides access to advanced metrics and comprehensive Airbnb data for Silver Creek Township. Explore detailed analytics beyond this report to refine your investment strategy, optimize pricing, and maximize your vacation rental profits.
Explore Advanced MetricsSilver Creek Township Short-Term Rental Market Composition (2026): Property & Room Types
Room Type Distribution
Property Type Distribution
Market Composition Insights for Silver Creek Township
- The Silver Creek Township Airbnb market composition is heavily skewed towards Entire Home/Apt listings, which make up 100% of the 19 active rentals. This indicates strong guest preference for privacy and space.
- Looking at the property type distribution in Silver Creek Township, House properties are the most common (42.1%), reflecting the local real estate landscape.
- Houses represent a significant 42.1% portion, catering likely to families or larger groups.
- The presence of 5.3% Hotel/Boutique listings indicates integration with traditional hospitality.
Silver Creek Township Airbnb Room Capacity Analysis (2026): Bedroom Distribution
Distribution of Listings by Number of Bedrooms
Room Capacity Insights for Silver Creek Township
- The dominant room capacity in Silver Creek Township is 2 bedrooms listings, making up 52.6% of the market. This suggests a strong demand for properties suitable for couples or solo travelers.
- Together, 2 bedrooms and 3 bedrooms properties represent 84.2% of the active Airbnb listings in Silver Creek Township, indicating a high concentration in these sizes.
- A significant 42.1% of listings offer 3+ bedrooms, catering to larger groups and families seeking more space in Silver Creek Township.
Silver Creek Township Vacation Rental Guest Capacity Trends (2026)
Distribution of Listings by Guest Capacity
Guest Capacity Insights for Silver Creek Township
- The most common guest capacity trend in Silver Creek Township vacation rentals is listings accommodating 6 guests (47.4%). This suggests the primary traveler segment is likely larger groups.
- Properties designed for 6 guests and 8+ guests dominate the Silver Creek Township STR market, accounting for 73.7% of listings.
- 73.7% of properties accommodate 6+ guests, serving the market segment for larger families or group travel in Silver Creek Township.
- On average, properties in Silver Creek Township are equipped to host 6.0 guests.
Silver Creek Township Airbnb Booking Patterns (2026): Available vs. Booked Days
Available Days Distribution
Booked Days Distribution
Booking Pattern Insights for Silver Creek Township
- The most common availability pattern in Silver Creek Township falls within the 91-180 days range, representing 36.8% of listings. This suggests many properties have significant open periods on their calendars.
- Approximately 57.9% of listings show high availability (181+ days open annually), indicating potential for increased bookings or specific owner usage patterns.
- For booked days, the 181-270 days range is most frequent in Silver Creek Township (36.8%), reflecting common guest stay durations or potential owner blocking patterns.
- A notable 42.1% of properties secure long booking periods (181+ days booked per year), highlighting successful long-term rental strategies or significant owner usage.
Silver Creek Township Airbnb Minimum Stay Requirements Analysis
Distribution of Listings by Minimum Night Requirement
1 Night
5 listings
26.3% of total
2 Nights
7 listings
36.8% of total
3 Nights
1 listings
5.3% of total
4-6 Nights
1 listings
5.3% of total
7-29 Nights
1 listings
5.3% of total
30+ Nights
4 listings
21.1% of total
Key Insights
- The most prevalent minimum stay requirement in Silver Creek Township is 2 Nights, adopted by 36.8% of listings. This highlights the market's preference for shorter, flexible bookings.
- A strong majority (63.1%) of the Silver Creek Township Airbnb data shows acceptance of very short stays (1-2 nights), indicating a dynamic, high-turnover market.
- A significant segment (21.1%) caters to monthly stays (30+ nights) in Silver Creek Township, pointing to opportunities in the extended-stay market.
Recommendations
- Align with the market by considering a 2 Nights minimum stay, as 36.8% of Silver Creek Township hosts use this setting.
- If feasible, allowing 1-night stays, especially midweek or during low season, could capture last-minute bookings, as only 26.3% currently do.
- Explore offering discounts for stays of 30+ nights to attract the 21.1% of the market seeking extended stays.
- Adjust minimum nights based on seasonality – potentially shorter during low season and longer during peak demand periods in Silver Creek Township.
Silver Creek Township Airbnb Cancellation Policy Trends Analysis (2026)
Limited
1 listings
5.3% of total
Flexible
4 listings
21.1% of total
Moderate
2 listings
10.5% of total
Firm
8 listings
42.1% of total
Strict
4 listings
21.1% of total
Cancellation Policy Insights for Silver Creek Township
- The prevailing Airbnb cancellation policy trend in Silver Creek Township is Firm, used by 42.1% of listings.
- A majority (63.2%) of hosts in Silver Creek Township utilize Firm or Strict policies, indicating a market where hosts prioritize booking security.
Recommendations for Hosts
- Consider adopting a Firm policy to align with the 42.1% market standard in Silver Creek Township.
- Regularly review your cancellation policy against competitors and market demand shifts in Silver Creek Township.
Silver Creek Township STR Booking Lead Time Analysis (2026)
Average Booking Lead Time by Month
Booking Lead Time Insights for Silver Creek Township
- The overall average booking lead time for vacation rentals in Silver Creek Township is 94 days.
- Guests book furthest in advance for stays during June (average 149 days), likely coinciding with peak travel demand or local events.
- The shortest booking windows occur for stays in January (average 32 days), indicating more last-minute travel plans during this time.
- Seasonally, Summer (130 days avg.) sees the longest lead times, while Winter (43 days avg.) has the shortest, reflecting typical travel planning cycles.
Recommendations for Hosts
- Use the overall average lead time (94 days) as a baseline for your pricing and availability strategy in Silver Creek Township.
- For June stays, consider implementing length-of-stay discounts or slightly higher rates for bookings made less than 149 days out to capitalize on advance planning.
- Target marketing efforts for the Summer season well in advance (at least 130 days) to capture early planners.
- Monitor your own booking lead times against these Silver Creek Township averages to identify opportunities for dynamic pricing adjustments.
Popular & Essential Airbnb Amenities in Silver Creek Township (2026)
Amenity Prevalence
Amenity Insights for Silver Creek Township
- Essential amenities in Silver Creek Township that guests expect include: Heating, Carbon monoxide alarm, Smoke alarm, Kitchen, Free parking on premises, Dishes and silverware, Coffee maker, Patio or balcony, Fire extinguisher. Lacking these (any) could significantly impact bookings.
- Popular amenities like Hot water are common but not universal. Offering these can provide a competitive edge.
Recommendations for Hosts
- Ensure your listing includes all essential amenities for Silver Creek Township: Heating, Carbon monoxide alarm, Smoke alarm, Kitchen, Free parking on premises, Dishes and silverware, Coffee maker, Patio or balcony, Fire extinguisher.
- Consider adding popular differentiators like Hot water to increase appeal.
- Highlight unique or less common amenities you offer (e.g., hot tub, dedicated workspace, EV charger) in your listing description and photos.
- Regularly check competitor amenities in Silver Creek Township to stay competitive.
Silver Creek Township Airbnb Guest Demographics & Profile Analysis (2026)
Guest Profile Summary for Silver Creek Township
- The typical guest profile for Airbnb in Silver Creek Township consists of primarily domestic travelers (98%), often arriving from nearby Minneapolis, typically belonging to the Post-2000s (Gen Z/Alpha) group (50%), primarily speaking English or Spanish.
- Domestic travelers account for 98.4% of guests.
- Key international markets include United States (98.4%) and Netherlands (0.5%).
- Top languages spoken are English (74.6%) followed by Spanish (11.9%).
- A significant demographic segment is the Post-2000s (Gen Z/Alpha) group, representing 50% of guests.
Recommendations for Hosts
- Target domestic marketing efforts towards travelers from Minneapolis and Saint Paul.
- Tailor amenities and listing descriptions to appeal to the dominant Post-2000s (Gen Z/Alpha) demographic (e.g., highlight fast WiFi, smart home features, local guides).
- Highlight unique local experiences or amenities relevant to the primary guest profile.
- Consider seasonal promotions aligned with peak travel times for key origin markets.
Nearby Short-Term Rental Market Comparison
How does the Silver Creek Township Airbnb market stack up against its neighbors? Compare key performance metrics like average monthly revenue, ADR, and occupancy rates in surrounding areas to understand the broader regional STR landscape.
| Market | Active Properties | Monthly Revenue | Daily Rate | Avg. Occupancy |
|---|---|---|---|---|
| Town of Minong | 21 | $5,818 | $576.90 | 41% |
| Lake No. 2 | 24 | $5,702 | $377.58 | 51% |
| Schroeder Township | 10 | $5,197 | $395.87 | 43% |
| Schroeder | 10 | $5,094 | $482.67 | 46% |
| Town of Clover | 13 | $5,047 | $303.16 | 53% |
| Morse Township | 11 | $4,903 | $340.12 | 53% |
| Forest Lake | 25 | $4,839 | $398.24 | 47% |
| Grand Lake Township | 11 | $4,834 | $345.41 | 46% |
| Lutsen | 22 | $4,676 | $433.38 | 41% |
| Tofte Township | 44 | $4,639 | $307.90 | 48% |