Petal Airbnb Market Analysis 2025: Short Term Rental Data & Vacation Rental Statistics in Mississippi, United States
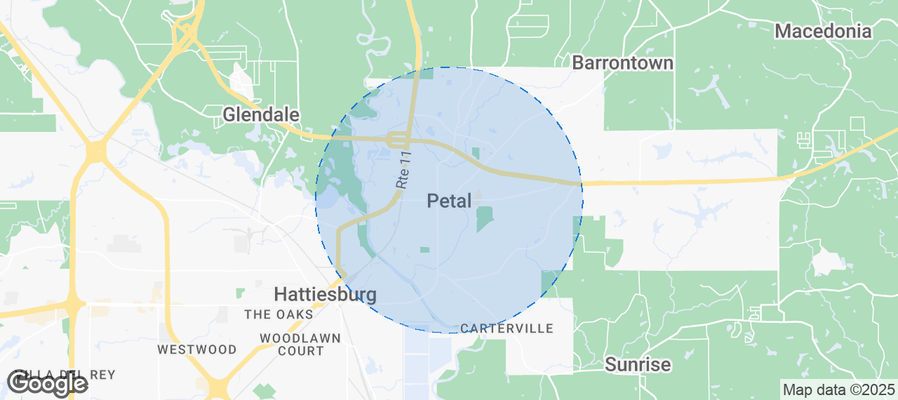
Is Airbnb profitable in Petal in 2025? Explore comprehensive Airbnb analytics for Petal, Mississippi, United States to uncover income potential. This 2025 STR market report for Petal, based on AirROI data from October 2024 to September 2025, reveals key trends in the niche market of 18 active listings.
Whether you're considering an Airbnb investment in Petal, optimizing your existing vacation rental, or exploring rental arbitrage opportunities, understanding the Petal Airbnb data is crucial. Leveraging the low regulation environment is key to maximizing your short term rental income potential. Let's dive into the specifics.
Key Petal Airbnb Performance Metrics Overview
Monthly Airbnb Revenue Variations & Income Potential in Petal (2025)
Understanding the monthly revenue variations for Airbnb listings in Petal is key to maximizing your short term rental income potential. Seasonality significantly impacts earnings. Our analysis, based on data from the past 12 months, shows that the peak revenue month for STRs in Petal is typically October, while January often presents the lowest earnings, highlighting opportunities for strategic pricing adjustments during shoulder and low seasons. Explore the typical Airbnb income in Petal across different performance tiers:
- Best-in-class properties (Top 10%) achieve $5,054+ monthly, often utilizing dynamic pricing and superior guest experiences.
- Strong performing properties (Top 25%) earn $3,087 or more, indicating effective management and desirable locations/amenities.
- Typical properties (Median) generate around $2,140 per month, representing the average market performance.
- Entry-level properties (Bottom 25%) see earnings around $1,492, often with potential for optimization.
Average Monthly Airbnb Earnings Trend in Petal
Petal Airbnb Occupancy Rate Trends (2025)
Maximize your bookings by understanding the Petal STR occupancy trends. Seasonal demand shifts significantly influence how often properties are booked. Typically, Februarysees the highest demand (peak season occupancy), while September experiences the lowest (low season). Effective strategies, like adjusting minimum stays or offering promotions, can boost occupancy during slower periods. Here's how different property tiers perform in Petal:
- Best-in-class properties (Top 10%) achieve 70%+ occupancy, indicating high desirability and potentially optimized availability.
- Strong performing properties (Top 25%) maintain 51% or higher occupancy, suggesting good market fit and guest satisfaction.
- Typical properties (Median) have an occupancy rate around 37%.
- Entry-level properties (Bottom 25%) average 24% occupancy, potentially facing higher vacancy.
Average Monthly Occupancy Rate Trend in Petal
Average Daily Rate (ADR) Airbnb Trends in Petal (2025)
Effective short term rental pricing strategy in Petal involves understanding monthly ADR fluctuations. The Average Daily Rate (ADR) for Airbnb in Petal typically peaks in August and dips lowest during March. Leveraging Airbnb dynamic pricing tools or strategies based on this seasonality can significantly boost revenue. Here's a look at the typical nightly rates achieved:
- Best-in-class properties (Top 10%) command rates of $348+ per night, often due to premium features or locations.
- Strong performing properties (Top 25%) achieve nightly rates of $198 or more.
- Typical properties (Median) charge around $138 per night.
- Entry-level properties (Bottom 25%) earn around $91 per night.
Average Daily Rate (ADR) Trend by Month in Petal
Get Live Petal Market Intelligence 👇
Explore Real-time Analytics
Airbnb Seasonality Analysis & Trends in Petal (2025)
Peak Season (October, July, August)
- Revenue averages $3,476 per month
- Occupancy rates average 42.4%
- Daily rates average $191
Shoulder Season
- Revenue averages $2,663 per month
- Occupancy maintains around 41.8%
- Daily rates hold near $176
Low Season (January, March, April)
- Revenue drops to average $2,106 per month
- Occupancy decreases to average 36.6%
- Daily rates adjust to average $144
Seasonality Insights for Petal
- The Airbnb seasonality in Petal shows moderate seasonality with distinct peak and low periods. While the sections above show seasonal averages, it's also insightful to look at the extremes:
- During the high season, the absolute peak month showcases Petal's highest earning potential, with monthly revenues capable of climbing to $3,743, occupancy reaching a high of 54.3%, and ADRs peaking at $219.
- Conversely, the slowest single month of the year, typically falling within the low season, marks the market's lowest point. In this month, revenue might dip to $2,045, occupancy could drop to 30.0%, and ADRs may adjust down to $138.
- Understanding both the seasonal averages and these monthly peaks and troughs in revenue, occupancy, and ADR is crucial for maximizing your Airbnb profit potential in Petal.
Seasonal Strategies for Maximizing Profit
- Peak Season: Maximize revenue through premium pricing and potentially longer minimum stays. Ensure high availability.
- Low Season: Offer competitive pricing, special promotions (e.g., extended stay discounts), and flexible cancellation policies. Target off-season travelers like remote workers or budget-conscious guests.
- Shoulder Seasons: Implement dynamic pricing that balances peak and low rates. Target weekend travelers or specific events. Offer slightly more flexible terms than peak season.
- Regularly analyze your own performance against these Petal seasonality benchmarks and adjust your pricing and availability strategy accordingly.
Best Areas for Airbnb Investment in Petal (2025)
Exploring the top neighborhoods for short-term rentals in Petal? This section highlights key areas, outlining why they are attractive for hosts and guests, along with notable local attractions. Consider these locations based on your target guest profile and investment strategy.
| Neighborhood / Area | Why Host Here? (Target Guests & Appeal) | Key Attractions & Landmarks |
|---|---|---|
| Downtown Petal | The heart of the city with local shops, restaurants, and a vibrant community atmosphere. Ideal for visitors wanting to experience the local culture and enjoy convenience access to services. | Petal Historical Society, Petal Public Library, local cafes and shops |
| Petal High School Area | Close proximity to schools and recreational facilities, attracting families visiting for events or activities associated with the school. | Petal High School, Petal Football Stadium, Recreation Center |
| Petal Arts and Crafts District | Known for its local artisans and stores, this area attracts visitors interested in crafts, art, and unique local products. | local craft shops, art galleries, workshops, community art events |
| Lakeside Park Neighborhood | A peaceful residential area near Lakeside Park, great for families and people looking for a relaxing atmosphere near nature. | Lakeside Park, fishing spots, playgrounds, walking trails |
| Historic Old Town | Rich in history with charming architecture and local heritage sites, attractive to tourists interested in exploring the culture and history of the area. | Old Town Historic District, local dining, historic landmarks |
| Nearby Hattiesburg | Just a short drive away, Hattiesburg offers a larger city experience with more attractions, making it appealing for visitors who want to explore beyond Petal. | University of Southern Mississippi, Hattiesburg Zoo, local shopping centers |
| Petal Sports Complex | A sports hub that attracts teams and families for events and games, ideal for visitors coming for sports-related reasons. | Petal Sports Complex, local football and baseball events |
| Petal Nature Trails | Attractive for nature enthusiasts and those looking for outdoor activities, with access to walking and biking trails. | nature trails, wildlife viewing, outdoor activities |
Understanding Airbnb License Requirements & STR Laws in Petal (2025)
While Petal, Mississippi, United States currently shows low STR regulations, specific Airbnb license requirements might still exist or change. Always verify the latest short term rental regulations and Airbnb license requirements directly with local government authorities for Petal to ensure full compliance before hosting.
(Source: AirROI data, 2025, finding no licensed listings among those analyzed)
Top Performing Airbnb Properties in Petal (2025)
Benchmark your potential! Explore examples of top-performing Airbnb properties in Petalbased on Trailing Twelve Month (TTM) revenue. Analyze their characteristics, revenue, occupancy rate, and ADR to understand what drives success in this market.
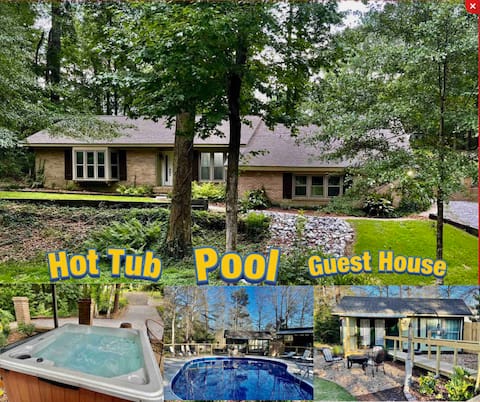
Home & Guesthouse (Pool) Arcade (Hot Tub) Sauna
Entire Place • 4 bedrooms

Fun Home with Pool, Arcade, Hot Tub, HP Kids Room
Entire Place • 3 bedrooms

The Leaf River Yacht Club KAYAKS INCLUDED
Entire Place • 2 bedrooms

Majestic Manor Close to ARPT by Deity Villas
Entire Place • 4 bedrooms
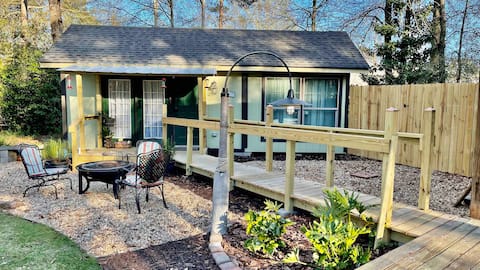
Relaxing Tiny House with Sauna Grill & Fire Pit
Entire Place • 1 bedroom
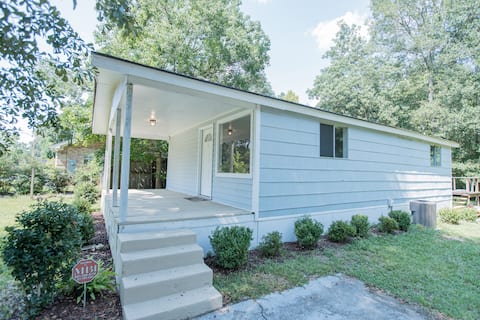
Pleasant, Bright 3 Bedroom Cottage
Entire Place • 3 bedrooms
Note: Performance varies based on location, size, amenities, seasonality, and management quality. Data reflects the past 12 months.
Top Performing Airbnb Hosts in Petal (2025)
Learn from the best! This table showcases top-performing Airbnb hosts in Petal based on the number of properties managed and estimated total revenue over the past year. Analyze their scale and performance metrics.
| Host Name | Properties | Grossing Revenue | Stay Reviews | Avg Rating |
|---|---|---|---|---|
| Gabriel | 3 | $174,794 | 322 | 4.98/5.0 |
| Scotty | 1 | $41,095 | 301 | 4.90/5.0 |
| Alfred | 2 | $40,517 | 431 | 4.81/5.0 |
| Michael | 2 | $39,969 | 516 | 4.63/5.0 |
| Paul | 1 | $35,517 | 14 | 4.93/5.0 |
| Paul | 1 | $25,468 | 4 | 5.00/5.0 |
| Stan | 1 | $21,895 | 39 | 5.00/5.0 |
| Scott | 1 | $18,386 | 47 | 4.98/5.0 |
| Shelley | 1 | $17,136 | 48 | 4.98/5.0 |
| Brett | 1 | $12,709 | 40 | 4.78/5.0 |
Analyzing the strategies of top hosts, such as their property selection, pricing, and guest communication, can offer valuable lessons for optimizing your own Airbnb operations in Petal.
Dive Deeper: Advanced Petal STR Market Data (2025)
Ready to unlock more insights? AirROI provides access to advanced metrics and comprehensive Airbnb data for Petal. Explore detailed analytics beyond this report to refine your investment strategy, optimize pricing, and maximize your vacation rental profits.
Explore Advanced MetricsPetal Short-Term Rental Market Composition (2025): Property & Room Types
Room Type Distribution
Property Type Distribution
Market Composition Insights for Petal
- The Petal Airbnb market composition is heavily skewed towards Entire Home/Apt listings, which make up 100% of the 18 active rentals. This indicates strong guest preference for privacy and space.
- Looking at the property type distribution in Petal, House properties are the most common (77.8%), reflecting the local real estate landscape.
- Houses represent a significant 77.8% portion, catering likely to families or larger groups.
Petal Airbnb Room Capacity Analysis (2025): Bedroom Distribution
Distribution of Listings by Number of Bedrooms
Room Capacity Insights for Petal
- The dominant room capacity in Petal is 3 bedrooms listings, making up 38.9% of the market. This suggests a strong demand for properties suitable for families or small groups.
- Together, 3 bedrooms and 2 bedrooms properties represent 72.2% of the active Airbnb listings in Petal, indicating a high concentration in these sizes.
- A significant 55.6% of listings offer 3+ bedrooms, catering to larger groups and families seeking more space in Petal.
Petal Vacation Rental Guest Capacity Trends (2025)
Distribution of Listings by Guest Capacity
Guest Capacity Insights for Petal
- The most common guest capacity trend in Petal vacation rentals is listings accommodating 8+ guests (55.6%). This suggests the primary traveler segment is likely larger groups.
- Properties designed for 8+ guests and 6 guests dominate the Petal STR market, accounting for 77.8% of listings.
- 77.8% of properties accommodate 6+ guests, serving the market segment for larger families or group travel in Petal.
- On average, properties in Petal are equipped to host 6.7 guests.
Petal Airbnb Booking Patterns (2025): Available vs. Booked Days
Available Days Distribution
Booked Days Distribution
Booking Pattern Insights for Petal
- The most common availability pattern in Petal falls within the 181-270 days range, representing 44.4% of listings. This suggests many properties have significant open periods on their calendars.
- Approximately 77.7% of listings show high availability (181+ days open annually), indicating potential for increased bookings or specific owner usage patterns.
- For booked days, the 91-180 days range is most frequent in Petal (44.4%), reflecting common guest stay durations or potential owner blocking patterns.
- A notable 22.2% of properties secure long booking periods (181+ days booked per year), highlighting successful long-term rental strategies or significant owner usage.
Petal Airbnb Minimum Stay Requirements Analysis
Distribution of Listings by Minimum Night Requirement
1 Night
10 listings
55.6% of total
2 Nights
2 listings
11.1% of total
3 Nights
1 listings
5.6% of total
30+ Nights
5 listings
27.8% of total
Key Insights
- The most prevalent minimum stay requirement in Petal is 1 Night, adopted by 55.6% of listings. This highlights the market's preference for shorter, flexible bookings.
- A strong majority (66.7%) of the Petal Airbnb data shows acceptance of very short stays (1-2 nights), indicating a dynamic, high-turnover market.
- A significant segment (27.8%) caters to monthly stays (30+ nights) in Petal, pointing to opportunities in the extended-stay market.
Recommendations
- Align with the market by considering a 1 Night minimum stay, as 55.6% of Petal hosts use this setting.
- Explore offering discounts for stays of 30+ nights to attract the 27.8% of the market seeking extended stays.
- Adjust minimum nights based on seasonality – potentially shorter during low season and longer during peak demand periods in Petal.
Petal Airbnb Cancellation Policy Trends Analysis (2025)
Flexible
8 listings
44.4% of total
Moderate
6 listings
33.3% of total
Firm
3 listings
16.7% of total
Strict
1 listings
5.6% of total
Cancellation Policy Insights for Petal
- The prevailing Airbnb cancellation policy trend in Petal is Flexible, used by 44.4% of listings.
- The market strongly favors guest-friendly terms, with 77.7% of listings offering Flexible or Moderate policies. This suggests guests in Petal may expect booking flexibility.
- Strict cancellation policies are quite rare (5.6%), potentially making listings with this policy less competitive unless justified by high demand or property type.
Recommendations for Hosts
- Consider adopting a Flexible policy to align with the 44.4% market standard in Petal.
- Using a Strict policy might deter some guests, as only 5.6% of listings use it. Evaluate if potential revenue protection outweighs possible lower booking rates.
- Regularly review your cancellation policy against competitors and market demand shifts in Petal.
Petal STR Booking Lead Time Analysis (2025)
Average Booking Lead Time by Month
Booking Lead Time Insights for Petal
- The overall average booking lead time for vacation rentals in Petal is 18 days.
- Guests book furthest in advance for stays during May (average 35 days), likely coinciding with peak travel demand or local events.
- The shortest booking windows occur for stays in February (average 10 days), indicating more last-minute travel plans during this time.
- Seasonally, Fall (24 days avg.) sees the longest lead times, while Winter (14 days avg.) has the shortest, reflecting typical travel planning cycles.
Recommendations for Hosts
- Use the overall average lead time (18 days) as a baseline for your pricing and availability strategy in Petal.
- For May stays, consider implementing length-of-stay discounts or slightly higher rates for bookings made less than 35 days out to capitalize on advance planning.
- During February, focus on last-minute booking availability and promotions, as guests book with very short notice (10 days avg.).
- Target marketing efforts for the Fall season well in advance (at least 24 days) to capture early planners.
- Monitor your own booking lead times against these Petal averages to identify opportunities for dynamic pricing adjustments.
Popular & Essential Airbnb Amenities in Petal (2025)
Amenity Prevalence
No amenities with partial availability (less than 100%) were found to display in the chart. All essential amenities might be present in all listings. Check insights below.
Amenity Insights for Petal
- Essential amenities in Petal that guests expect include: Heating, Dishes and silverware, Air conditioning, Refrigerator, Kitchen, Smoke alarm, Coffee maker, TV, Cooking basics, Free parking on premises. Lacking these (any) could significantly impact bookings.
Recommendations for Hosts
- Ensure your listing includes all essential amenities for Petal: Heating, Dishes and silverware, Air conditioning, Refrigerator, Kitchen, Smoke alarm, Coffee maker, TV, Cooking basics, Free parking on premises.
- Highlight unique or less common amenities you offer (e.g., hot tub, dedicated workspace, EV charger) in your listing description and photos.
- Regularly check competitor amenities in Petal to stay competitive.
Petal Airbnb Guest Demographics & Profile Analysis (2025)
Guest Profile Summary for Petal
- The typical guest profile for Airbnb in Petal consists of primarily domestic travelers (95%), often arriving from nearby Hattiesburg, typically belonging to the Post-2000s (Gen Z/Alpha) group (50%), primarily speaking English or Spanish.
- Domestic travelers account for 94.8% of guests.
- Key international markets include United States (94.8%) and Germany (0.9%).
- Top languages spoken are English (85.5%) followed by Spanish (8.1%).
- A significant demographic segment is the Post-2000s (Gen Z/Alpha) group, representing 50% of guests.
Recommendations for Hosts
- Target domestic marketing efforts towards travelers from Hattiesburg and New Orleans.
- Tailor amenities and listing descriptions to appeal to the dominant Post-2000s (Gen Z/Alpha) demographic (e.g., highlight fast WiFi, smart home features, local guides).
- Highlight unique local experiences or amenities relevant to the primary guest profile.
- Consider seasonal promotions aligned with peak travel times for key origin markets.
Nearby Short-Term Rental Market Comparison
How does the Petal Airbnb market stack up against its neighbors? Compare key performance metrics like average monthly revenue, ADR, and occupancy rates in surrounding areas to understand the broader regional STR landscape.
| Market | Active Properties | Monthly Revenue | Daily Rate | Avg. Occupancy |
|---|---|---|---|---|
| Dauphin Island | 583 | $3,246 | $361.30 | 37% |
| Killian | 15 | $2,722 | $359.24 | 33% |
| Ponchatoula | 49 | $2,550 | $232.15 | 40% |
| Kiln | 15 | $2,546 | $205.70 | 46% |
| Ocean Springs | 242 | $2,492 | $210.31 | 43% |
| Pass Christian | 171 | $2,483 | $273.00 | 36% |
| Covington | 65 | $2,474 | $220.70 | 48% |
| Abita Springs | 17 | $2,424 | $187.98 | 51% |
| Bay Saint Louis | 299 | $2,402 | $266.42 | 34% |
| Waveland | 86 | $2,213 | $227.64 | 38% |