Waveland Airbnb Market Analysis 2026: Short Term Rental Data & Vacation Rental Statistics in Mississippi, United States
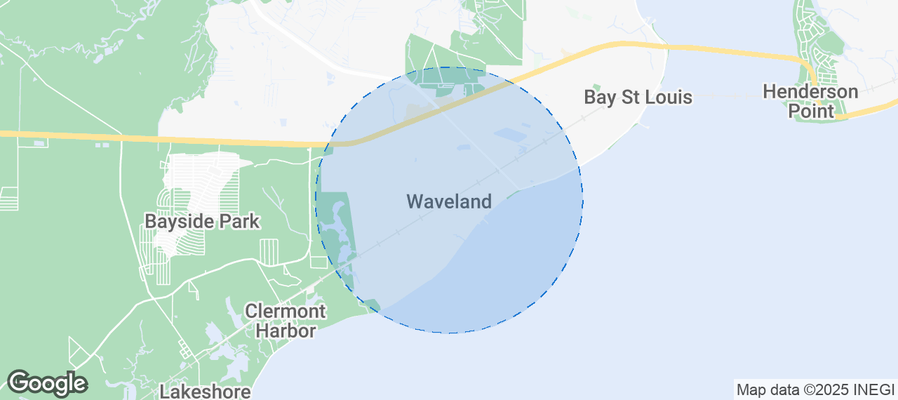
Is Airbnb profitable in Waveland in 2026? Explore comprehensive Airbnb analytics for Waveland, Mississippi, United States to uncover income potential. This 2026 STR market report for Waveland, based on AirROI data from February 2025 to January 2026, reveals key trends in the niche market of 85 active listings.
Whether you're considering an Airbnb investment in Waveland, optimizing your existing vacation rental, or exploring rental arbitrage opportunities, understanding the Waveland Airbnb data is crucial. Leveraging the low regulation environment is key to maximizing your short term rental income potential. Let's dive into the specifics.
Key Waveland Airbnb Performance Metrics Overview
Monthly Airbnb Revenue Variations & Income Potential in Waveland (2026)
Understanding the monthly revenue variations for Airbnb listings in Waveland is key to maximizing your short term rental income potential. Seasonality significantly impacts earnings. Our analysis, based on data from the past 12 months, shows that the peak revenue month for STRs in Waveland is typically July, while February often presents the lowest earnings, highlighting opportunities for strategic pricing adjustments during shoulder and low seasons. Explore the typical Airbnb income in Waveland across different performance tiers:
- Best-in-class properties (Top 10%) achieve $6,207+ monthly, often utilizing dynamic pricing and superior guest experiences.
- Strong performing properties (Top 25%) earn $3,651 or more, indicating effective management and desirable locations/amenities.
- Typical properties (Median) generate around $1,995 per month, representing the average market performance.
- Entry-level properties (Bottom 25%) see earnings around $1,163, often with potential for optimization.
Average Monthly Airbnb Earnings Trend in Waveland
Waveland Airbnb Occupancy Rate Trends (2026)
Maximize your bookings by understanding the Waveland STR occupancy trends. Seasonal demand shifts significantly influence how often properties are booked. Typically, Marchsees the highest demand (peak season occupancy), while January experiences the lowest (low season). Effective strategies, like adjusting minimum stays or offering promotions, can boost occupancy during slower periods. Here's how different property tiers perform in Waveland:
- Best-in-class properties (Top 10%) achieve 69%+ occupancy, indicating high desirability and potentially optimized availability.
- Strong performing properties (Top 25%) maintain 52% or higher occupancy, suggesting good market fit and guest satisfaction.
- Typical properties (Median) have an occupancy rate around 34%.
- Entry-level properties (Bottom 25%) average 20% occupancy, potentially facing higher vacancy.
Average Monthly Occupancy Rate Trend in Waveland
Average Daily Rate (ADR) Airbnb Trends in Waveland (2026)
Effective short term rental pricing strategy in Waveland involves understanding monthly ADR fluctuations. The Average Daily Rate (ADR) for Airbnb in Waveland typically peaks in October and dips lowest during March. Leveraging Airbnb dynamic pricing tools or strategies based on this seasonality can significantly boost revenue. Here's a look at the typical nightly rates achieved:
- Best-in-class properties (Top 10%) command rates of $380+ per night, often due to premium features or locations.
- Strong performing properties (Top 25%) achieve nightly rates of $282 or more.
- Typical properties (Median) charge around $209 per night.
- Entry-level properties (Bottom 25%) earn around $140 per night.
Average Daily Rate (ADR) Trend by Month in Waveland
Get Live Waveland Market Intelligence 👇
Explore Real-time Analytics
Airbnb Seasonality Analysis & Trends in Waveland (2026)
Peak Season (July, June, October)
- Revenue averages $3,726 per month
- Occupancy rates average 45.4%
- Daily rates average $245
Shoulder Season
- Revenue averages $2,714 per month
- Occupancy maintains around 38.0%
- Daily rates hold near $232
Low Season (January, February, September)
- Revenue drops to average $2,039 per month
- Occupancy decreases to average 29.6%
- Daily rates adjust to average $232
Seasonality Insights for Waveland
- The Airbnb seasonality in Waveland shows highly seasonal trends requiring careful strategy. While the sections above show seasonal averages, it's also insightful to look at the extremes:
- During the high season, the absolute peak month showcases Waveland's highest earning potential, with monthly revenues capable of climbing to $4,080, occupancy reaching a high of 50.8%, and ADRs peaking at $268.
- Conversely, the slowest single month of the year, typically falling within the low season, marks the market's lowest point. In this month, revenue might dip to $1,949, occupancy could drop to 26.7%, and ADRs may adjust down to $214.
- Understanding both the seasonal averages and these monthly peaks and troughs in revenue, occupancy, and ADR is crucial for maximizing your Airbnb profit potential in Waveland.
Seasonal Strategies for Maximizing Profit
- Peak Season: Maximize revenue through premium pricing and potentially longer minimum stays. Ensure high availability.
- Low Season: Offer competitive pricing, special promotions (e.g., extended stay discounts), and flexible cancellation policies. Target off-season travelers like remote workers or budget-conscious guests.
- Shoulder Seasons: Implement dynamic pricing that balances peak and low rates. Target weekend travelers or specific events. Offer slightly more flexible terms than peak season.
- Regularly analyze your own performance against these Waveland seasonality benchmarks and adjust your pricing and availability strategy accordingly.
Best Areas for Airbnb Investment in Waveland (2026)
Exploring the top neighborhoods for short-term rentals in Waveland? This section highlights key areas, outlining why they are attractive for hosts and guests, along with notable local attractions. Consider these locations based on your target guest profile and investment strategy.
| Neighborhood / Area | Why Host Here? (Target Guests & Appeal) | Key Attractions & Landmarks |
|---|---|---|
| Waveland Beach | Waveland Beach offers a serene coastal experience with beautiful sandy shores, making it a prime destination for vacationers looking to relax by the sea. | Waveland Beach, St. Joseph's Church, Waveland Ground Zero Hurricane Museum, The Beach at Waveland, Waveland Lighthouse |
| Bayside Park | A beautiful park area that attracts families and outdoor enthusiasts, providing recreational opportunities and easy access to the waterfront. | Bayside Park, Fishing Pier, Picnic Areas, Playgrounds, Nature Trails |
| Old Waveland | This area features quaint historical attractions and local charm, appealing to those interested in the cultural heritage of Waveland. | Historic Homes, Local Art Galleries, Dining Spots, Waveland Heritage Museum |
| Gulfport | Nearby Gulfport boasts more extensive attractions such as shopping, dining, and entertainment, making it a convenient location for guests. | Gulfport Beach, Sculpture Park, Gulfport Harbor, Shopping Centers, Restaurants |
| Pass Christian | Known for its charming small-town atmosphere, Pass Christian offers beautiful scenic views and local festivals, attracting visitors year-round. | Pass Christian Beach, Dodges' Pass, Local Shops, Arts and Crafts Festivals, Historical Sites |
| Bay St. Louis | A vibrant arts community and beautiful coastal town with galleries and shops, Bay St. Louis is popular with tourists seeking culture and relaxation. | Bay St. Louis Beach, Historic District, Local Art Galleries, Dining Experiences, Marina |
| Slidell | Just across the state line, Slidell provides a larger urban setting with shopping and dining options, appealing to a wider range of visitors. | Olde Towne Slidell, Slidell Historic Museum, Shopping Malls, Dining Spots, Parks |
| Diamondhead | A planned community with a golf course and marina, Diamondhead is appealing to outdoor enthusiasts and those seeking a peaceful retreat. | Diamondhead Golf Club, Marina, Nature Trails, Community Events, Recreational Activities |
Understanding Airbnb License Requirements & STR Laws in Waveland (2026)
While Waveland, Mississippi, United States currently shows low STR regulations, specific Airbnb license requirements might still exist or change. Always verify the latest short term rental regulations and Airbnb license requirements directly with local government authorities for Waveland to ensure full compliance before hosting.
(Source: AirROI data, 2026, based on 1% licensed listings)
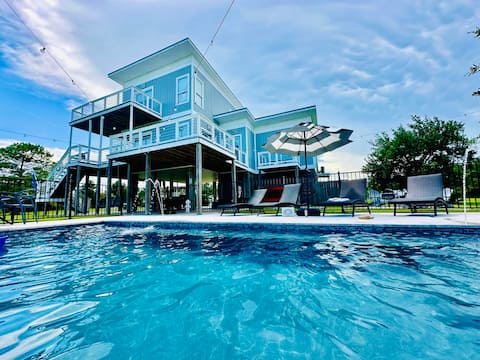
Top Performing Airbnb Properties in Waveland (2026)
Benchmark your potential! Explore examples of top-performing Airbnb properties in Wavelandbased on Trailing Twelve Month (TTM) revenue. Analyze their characteristics, revenue, occupancy rate, and ADR to understand what drives success in this market.

Cabin on the Coast
Entire Place • 5 bedrooms

Family Home-Sleeps 20-On Beautiful 1-Acre Property
Entire Place • 7 bedrooms

Beachfront Escape/Golf Cart /Hot Tub/Fire Pit
Entire Place • 2 bedrooms
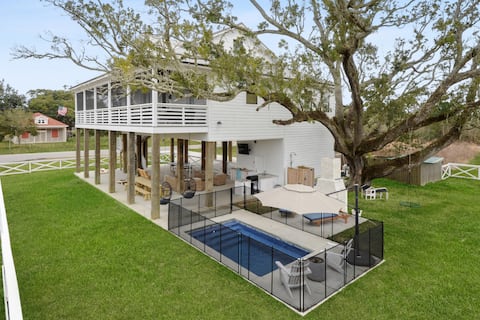
Coastal Oasis - Heated Pool, Walk to Beach!
Entire Place • 4 bedrooms
Privacy, Walk2beach,firepit, Golfcart, VIEWS, pool
Entire Place • 3 bedrooms

Heated Salt Pool*Walk2Beach*Mins2BayStLouis*PetsOK
Entire Place • 3 bedrooms
Note: Performance varies based on location, size, amenities, seasonality, and management quality. Data reflects the past 12 months.
Top Performing Airbnb Hosts in Waveland (2026)
Learn from the best! This table showcases top-performing Airbnb hosts in Waveland based on the number of properties managed and estimated total revenue over the past year. Analyze their scale and performance metrics.
| Host Name | Properties | Grossing Revenue | Stay Reviews | Avg Rating |
|---|---|---|---|---|
| Evolve | 5 | $131,777 | 226 | 4.88/5.0 |
| Jacob | 3 | $126,751 | 216 | 4.95/5.0 |
| Spencer | 5 | $122,553 | 101 | 4.99/5.0 |
| Lawrence | 1 | $117,132 | 40 | 4.75/5.0 |
| Amy | 3 | $113,629 | 327 | 4.95/5.0 |
| Gianni | 1 | $101,222 | 66 | 4.76/5.0 |
| Teresa | 1 | $98,704 | 50 | 5.00/5.0 |
| Scott | 1 | $88,905 | 117 | 4.84/5.0 |
| Melissa | 1 | $87,705 | 62 | 5.00/5.0 |
| Rachel G | 1 | $79,413 | 83 | 4.87/5.0 |
Analyzing the strategies of top hosts, such as their property selection, pricing, and guest communication, can offer valuable lessons for optimizing your own Airbnb operations in Waveland.
Dive Deeper: Advanced Waveland STR Market Data (2026)
Ready to unlock more insights? AirROI provides access to advanced metrics and comprehensive Airbnb data for Waveland. Explore detailed analytics beyond this report to refine your investment strategy, optimize pricing, and maximize your vacation rental profits.
Explore Advanced MetricsWaveland Short-Term Rental Market Composition (2026): Property & Room Types
Room Type Distribution
Property Type Distribution
Market Composition Insights for Waveland
- The Waveland Airbnb market composition is heavily skewed towards Entire Home/Apt listings, which make up 98.8% of the 85 active rentals. This indicates strong guest preference for privacy and space.
- Looking at the property type distribution in Waveland, House properties are the most common (87.1%), reflecting the local real estate landscape.
- Houses represent a significant 87.1% portion, catering likely to families or larger groups.
- The presence of 5.9% Hotel/Boutique listings indicates integration with traditional hospitality.
- Smaller segments like apartment/condo (combined 1.2%) offer potential for unique stay experiences.
Waveland Airbnb Room Capacity Analysis (2026): Bedroom Distribution
Distribution of Listings by Number of Bedrooms
Room Capacity Insights for Waveland
- The dominant room capacity in Waveland is 3 bedrooms listings, making up 49.4% of the market. This suggests a strong demand for properties suitable for families or small groups.
- Together, 3 bedrooms and 2 bedrooms properties represent 72.9% of the active Airbnb listings in Waveland, indicating a high concentration in these sizes.
- A significant 62.4% of listings offer 3+ bedrooms, catering to larger groups and families seeking more space in Waveland.
Waveland Vacation Rental Guest Capacity Trends (2026)
Distribution of Listings by Guest Capacity
Guest Capacity Insights for Waveland
- The most common guest capacity trend in Waveland vacation rentals is listings accommodating 6 guests (35.3%). This suggests the primary traveler segment is likely larger groups.
- Properties designed for 6 guests and 8+ guests dominate the Waveland STR market, accounting for 62.4% of listings.
- 73.0% of properties accommodate 6+ guests, serving the market segment for larger families or group travel in Waveland.
- On average, properties in Waveland are equipped to host 6.0 guests.
Waveland Airbnb Booking Patterns (2026): Available vs. Booked Days
Available Days Distribution
Booked Days Distribution
Booking Pattern Insights for Waveland
- The most common availability pattern in Waveland falls within the 181-270 days range, representing 42.4% of listings. This suggests many properties have significant open periods on their calendars.
- Approximately 84.8% of listings show high availability (181+ days open annually), indicating potential for increased bookings or specific owner usage patterns.
- For booked days, the 91-180 days range is most frequent in Waveland (43.5%), reflecting common guest stay durations or potential owner blocking patterns.
- A notable 17.7% of properties secure long booking periods (181+ days booked per year), highlighting successful long-term rental strategies or significant owner usage.
Waveland Airbnb Minimum Stay Requirements Analysis
Distribution of Listings by Minimum Night Requirement
1 Night
14 listings
16.5% of total
2 Nights
31 listings
36.5% of total
3 Nights
9 listings
10.6% of total
30+ Nights
31 listings
36.5% of total
Key Insights
- The most prevalent minimum stay requirement in Waveland is 2 Nights, adopted by 36.5% of listings. This highlights the market's preference for shorter, flexible bookings.
- A significant segment (36.5%) caters to monthly stays (30+ nights) in Waveland, pointing to opportunities in the extended-stay market.
Recommendations
- Align with the market by considering a 2 Nights minimum stay, as 36.5% of Waveland hosts use this setting.
- If feasible, allowing 1-night stays, especially midweek or during low season, could capture last-minute bookings, as only 16.5% currently do.
- A 2-night minimum appears standard (36.5%). Consider this for weekends or peak periods.
- Explore offering discounts for stays of 30+ nights to attract the 36.5% of the market seeking extended stays.
- Adjust minimum nights based on seasonality – potentially shorter during low season and longer during peak demand periods in Waveland.
Waveland Airbnb Cancellation Policy Trends Analysis (2026)
Super Strict 30 Days
1 listings
1.2% of total
Limited
1 listings
1.2% of total
Flexible
22 listings
25.9% of total
Moderate
17 listings
20% of total
Firm
35 listings
41.2% of total
Strict
9 listings
10.6% of total
Cancellation Policy Insights for Waveland
- The prevailing Airbnb cancellation policy trend in Waveland is Firm, used by 41.2% of listings.
- A majority (51.8%) of hosts in Waveland utilize Firm or Strict policies, indicating a market where hosts prioritize booking security.
Recommendations for Hosts
- Consider adopting a Firm policy to align with the 41.2% market standard in Waveland.
- Using a Strict policy might deter some guests, as only 10.6% of listings use it. Evaluate if potential revenue protection outweighs possible lower booking rates.
- Regularly review your cancellation policy against competitors and market demand shifts in Waveland.
Waveland STR Booking Lead Time Analysis (2026)
Average Booking Lead Time by Month
Booking Lead Time Insights for Waveland
- The overall average booking lead time for vacation rentals in Waveland is 49 days.
- Guests book furthest in advance for stays during October (average 85 days), likely coinciding with peak travel demand or local events.
- The shortest booking windows occur for stays in January (average 30 days), indicating more last-minute travel plans during this time.
- Seasonally, Fall (54 days avg.) sees the longest lead times, while Winter (39 days avg.) has the shortest, reflecting typical travel planning cycles.
Recommendations for Hosts
- Use the overall average lead time (49 days) as a baseline for your pricing and availability strategy in Waveland.
- For October stays, consider implementing length-of-stay discounts or slightly higher rates for bookings made less than 85 days out to capitalize on advance planning.
- Target marketing efforts for the Fall season well in advance (at least 54 days) to capture early planners.
- Monitor your own booking lead times against these Waveland averages to identify opportunities for dynamic pricing adjustments.
Popular & Essential Airbnb Amenities in Waveland (2026)
Amenity Prevalence
Amenity Insights for Waveland
- Essential amenities in Waveland that guests expect include: Air conditioning, Wifi, Smoke alarm, Fire extinguisher, Refrigerator, Heating, Microwave, TV, Kitchen. Lacking these (any) could significantly impact bookings.
- Popular amenities like Free parking on premises are common but not universal. Offering these can provide a competitive edge.
Recommendations for Hosts
- Ensure your listing includes all essential amenities for Waveland: Air conditioning, Wifi, Smoke alarm, Fire extinguisher, Refrigerator, Heating, Microwave, TV, Kitchen.
- Prioritize adding missing essentials: Smoke alarm, Fire extinguisher, Refrigerator, Heating, Microwave, TV, Kitchen.
- Consider adding popular differentiators like Free parking on premises to increase appeal.
- Highlight unique or less common amenities you offer (e.g., hot tub, dedicated workspace, EV charger) in your listing description and photos.
- Regularly check competitor amenities in Waveland to stay competitive.
Waveland Airbnb Guest Demographics & Profile Analysis (2026)
Guest Profile Summary for Waveland
- The typical guest profile for Airbnb in Waveland consists of primarily domestic travelers (98%), often arriving from nearby New Orleans, typically belonging to the Post-2000s (Gen Z/Alpha) group (50%), primarily speaking English or Spanish.
- Domestic travelers account for 97.9% of guests.
- Key international markets include United States (97.9%) and United Kingdom (0.6%).
- Top languages spoken are English (86.6%) followed by Spanish (7.3%).
- A significant demographic segment is the Post-2000s (Gen Z/Alpha) group, representing 50% of guests.
Recommendations for Hosts
- Target domestic marketing efforts towards travelers from New Orleans and Baton Rouge.
- Tailor amenities and listing descriptions to appeal to the dominant Post-2000s (Gen Z/Alpha) demographic (e.g., highlight fast WiFi, smart home features, local guides).
- Highlight unique local experiences or amenities relevant to the primary guest profile.
- Consider seasonal promotions aligned with peak travel times for key origin markets.
Nearby Short-Term Rental Market Comparison
How does the Waveland Airbnb market stack up against its neighbors? Compare key performance metrics like average monthly revenue, ADR, and occupancy rates in surrounding areas to understand the broader regional STR landscape.
| Market | Active Properties | Monthly Revenue | Daily Rate | Avg. Occupancy |
|---|---|---|---|---|
| Plaquemines Parish | 28 | $4,733 | $413.26 | 40% |
| Dauphin Island | 612 | $3,407 | $376.02 | 38% |
| New Orleans | 4,857 | $3,260 | $298.03 | 42% |
| Grand Isle | 106 | $3,149 | $432.40 | 32% |
| Killian | 14 | $3,089 | $360.39 | 37% |
| Pass Christian | 179 | $2,762 | $294.40 | 36% |
| Ocean Springs | 259 | $2,518 | $217.19 | 42% |
| Ponchatoula | 49 | $2,512 | $231.70 | 39% |
| Bay Saint Louis | 286 | $2,488 | $265.09 | 35% |
| Covington | 65 | $2,427 | $204.72 | 47% |