Dorchester Airbnb Market Analysis 2026: Short Term Rental Data & Vacation Rental Statistics in New Hampshire, United States
Is Airbnb profitable in Dorchester in 2026? Explore comprehensive Airbnb analytics for Dorchester, New Hampshire, United States to uncover income potential. This 2026 STR market report for Dorchester, based on AirROI data from February 2025 to January 2026, reveals key trends in the niche market of 23 active listings.
Whether you're considering an Airbnb investment in Dorchester, optimizing your existing vacation rental, or exploring rental arbitrage opportunities, understanding the Dorchester Airbnb data is crucial. Leveraging the low regulation environment is key to maximizing your short term rental income potential. Let's dive into the specifics.
Key Dorchester Airbnb Performance Metrics Overview
Monthly Airbnb Revenue Variations & Income Potential in Dorchester (2026)
Understanding the monthly revenue variations for Airbnb listings in Dorchester is key to maximizing your short term rental income potential. Seasonality significantly impacts earnings. Our analysis, based on data from the past 12 months, shows that the peak revenue month for STRs in Dorchester is typically October, while March often presents the lowest earnings, highlighting opportunities for strategic pricing adjustments during shoulder and low seasons. Explore the typical Airbnb income in Dorchester across different performance tiers:
- Best-in-class properties (Top 10%) achieve $4,120+ monthly, often utilizing dynamic pricing and superior guest experiences.
- Strong performing properties (Top 25%) earn $2,202 or more, indicating effective management and desirable locations/amenities.
- Typical properties (Median) generate around $602 per month, representing the average market performance.
- Entry-level properties (Bottom 25%) see earnings around $119, often with potential for optimization.
Average Monthly Airbnb Earnings Trend in Dorchester
Dorchester Airbnb Occupancy Rate Trends (2026)
Maximize your bookings by understanding the Dorchester STR occupancy trends. Seasonal demand shifts significantly influence how often properties are booked. Typically, Februarysees the highest demand (peak season occupancy), while March experiences the lowest (low season). Effective strategies, like adjusting minimum stays or offering promotions, can boost occupancy during slower periods. Here's how different property tiers perform in Dorchester:
- Best-in-class properties (Top 10%) achieve 75%+ occupancy, indicating high desirability and potentially optimized availability.
- Strong performing properties (Top 25%) maintain 44% or higher occupancy, suggesting good market fit and guest satisfaction.
- Typical properties (Median) have an occupancy rate around 17%.
- Entry-level properties (Bottom 25%) average 8% occupancy, potentially facing higher vacancy.
Average Monthly Occupancy Rate Trend in Dorchester
Average Daily Rate (ADR) Airbnb Trends in Dorchester (2026)
Effective short term rental pricing strategy in Dorchester involves understanding monthly ADR fluctuations. The Average Daily Rate (ADR) for Airbnb in Dorchester typically peaks in February and dips lowest during January. Leveraging Airbnb dynamic pricing tools or strategies based on this seasonality can significantly boost revenue. Here's a look at the typical nightly rates achieved:
- Best-in-class properties (Top 10%) command rates of $177+ per night, often due to premium features or locations.
- Strong performing properties (Top 25%) achieve nightly rates of $164 or more.
- Typical properties (Median) charge around $80 per night.
- Entry-level properties (Bottom 25%) earn around $28 per night.
Average Daily Rate (ADR) Trend by Month in Dorchester
Get Live Dorchester Market Intelligence 👇

Explore Real-time Analytics
Airbnb Seasonality Analysis & Trends in Dorchester (2026)
Peak Season (October, February, August)
- Revenue averages $1,864 per month
- Occupancy rates average 39.6%
- Daily rates average $97
Shoulder Season
- Revenue averages $1,258 per month
- Occupancy maintains around 26.2%
- Daily rates hold near $90
Low Season (March, May, June)
- Revenue drops to average $965 per month
- Occupancy decreases to average 21.8%
- Daily rates adjust to average $98
Seasonality Insights for Dorchester
- The Airbnb seasonality in Dorchester shows highly seasonal trends requiring careful strategy. While the sections above show seasonal averages, it's also insightful to look at the extremes:
- During the high season, the absolute peak month showcases Dorchester's highest earning potential, with monthly revenues capable of climbing to $1,941, occupancy reaching a high of 43.5%, and ADRs peaking at $102.
- Conversely, the slowest single month of the year, typically falling within the low season, marks the market's lowest point. In this month, revenue might dip to $798, occupancy could drop to 17.3%, and ADRs may adjust down to $85.
- Understanding both the seasonal averages and these monthly peaks and troughs in revenue, occupancy, and ADR is crucial for maximizing your Airbnb profit potential in Dorchester.
Seasonal Strategies for Maximizing Profit
- Peak Season: Maximize revenue through premium pricing and potentially longer minimum stays. Ensure high availability.
- Low Season: Offer competitive pricing, special promotions (e.g., extended stay discounts), and flexible cancellation policies. Target off-season travelers like remote workers or budget-conscious guests.
- Shoulder Seasons: Implement dynamic pricing that balances peak and low rates. Target weekend travelers or specific events. Offer slightly more flexible terms than peak season.
- Regularly analyze your own performance against these Dorchester seasonality benchmarks and adjust your pricing and availability strategy accordingly.
Best Areas for Airbnb Investment in Dorchester (2026)
Exploring the top neighborhoods for short-term rentals in Dorchester? This section highlights key areas, outlining why they are attractive for hosts and guests, along with notable local attractions. Consider these locations based on your target guest profile and investment strategy.
| Neighborhood / Area | Why Host Here? (Target Guests & Appeal) | Key Attractions & Landmarks |
|---|---|---|
| Lake Winnipesaukee | A popular vacation destination known for its beautiful lake and outdoor recreational activities. Ideal for families and those seeking summer getaways with water sports, hiking, and stunning views. | Weirs Beach, Moultonborough Bay, Funspot, Silver Sands State Park, Castle in the Clouds |
| Mount Washington Region | Home to the highest peak in the northeastern United States, this area attracts outdoor enthusiasts year-round. Perfect for skiing in the winter and hiking in the summer, making it a great spot for nature lovers. | Mount Washington Observatory, Crawford Notch State Park, Cannon Mountain, Bretton Woods, Pinkham Notch |
| North Conway | Known for its charming village and outlet shopping, North Conway is a favorite among families and shoppers. It also serves as a gateway to the White Mountains and various outdoor activities. | Settlers Green Outlet Village, Mount Cranmore, White Mountain National Forest, Cathedral Ledge, Saco River |
| Franconia Notch State Park | A stunning area with natural beauty and plenty of outdoor activities. Ideal for hiking, sightseeing, and enjoying the outdoors, making it appealing to adventure seekers. | Flume Gorge, Old Man of the Mountain, Cannon Mountain Aerial Tramway, Profile Lake, Echo Lake |
| Holderness | Located on the western shore of Squam Lake, this area offers a peaceful retreat and access to water activities. Attracts visitors looking for relaxation and nature. | Squam Lake, Loon Sanctuary, Chocorua Lake, White Oak Pond, Plymouth State University |
| Wolfeboro | Often referred to as the 'Oldest Summer Resort in America', Wolfeboro is a charming lakeside town with a relaxing atmosphere, perfect for tourists looking for quaint experiences. | Wolfeboro Town Dock, Brewster Academy, Lake Wentworth, Wolfeboro Falls, NH Boat Museum |
| Conway | Offers a mix of outdoor adventures and shopping opportunities. The town provides a great base for exploring the surrounding mountains and is popular all year round. | Kahuna Laguna Water Park, Conway Scenic Railroad, Echo Lake, Pequawket Park, Cranmore Mountain Resort |
| Ashland | Nestled between Squam Lake and the Pemi River, Ashland is ideal for those looking for a small-town experience with access to nature and recreational activities. | Squam Lakes Natural Science Center, Pemi River, Ashland Fish and Game Club, Plymouth State University, White Mountain National Forest |
Understanding Airbnb License Requirements & STR Laws in Dorchester (2026)
While Dorchester, New Hampshire, United States currently shows low STR regulations, specific Airbnb license requirements might still exist or change. Always verify the latest short term rental regulations and Airbnb license requirements directly with local government authorities for Dorchester to ensure full compliance before hosting.
(Source: AirROI data, 2026, finding no licensed listings among those analyzed)
Top Performing Airbnb Properties in Dorchester (2026)
Benchmark your potential! Explore examples of top-performing Airbnb properties in Dorchesterbased on Trailing Twelve Month (TTM) revenue. Analyze their characteristics, revenue, occupancy rate, and ADR to understand what drives success in this market.

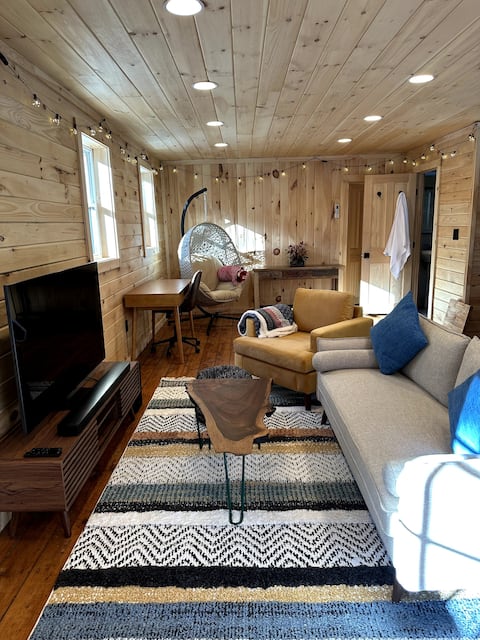
Treehouse Cabin in Dorchester
Entire Place • N/A
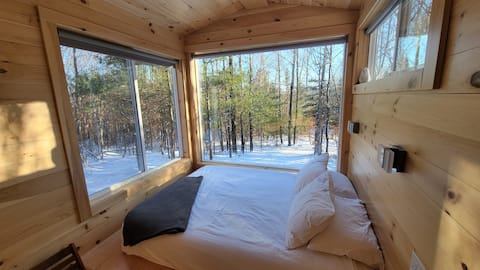
Stylish Cabin in Dorchester
Entire Place • 1 bedroom
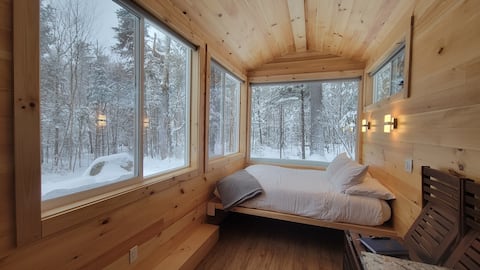
Trailside Stays - Tiny House in the Woods-Escape to Nature. Snow Owl
Entire Place • 1 bedroom
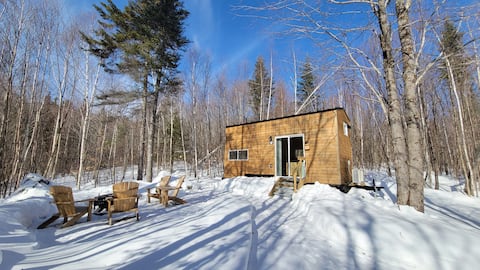
Trailside Stays - Tiny House in the Woods-Blue Jay
Entire Place • 1 bedroom
Trailside Stays- Tiny House in the Woods-Chickadee
Entire Place • 1 bedroom
Trailside Stays - Tiny House in the Woods-Escape to Nature. Robin
Entire Place • 1 bedroom
Note: Performance varies based on location, size, amenities, seasonality, and management quality. Data reflects the past 12 months.
Top Performing Airbnb Hosts in Dorchester (2026)
Learn from the best! This table showcases top-performing Airbnb hosts in Dorchester based on the number of properties managed and estimated total revenue over the past year. Analyze their scale and performance metrics.
| Host Name | Properties | Grossing Revenue | Stay Reviews | Avg Rating |
|---|---|---|---|---|
| Bryan | 5 | $130,765 | 663 | 4.98/5.0 |
| Joseph | 2 | $109,896 | 173 | 5.00/5.0 |
| Streeter Mountain | 15 | $22,630 | 418 | 4.77/5.0 |
| Susan | 1 | $6,840 | 36 | 4.92/5.0 |
Analyzing the strategies of top hosts, such as their property selection, pricing, and guest communication, can offer valuable lessons for optimizing your own Airbnb operations in Dorchester.
Dive Deeper: Advanced Dorchester STR Market Data (2026)
Ready to unlock more insights? AirROI provides access to advanced metrics and comprehensive Airbnb data for Dorchester. Explore detailed analytics beyond this report to refine your investment strategy, optimize pricing, and maximize your vacation rental profits.
Explore Advanced MetricsDorchester Short-Term Rental Market Composition (2026): Property & Room Types
Room Type Distribution
Property Type Distribution
Market Composition Insights for Dorchester
- The Dorchester Airbnb market composition is heavily skewed towards Entire Home/Apt listings, which make up 82.6% of the 23 active rentals. This indicates strong guest preference for privacy and space.
- Looking at the property type distribution in Dorchester, Outdoor/Unique properties are the most common (56.5%), reflecting the local real estate landscape.
- Houses represent a significant 34.8% portion, catering likely to families or larger groups.
- Smaller segments like hotel/boutique, unique stays (combined 8.6%) offer potential for unique stay experiences.
Dorchester Airbnb Room Capacity Analysis (2026): Bedroom Distribution
Distribution of Listings by Number of Bedrooms
Room Capacity Insights for Dorchester
- The dominant room capacity in Dorchester is 1 bedroom listings, making up 39.1% of the market. This suggests a strong demand for properties suitable for couples or solo travelers.
Dorchester Vacation Rental Guest Capacity Trends (2026)
Distribution of Listings by Guest Capacity
Guest Capacity Insights for Dorchester
- The most common guest capacity trend in Dorchester vacation rentals is listings accommodating 4 guests (26.1%). This suggests the primary traveler segment is likely small families or groups.
- Properties designed for 4 guests and 2 guests dominate the Dorchester STR market, accounting for 52.2% of listings.
- 26.0% of properties accommodate 6+ guests, serving the market segment for larger families or group travel in Dorchester.
- On average, properties in Dorchester are equipped to host 3.9 guests.
Dorchester Airbnb Booking Patterns (2026): Available vs. Booked Days
Available Days Distribution
Booked Days Distribution
Booking Pattern Insights for Dorchester
- The most common availability pattern in Dorchester falls within the 271-366 days range, representing 65.2% of listings. This suggests many properties have significant open periods on their calendars.
- Approximately 91.3% of listings show high availability (181+ days open annually), indicating potential for increased bookings or specific owner usage patterns.
- For booked days, the 1-30 days range is most frequent in Dorchester (43.5%), reflecting common guest stay durations or potential owner blocking patterns.
- A notable 8.7% of properties secure long booking periods (181+ days booked per year), highlighting successful long-term rental strategies or significant owner usage.
Dorchester Airbnb Minimum Stay Requirements Analysis
Distribution of Listings by Minimum Night Requirement
1 Night
15 listings
65.2% of total
2 Nights
1 listings
4.3% of total
30+ Nights
7 listings
30.4% of total
Key Insights
- The most prevalent minimum stay requirement in Dorchester is 1 Night, adopted by 65.2% of listings. This highlights the market's preference for shorter, flexible bookings.
- A strong majority (69.5%) of the Dorchester Airbnb data shows acceptance of very short stays (1-2 nights), indicating a dynamic, high-turnover market.
- A significant segment (30.4%) caters to monthly stays (30+ nights) in Dorchester, pointing to opportunities in the extended-stay market.
Recommendations
- Align with the market by considering a 1 Night minimum stay, as 65.2% of Dorchester hosts use this setting.
- Explore offering discounts for stays of 30+ nights to attract the 30.4% of the market seeking extended stays.
- Adjust minimum nights based on seasonality – potentially shorter during low season and longer during peak demand periods in Dorchester.
Dorchester Airbnb Cancellation Policy Trends Analysis (2026)
Flexible
8 listings
34.8% of total
Moderate
15 listings
65.2% of total
Cancellation Policy Insights for Dorchester
- The prevailing Airbnb cancellation policy trend in Dorchester is Moderate, used by 65.2% of listings.
- The market strongly favors guest-friendly terms, with 100.0% of listings offering Flexible or Moderate policies. This suggests guests in Dorchester may expect booking flexibility.
Recommendations for Hosts
- Consider adopting a Moderate policy to align with the 65.2% market standard in Dorchester.
- Regularly review your cancellation policy against competitors and market demand shifts in Dorchester.
Dorchester STR Booking Lead Time Analysis (2026)
Average Booking Lead Time by Month
Booking Lead Time Insights for Dorchester
- The overall average booking lead time for vacation rentals in Dorchester is 38 days.
- Guests book furthest in advance for stays during July (average 70 days), likely coinciding with peak travel demand or local events.
- The shortest booking windows occur for stays in March (average 16 days), indicating more last-minute travel plans during this time.
- Seasonally, Summer (48 days avg.) sees the longest lead times, while Spring (23 days avg.) has the shortest, reflecting typical travel planning cycles.
Recommendations for Hosts
- Use the overall average lead time (38 days) as a baseline for your pricing and availability strategy in Dorchester.
- For July stays, consider implementing length-of-stay discounts or slightly higher rates for bookings made less than 70 days out to capitalize on advance planning.
- Target marketing efforts for the Summer season well in advance (at least 48 days) to capture early planners.
- Monitor your own booking lead times against these Dorchester averages to identify opportunities for dynamic pricing adjustments.
Popular & Essential Airbnb Amenities in Dorchester (2026)
Amenity Prevalence
Amenity Insights for Dorchester
- Essential amenities in Dorchester that guests expect include: Free parking on premises, Fire pit. Lacking these (any) could significantly impact bookings.
- Popular amenities like Outdoor dining area, Kitchen, Fire extinguisher are common but not universal. Offering these can provide a competitive edge.
Recommendations for Hosts
- Ensure your listing includes all essential amenities for Dorchester: Free parking on premises, Fire pit.
- Prioritize adding missing essentials: Fire pit.
- Consider adding popular differentiators like Outdoor dining area or Kitchen to increase appeal.
- Highlight unique or less common amenities you offer (e.g., hot tub, dedicated workspace, EV charger) in your listing description and photos.
- Regularly check competitor amenities in Dorchester to stay competitive.
Dorchester Airbnb Guest Demographics & Profile Analysis (2026)
Guest Profile Summary for Dorchester
- The typical guest profile for Airbnb in Dorchester consists of primarily domestic travelers (92%), often arriving from nearby Boston, typically belonging to the Post-2000s (Gen Z/Alpha) group (50%), primarily speaking English or Spanish.
- Domestic travelers account for 92.1% of guests.
- Key international markets include United States (92.1%) and Canada (2.9%).
- Top languages spoken are English (66%) followed by Spanish (14.9%).
- A significant demographic segment is the Post-2000s (Gen Z/Alpha) group, representing 50% of guests.
Recommendations for Hosts
- Target domestic marketing efforts towards travelers from Boston and New York.
- Tailor amenities and listing descriptions to appeal to the dominant Post-2000s (Gen Z/Alpha) demographic (e.g., highlight fast WiFi, smart home features, local guides).
- Highlight unique local experiences or amenities relevant to the primary guest profile.
- Consider seasonal promotions aligned with peak travel times for key origin markets.
Nearby Short-Term Rental Market Comparison
How does the Dorchester Airbnb market stack up against its neighbors? Compare key performance metrics like average monthly revenue, ADR, and occupancy rates in surrounding areas to understand the broader regional STR landscape.
| Market | Active Properties | Monthly Revenue | Daily Rate | Avg. Occupancy |
|---|---|---|---|---|
| Pomfret | 15 | $6,549 | $502.74 | 45% |
| Hanover | 33 | $5,826 | $1189.51 | 41% |
| North Andover | 12 | $5,625 | $440.84 | 45% |
| Nahant | 13 | $5,564 | $602.44 | 42% |
| South Berwick | 12 | $5,351 | $228.88 | 58% |
| Wellesley | 22 | $5,310 | $520.90 | 50% |
| Kennebunkport | 152 | $5,309 | $669.87 | 43% |
| Barnstead | 36 | $5,090 | $477.12 | 42% |
| Goffstown | 13 | $5,066 | $343.72 | 53% |
| Amherst | 10 | $5,003 | $366.01 | 44% |