Boonton Airbnb Market Analysis 2026: Short Term Rental Data & Vacation Rental Statistics in New Jersey, United States
Is Airbnb profitable in Boonton in 2026? Explore comprehensive Airbnb analytics for Boonton, New Jersey, United States to uncover income potential. This 2026 STR market report for Boonton, based on AirROI data from October 2024 to September 2025, reveals key trends in the niche market of 18 active listings.
Whether you're considering an Airbnb investment in Boonton, optimizing your existing vacation rental, or exploring rental arbitrage opportunities, understanding the Boonton Airbnb data is crucial. Understanding the local regulations is key to maximizing your short term rental income potential. Let's dive into the specifics.
Key Boonton Airbnb Performance Metrics Overview
Monthly Airbnb Revenue Variations & Income Potential in Boonton (2026)
Understanding the monthly revenue variations for Airbnb listings in Boonton is key to maximizing your short term rental income potential. Seasonality significantly impacts earnings. Our analysis, based on data from the past 12 months, shows that the peak revenue month for STRs in Boonton is typically June, while March often presents the lowest earnings, highlighting opportunities for strategic pricing adjustments during shoulder and low seasons. Explore the typical Airbnb income in Boonton across different performance tiers:
- Best-in-class properties (Top 10%) achieve $4,237+ monthly, often utilizing dynamic pricing and superior guest experiences.
- Strong performing properties (Top 25%) earn $3,255 or more, indicating effective management and desirable locations/amenities.
- Typical properties (Median) generate around $1,923 per month, representing the average market performance.
- Entry-level properties (Bottom 25%) see earnings around $1,027, often with potential for optimization.
Average Monthly Airbnb Earnings Trend in Boonton
Boonton Airbnb Occupancy Rate Trends (2026)
Maximize your bookings by understanding the Boonton STR occupancy trends. Seasonal demand shifts significantly influence how often properties are booked. Typically, Junesees the highest demand (peak season occupancy), while March experiences the lowest (low season). Effective strategies, like adjusting minimum stays or offering promotions, can boost occupancy during slower periods. Here's how different property tiers perform in Boonton:
- Best-in-class properties (Top 10%) achieve 76%+ occupancy, indicating high desirability and potentially optimized availability.
- Strong performing properties (Top 25%) maintain 55% or higher occupancy, suggesting good market fit and guest satisfaction.
- Typical properties (Median) have an occupancy rate around 34%.
- Entry-level properties (Bottom 25%) average 18% occupancy, potentially facing higher vacancy.
Average Monthly Occupancy Rate Trend in Boonton
Average Daily Rate (ADR) Airbnb Trends in Boonton (2026)
Effective short term rental pricing strategy in Boonton involves understanding monthly ADR fluctuations. The Average Daily Rate (ADR) for Airbnb in Boonton typically peaks in December and dips lowest during April. Leveraging Airbnb dynamic pricing tools or strategies based on this seasonality can significantly boost revenue. Here's a look at the typical nightly rates achieved:
- Best-in-class properties (Top 10%) command rates of $239+ per night, often due to premium features or locations.
- Strong performing properties (Top 25%) achieve nightly rates of $205 or more.
- Typical properties (Median) charge around $178 per night.
- Entry-level properties (Bottom 25%) earn around $135 per night.
Average Daily Rate (ADR) Trend by Month in Boonton
Get Live Boonton Market Intelligence 👇
Explore Real-time Analytics
Airbnb Seasonality Analysis & Trends in Boonton (2025)
Peak Season (June, December, July)
- Revenue averages $3,102 per month
- Occupancy rates average 47.6%
- Daily rates average $184
Shoulder Season
- Revenue averages $2,187 per month
- Occupancy maintains around 40.7%
- Daily rates hold near $164
Low Season (March, May, September)
- Revenue drops to average $1,605 per month
- Occupancy decreases to average 29.2%
- Daily rates adjust to average $165
Seasonality Insights for Boonton
- The Airbnb seasonality in Boonton shows highly seasonal trends requiring careful strategy. While the sections above show seasonal averages, it's also insightful to look at the extremes:
- During the high season, the absolute peak month showcases Boonton's highest earning potential, with monthly revenues capable of climbing to $3,602, occupancy reaching a high of 57.1%, and ADRs peaking at $198.
- Conversely, the slowest single month of the year, typically falling within the low season, marks the market's lowest point. In this month, revenue might dip to $1,533, occupancy could drop to 28.8%, and ADRs may adjust down to $155.
- Understanding both the seasonal averages and these monthly peaks and troughs in revenue, occupancy, and ADR is crucial for maximizing your Airbnb profit potential in Boonton.
Seasonal Strategies for Maximizing Profit
- Peak Season: Maximize revenue through premium pricing and potentially longer minimum stays. Ensure high availability.
- Low Season: Offer competitive pricing, special promotions (e.g., extended stay discounts), and flexible cancellation policies. Target off-season travelers like remote workers or budget-conscious guests.
- Shoulder Seasons: Implement dynamic pricing that balances peak and low rates. Target weekend travelers or specific events. Offer slightly more flexible terms than peak season.
- Regularly analyze your own performance against these Boonton seasonality benchmarks and adjust your pricing and availability strategy accordingly.
Best Areas for Airbnb Investment in Boonton (2026)
Exploring the top neighborhoods for short-term rentals in Boonton? This section highlights key areas, outlining why they are attractive for hosts and guests, along with notable local attractions. Consider these locations based on your target guest profile and investment strategy.
| Neighborhood / Area | Why Host Here? (Target Guests & Appeal) | Key Attractions & Landmarks |
|---|---|---|
| Downtown Boonton | The vibrant heart of Boonton featuring local shops, restaurants, and the iconic Boonton Falls. A great spot for families and tourists looking for a cozy small-town atmosphere with easy access to local events. | Boonton Falls, Historic Boonton Main Street, Boonton Historical Society and Museum, Morris Canal Park |
| Rockaway River | A beautiful area along the river that offers scenic views, recreational activities, and potential for nature-focused retreats. It's appealing for guests looking for tranquility near water. | Rockaway River Park, Fishing spots, Walking trails, Nature observation areas |
| Boonton Township | A more suburban setting that offers a quieter escape from city life. Ideal for families or guests wanting to enjoy outdoor activities in a peaceful environment. | Tourne County Park, Shopping and dining in nearby Morris County, Hiking trails, Beautiful residential areas |
| Kinnelon Road | This area features large homes and is close to recreational parks, making it a good spot for guests looking for spacious accommodations. | Local parks, Nature trails, Hiking, Private lake access |
| East Boonton | A peaceful neighborhood area that attracts visitors looking for residential-style stays while being close to the action of downtown Boonton. | Local shops, Nearby parks, Community events |
| Morris County | As a larger surrounding region, Morris County includes Boonton and offers diverse activities ranging from historical sites to natural parks, attracting a variety of travelers. | Morris Museum, Hacklebarney State Park, The Great Swamp, Shopping centers |
| Mountain Lakes | A picturesque lakeside community nearby, great for guests seeking a serene getaway with outdoor activities around the lake and park. | Mountain Lakes and Park, Local cafes and restaurants, Scenic neighborhoods |
| Randolph | A growing suburban area with family-friendly attractions, parks, and a community-oriented atmosphere, ideal for Airbnb hosting. | Randolph Park, Shopping centers, Family activities, Local festivals |
Understanding Airbnb License Requirements & STR Laws in Boonton (2026)
With 11% of listings showing registration in 2026, understanding potential Airbnb license requirements is crucial in Boonton. Always verify the latest short term rental regulations and Airbnb license requirements directly with local government authorities for Boonton to ensure full compliance before hosting.
(Source: AirROI data, 2026, based on 11% licensed listings)
Top Performing Airbnb Properties in Boonton (2026)
Benchmark your potential! Explore examples of top-performing Airbnb properties in Boontonbased on Trailing Twelve Month (TTM) revenue. Analyze their characteristics, revenue, occupancy rate, and ADR to understand what drives success in this market.
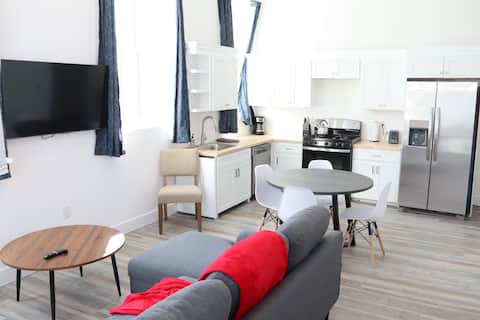
Brand New Luxury 2BR/2BA Unit
Entire Place • 2 bedrooms
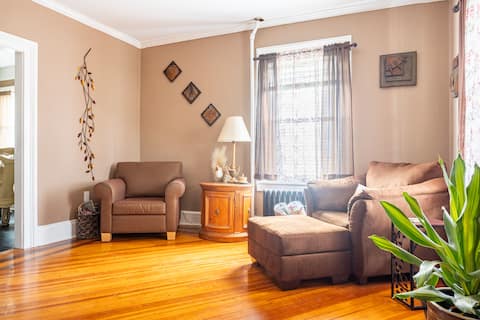
The Boonton Revival- A restored treasure in NJ
Entire Place • 2 bedrooms
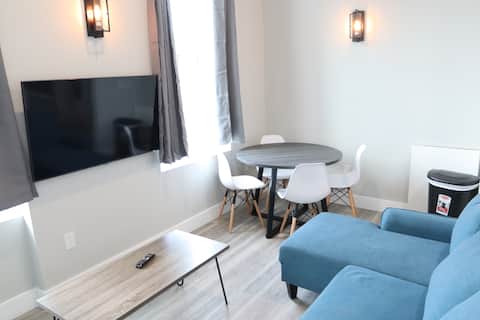
Gorgeous New 2BR/3BA Steps2Train
Entire Place • 2 bedrooms

Bright Stylish Cozy Home in NYC Suburb w/10 beds
Entire Place • 3 bedrooms
Brand New Luxury 2BR/2BA Unit
Entire Place • 2 bedrooms
Luxury 2BR 3BA near to Train!
Entire Place • 2 bedrooms
Note: Performance varies based on location, size, amenities, seasonality, and management quality. Data reflects the past 12 months.
Top Performing Airbnb Hosts in Boonton (2026)
Learn from the best! This table showcases top-performing Airbnb hosts in Boonton based on the number of properties managed and estimated total revenue over the past year. Analyze their scale and performance metrics.
| Host Name | Properties | Grossing Revenue | Stay Reviews | Avg Rating |
|---|---|---|---|---|
| Robert | 13 | $194,994 | 112 | 3.90/5.0 |
| Eugene | 1 | $36,291 | 179 | 4.93/5.0 |
| Nic | 1 | $35,080 | 93 | 4.77/5.0 |
| Ana R | 3 | $2,571 | 65 | 4.89/5.0 |
Analyzing the strategies of top hosts, such as their property selection, pricing, and guest communication, can offer valuable lessons for optimizing your own Airbnb operations in Boonton.
Dive Deeper: Advanced Boonton STR Market Data (2026)
Ready to unlock more insights? AirROI provides access to advanced metrics and comprehensive Airbnb data for Boonton. Explore detailed analytics beyond this report to refine your investment strategy, optimize pricing, and maximize your vacation rental profits.
Explore Advanced MetricsBoonton Short-Term Rental Market Composition (2026): Property & Room Types
Room Type Distribution
Property Type Distribution
Market Composition Insights for Boonton
- The Boonton Airbnb market composition is heavily skewed towards Entire Home/Apt listings, which make up 88.9% of the 18 active rentals. This indicates strong guest preference for privacy and space.
- Looking at the property type distribution in Boonton, Apartment/Condo properties are the most common (83.3%), reflecting the local real estate landscape.
- Houses represent a significant 16.7% portion, catering likely to families or larger groups.
Boonton Airbnb Room Capacity Analysis (2026): Bedroom Distribution
Distribution of Listings by Number of Bedrooms
Room Capacity Insights for Boonton
- The dominant room capacity in Boonton is 2 bedrooms listings, making up 77.8% of the market. This suggests a strong demand for properties suitable for couples or solo travelers.
- Together, 2 bedrooms and 3 bedrooms properties represent 83.4% of the active Airbnb listings in Boonton, indicating a high concentration in these sizes.
- Listings with 3+ bedrooms (5.6%) represent a smaller niche, potentially indicating an underserved market for larger group accommodations in Boonton.
Boonton Vacation Rental Guest Capacity Trends (2026)
Distribution of Listings by Guest Capacity
Guest Capacity Insights for Boonton
- The most common guest capacity trend in Boonton vacation rentals is listings accommodating 6 guests (55.6%). This suggests the primary traveler segment is likely larger groups.
- Properties designed for 6 guests and 8+ guests dominate the Boonton STR market, accounting for 72.3% of listings.
- 72.3% of properties accommodate 6+ guests, serving the market segment for larger families or group travel in Boonton.
- On average, properties in Boonton are equipped to host 5.3 guests.
Boonton Airbnb Booking Patterns (2026): Available vs. Booked Days
Available Days Distribution
Booked Days Distribution
Booking Pattern Insights for Boonton
- The most common availability pattern in Boonton falls within the 271-366 days range, representing 72.2% of listings. This suggests many properties have significant open periods on their calendars.
- Approximately 83.3% of listings show high availability (181+ days open annually), indicating potential for increased bookings or specific owner usage patterns.
- For booked days, the 31-90 days range is most frequent in Boonton (38.9%), reflecting common guest stay durations or potential owner blocking patterns.
- A notable 16.7% of properties secure long booking periods (181+ days booked per year), highlighting successful long-term rental strategies or significant owner usage.
Boonton Airbnb Minimum Stay Requirements Analysis
Distribution of Listings by Minimum Night Requirement
1 Night
1 listings
5.6% of total
3 Nights
1 listings
5.6% of total
4-6 Nights
2 listings
11.1% of total
7-29 Nights
1 listings
5.6% of total
30+ Nights
13 listings
72.2% of total
Key Insights
- The most prevalent minimum stay requirement in Boonton is 30+ Nights, adopted by 72.2% of listings. This highlights the market's preference for longer commitments.
- Very short stays (1-2 nights) are less common (5.6%), suggesting hosts prefer slightly longer bookings to optimize turnover.
- A significant segment (72.2%) caters to monthly stays (30+ nights) in Boonton, pointing to opportunities in the extended-stay market.
Recommendations
- Align with the market by considering a 30+ Nights minimum stay, as 72.2% of Boonton hosts use this setting.
- If feasible, allowing 1-night stays, especially midweek or during low season, could capture last-minute bookings, as only 5.6% currently do.
- Explore offering discounts for stays of 30+ nights to attract the 72.2% of the market seeking extended stays.
- Adjust minimum nights based on seasonality – potentially shorter during low season and longer during peak demand periods in Boonton.
Boonton Airbnb Cancellation Policy Trends Analysis (2026)
Moderate
15 listings
83.3% of total
Strict
3 listings
16.7% of total
Cancellation Policy Insights for Boonton
- The prevailing Airbnb cancellation policy trend in Boonton is Moderate, used by 83.3% of listings.
- The market strongly favors guest-friendly terms, with 83.3% of listings offering Flexible or Moderate policies. This suggests guests in Boonton may expect booking flexibility.
Recommendations for Hosts
- Consider adopting a Moderate policy to align with the 83.3% market standard in Boonton.
- Regularly review your cancellation policy against competitors and market demand shifts in Boonton.
Boonton STR Booking Lead Time Analysis (2026)
Average Booking Lead Time by Month
Booking Lead Time Insights for Boonton
- The overall average booking lead time for vacation rentals in Boonton is 15 days.
- Guests book furthest in advance for stays during September (average 70 days), likely coinciding with peak travel demand or local events.
- The shortest booking windows occur for stays in January (average 5 days), indicating more last-minute travel plans during this time.
- Seasonally, Fall (36 days avg.) sees the longest lead times, while Winter (13 days avg.) has the shortest, reflecting typical travel planning cycles.
Recommendations for Hosts
- Use the overall average lead time (15 days) as a baseline for your pricing and availability strategy in Boonton.
- For September stays, consider implementing length-of-stay discounts or slightly higher rates for bookings made less than 70 days out to capitalize on advance planning.
- During January, focus on last-minute booking availability and promotions, as guests book with very short notice (5 days avg.).
- Target marketing efforts for the Fall season well in advance (at least 36 days) to capture early planners.
- Monitor your own booking lead times against these Boonton averages to identify opportunities for dynamic pricing adjustments.
Popular & Essential Airbnb Amenities in Boonton (2026)
Amenity Prevalence
Amenity Insights for Boonton
- Essential amenities in Boonton that guests expect include: Heating, Microwave, Essentials, Hangers, Refrigerator, Carbon monoxide alarm, Wifi, Air conditioning, Smoke alarm. Lacking these (any) could significantly impact bookings.
- Popular amenities like Shampoo are common but not universal. Offering these can provide a competitive edge.
Recommendations for Hosts
- Ensure your listing includes all essential amenities for Boonton: Heating, Microwave, Essentials, Hangers, Refrigerator, Carbon monoxide alarm, Wifi, Air conditioning, Smoke alarm.
- Consider adding popular differentiators like Shampoo to increase appeal.
- Highlight unique or less common amenities you offer (e.g., hot tub, dedicated workspace, EV charger) in your listing description and photos.
- Regularly check competitor amenities in Boonton to stay competitive.
Boonton Airbnb Guest Demographics & Profile Analysis (2026)
Guest Profile Summary for Boonton
- The typical guest profile for Airbnb in Boonton consists of primarily domestic travelers (87%), often arriving from nearby Los Angeles, typically belonging to the Post-2000s (Gen Z/Alpha) group (50%), primarily speaking English or Spanish.
- Domestic travelers account for 87.4% of guests.
- Key international markets include United States (87.4%) and United Kingdom (4.2%).
- Top languages spoken are English (53.2%) followed by Spanish (15.6%).
- A significant demographic segment is the Post-2000s (Gen Z/Alpha) group, representing 50% of guests.
Recommendations for Hosts
- Target domestic marketing efforts towards travelers from Los Angeles and New York.
- Tailor amenities and listing descriptions to appeal to the dominant Post-2000s (Gen Z/Alpha) demographic (e.g., highlight fast WiFi, smart home features, local guides).
- Highlight unique local experiences or amenities relevant to the primary guest profile.
- Consider seasonal promotions aligned with peak travel times for key origin markets.
Nearby Short-Term Rental Market Comparison
How does the Boonton Airbnb market stack up against its neighbors? Compare key performance metrics like average monthly revenue, ADR, and occupancy rates in surrounding areas to understand the broader regional STR landscape.
| Market | Active Properties | Monthly Revenue | Daily Rate | Avg. Occupancy |
|---|---|---|---|---|
| Freeland | 11 | $8,629 | $695.52 | 39% |
| Berlin Township | 15 | $7,479 | $724.49 | 35% |
| Frankford Township | 12 | $5,803 | $571.00 | 44% |
| Stroud Township | 143 | $5,571 | $471.58 | 41% |
| Spring Lake Heights | 17 | $5,495 | $699.58 | 41% |
| Penn Estates | 53 | $5,233 | $406.45 | 46% |
| Town of Kingston | 13 | $5,231 | $438.70 | 46% |
| Town of Pound Ridge | 18 | $5,204 | $574.35 | 44% |
| Monmouth Beach | 13 | $5,203 | $660.27 | 40% |
| Knowlton Township | 13 | $5,101 | $358.17 | 48% |