Harvey Cedars Airbnb Market Analysis 2026: Short Term Rental Data & Vacation Rental Statistics in New Jersey, United States
Is Airbnb profitable in Harvey Cedars in 2026? Explore comprehensive Airbnb analytics for Harvey Cedars, New Jersey, United States to uncover income potential. This 2026 STR market report for Harvey Cedars, based on AirROI data from February 2025 to January 2026, reveals key trends in the niche market of 25 active listings.
Whether you're considering an Airbnb investment in Harvey Cedars, optimizing your existing vacation rental, or exploring rental arbitrage opportunities, understanding the Harvey Cedars Airbnb data is crucial. Leveraging the low regulation environment is key to maximizing your short term rental income potential. Let's dive into the specifics.
Key Harvey Cedars Airbnb Performance Metrics Overview
Monthly Airbnb Revenue Variations & Income Potential in Harvey Cedars (2026)
Understanding the monthly revenue variations for Airbnb listings in Harvey Cedars is key to maximizing your short term rental income potential. Seasonality significantly impacts earnings. Our analysis, based on data from the past 12 months, shows that the peak revenue month for STRs in Harvey Cedars is typically July, while February often presents the lowest earnings, highlighting opportunities for strategic pricing adjustments during shoulder and low seasons. Explore the typical Airbnb income in Harvey Cedars across different performance tiers:
- Best-in-class properties (Top 10%) achieve $17,046+ monthly, often utilizing dynamic pricing and superior guest experiences.
- Strong performing properties (Top 25%) earn $11,159 or more, indicating effective management and desirable locations/amenities.
- Typical properties (Median) generate around $5,465 per month, representing the average market performance.
- Entry-level properties (Bottom 25%) see earnings around $2,700, often with potential for optimization.
Average Monthly Airbnb Earnings Trend in Harvey Cedars
Harvey Cedars Airbnb Occupancy Rate Trends (2026)
Maximize your bookings by understanding the Harvey Cedars STR occupancy trends. Seasonal demand shifts significantly influence how often properties are booked. Typically, Julysees the highest demand (peak season occupancy), while February experiences the lowest (low season). Effective strategies, like adjusting minimum stays or offering promotions, can boost occupancy during slower periods. Here's how different property tiers perform in Harvey Cedars:
- Best-in-class properties (Top 10%) achieve 46%+ occupancy, indicating high desirability and potentially optimized availability.
- Strong performing properties (Top 25%) maintain 34% or higher occupancy, suggesting good market fit and guest satisfaction.
- Typical properties (Median) have an occupancy rate around 22%.
- Entry-level properties (Bottom 25%) average 11% occupancy, potentially facing higher vacancy.
Average Monthly Occupancy Rate Trend in Harvey Cedars
Average Daily Rate (ADR) Airbnb Trends in Harvey Cedars (2026)
Effective short term rental pricing strategy in Harvey Cedars involves understanding monthly ADR fluctuations. The Average Daily Rate (ADR) for Airbnb in Harvey Cedars typically peaks in January and dips lowest during April. Leveraging Airbnb dynamic pricing tools or strategies based on this seasonality can significantly boost revenue. Here's a look at the typical nightly rates achieved:
- Best-in-class properties (Top 10%) command rates of $1,763+ per night, often due to premium features or locations.
- Strong performing properties (Top 25%) achieve nightly rates of $1,207 or more.
- Typical properties (Median) charge around $779 per night.
- Entry-level properties (Bottom 25%) earn around $449 per night.
Average Daily Rate (ADR) Trend by Month in Harvey Cedars
Get Live Harvey Cedars Market Intelligence 👇

Explore Real-time Analytics
Airbnb Seasonality Analysis & Trends in Harvey Cedars (2026)
Peak Season (July, August, January)
- Revenue averages $17,186 per month
- Occupancy rates average 46.6%
- Daily rates average $991
Shoulder Season
- Revenue averages $5,986 per month
- Occupancy maintains around 20.4%
- Daily rates hold near $917
Low Season (February, March, December)
- Revenue drops to average $2,355 per month
- Occupancy decreases to average 10.6%
- Daily rates adjust to average $887
Seasonality Insights for Harvey Cedars
- The Airbnb seasonality in Harvey Cedars shows highly seasonal trends requiring careful strategy. While the sections above show seasonal averages, it's also insightful to look at the extremes:
- During the high season, the absolute peak month showcases Harvey Cedars's highest earning potential, with monthly revenues capable of climbing to $21,326, occupancy reaching a high of 56.3%, and ADRs peaking at $1,023.
- Conversely, the slowest single month of the year, typically falling within the low season, marks the market's lowest point. In this month, revenue might dip to $1,486, occupancy could drop to 9.5%, and ADRs may adjust down to $812.
- Understanding both the seasonal averages and these monthly peaks and troughs in revenue, occupancy, and ADR is crucial for maximizing your Airbnb profit potential in Harvey Cedars.
Seasonal Strategies for Maximizing Profit
- Peak Season: Maximize revenue through premium pricing and potentially longer minimum stays. Ensure high availability.
- Low Season: Offer competitive pricing, special promotions (e.g., extended stay discounts), and flexible cancellation policies. Target off-season travelers like remote workers or budget-conscious guests.
- Shoulder Seasons: Implement dynamic pricing that balances peak and low rates. Target weekend travelers or specific events. Offer slightly more flexible terms than peak season.
- Regularly analyze your own performance against these Harvey Cedars seasonality benchmarks and adjust your pricing and availability strategy accordingly.
Best Areas for Airbnb Investment in Harvey Cedars (2026)
Exploring the top neighborhoods for short-term rentals in Harvey Cedars? This section highlights key areas, outlining why they are attractive for hosts and guests, along with notable local attractions. Consider these locations based on your target guest profile and investment strategy.
| Neighborhood / Area | Why Host Here? (Target Guests & Appeal) | Key Attractions & Landmarks |
|---|---|---|
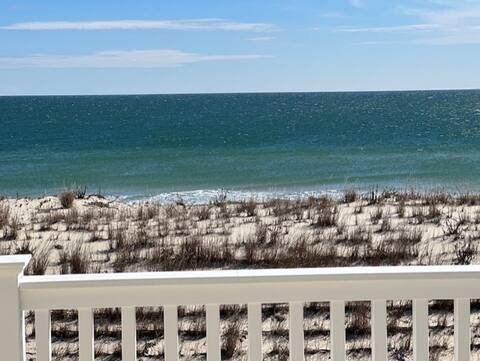
| Harvey Cedars Beach | Beautiful beach area known for its stunning views and family-friendly atmosphere. Ideal for attracting summer vacationers looking for sun and sand. | Harvey Cedars Beach, Bayview Park, Surf City, Barnegat Lighthouse State Park, Island Beach State Park, Local eateries and boutiques |
| Sunset Park | A quieter, residential area with gorgeous sunset views over the bay. Perfect for families and couples looking for a peaceful retreat. | Sunset Park, Historical Society of Harvey Cedars, Fishing and boating opportunities, Local parks, Scenic walking paths |
| LBI (Long Beach Island) | A popular vacation destination known for its beautiful beaches, lively boardwalk, and variety of activities. Attracts a diverse group of tourists. | Long Beach Island, Beach Haven, Fantasy Island Amusement Park, Barnegat Lighthouse, Shopping and dining at local shops, Water sports and rentals |
| Surf City | A vibrant beach town with a local culture, ideal for those looking to enjoy the beach and surf lifestyle. Attracts younger crowds and families alike. | Surf City Beach, Pine Street Park, Local surf shops, Restaurants and nightlife, Fishing spots |
| Brant Beach | A more relaxed beach atmosphere, appealing to people seeking a quieter beach experience. Great for families and those wanting to avoid the busier scenes. | Brant Beach, Long Beach Island Historical Museum, Sunset views, Local cafes and boutiques','Peaceful beaches |
| Holgate | A serene area with natural beauty and wildlife. Ideal for eco-tourists and those looking for a unique, nature-oriented stay. | Holgate Wildlife Refuge, Simple beach access, Nature trails, Bird watching, Low-key local dining |
| North Beach | A beautiful area that is less crowded and offers pristine beaches. Great for relaxation and enjoying the sun away from the more touristy spots. | North Beach, Secluded beaches, Local nature trails, Nearby shops and cafes |
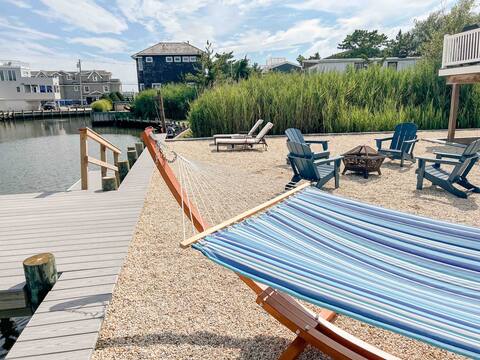
| Beach Haven West | A residential area popular for its waterways and boating activities. Great for families and individuals looking for a longer-term rental. | Waterfront access, Local boat rentals, Parks and recreational areas, Fishing spots, Quiet neighborhoods |
Understanding Airbnb License Requirements & STR Laws in Harvey Cedars (2026)
While Harvey Cedars, New Jersey, United States currently shows low STR regulations, specific Airbnb license requirements might still exist or change. Always verify the latest short term rental regulations and Airbnb license requirements directly with local government authorities for Harvey Cedars to ensure full compliance before hosting.
(Source: AirROI data, 2026, finding no licensed listings among those analyzed)
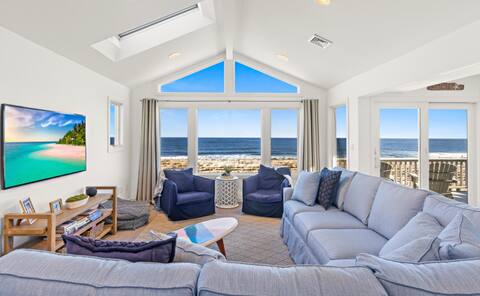
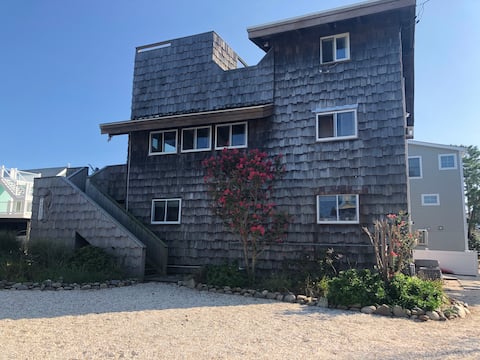
Top Performing Airbnb Properties in Harvey Cedars (2026)
Benchmark your potential! Explore examples of top-performing Airbnb properties in Harvey Cedarsbased on Trailing Twelve Month (TTM) revenue. Analyze their characteristics, revenue, occupancy rate, and ADR to understand what drives success in this market.
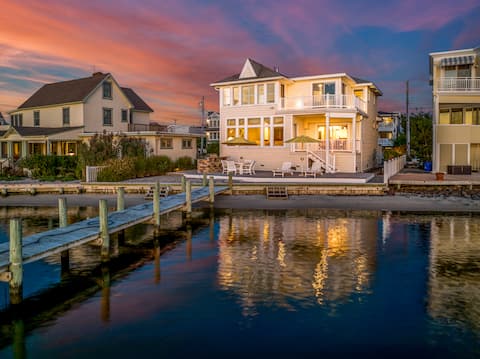
Oceanfront Sea La Vie!
Entire Place • 6 bedrooms
Waterfront LBI Home - Under 5 min walk to Beach!
Entire Place • 3 bedrooms
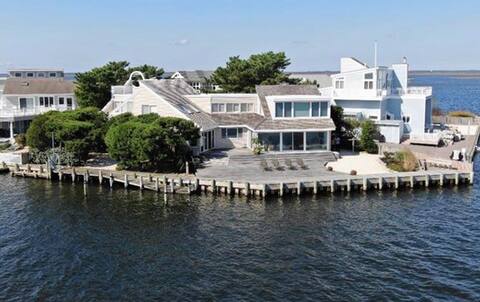
Stunning bayfront w/private bay beach and dock
Entire Place • 5 bedrooms
Bayfront retreat - Harvey Cedars LBI
Entire Place • 5 bedrooms
Stunning Luxury Beachfront
Entire Place • 4 bedrooms
Long Beach Island-Harvey Cedars Beach House
Entire Place • 5 bedrooms
Note: Performance varies based on location, size, amenities, seasonality, and management quality. Data reflects the past 12 months.
Top Performing Airbnb Hosts in Harvey Cedars (2026)
Learn from the best! This table showcases top-performing Airbnb hosts in Harvey Cedars based on the number of properties managed and estimated total revenue over the past year. Analyze their scale and performance metrics.
| Host Name | Properties | Grossing Revenue | Stay Reviews | Avg Rating |
|---|---|---|---|---|
| Sharada | 1 | $187,198 | 41 | 4.90/5.0 |
| Michael | 1 | $165,098 | 56 | 5.00/5.0 |
| Karina | 1 | $154,785 | 3 | 5.00/5.0 |
| Meredith | 1 | $141,362 | 70 | 4.96/5.0 |
| Jennifer | 2 | $122,660 | 18 | 4.84/5.0 |
| Laren | 1 | $88,887 | 3 | 5.00/5.0 |
| Lisa | 1 | $79,273 | 55 | 4.91/5.0 |
| Steven | 1 | $76,480 | 1 | Not Rated |
| George | 1 | $65,284 | 19 | 5.00/5.0 |
| Jodi | 1 | $60,031 | 3 | 5.00/5.0 |
Analyzing the strategies of top hosts, such as their property selection, pricing, and guest communication, can offer valuable lessons for optimizing your own Airbnb operations in Harvey Cedars.
Dive Deeper: Advanced Harvey Cedars STR Market Data (2026)
Ready to unlock more insights? AirROI provides access to advanced metrics and comprehensive Airbnb data for Harvey Cedars. Explore detailed analytics beyond this report to refine your investment strategy, optimize pricing, and maximize your vacation rental profits.
Explore Advanced MetricsHarvey Cedars Short-Term Rental Market Composition (2026): Property & Room Types
Room Type Distribution
Property Type Distribution
Market Composition Insights for Harvey Cedars
- The Harvey Cedars Airbnb market composition is heavily skewed towards Entire Home/Apt listings, which make up 96% of the 25 active rentals. This indicates strong guest preference for privacy and space.
- Looking at the property type distribution in Harvey Cedars, House properties are the most common (88%), reflecting the local real estate landscape.
- Houses represent a significant 88% portion, catering likely to families or larger groups.
Harvey Cedars Airbnb Room Capacity Analysis (2026): Bedroom Distribution
Distribution of Listings by Number of Bedrooms
Room Capacity Insights for Harvey Cedars
- The dominant room capacity in Harvey Cedars is 5+ bedrooms listings, making up 36% of the market. This suggests a strong demand for properties suitable for families or small groups.
- Together, 5+ bedrooms and 4 bedrooms properties represent 60.0% of the active Airbnb listings in Harvey Cedars, indicating a high concentration in these sizes.
- A significant 84.0% of listings offer 3+ bedrooms, catering to larger groups and families seeking more space in Harvey Cedars.
Harvey Cedars Vacation Rental Guest Capacity Trends (2026)
Distribution of Listings by Guest Capacity
Guest Capacity Insights for Harvey Cedars
- The most common guest capacity trend in Harvey Cedars vacation rentals is listings accommodating 8+ guests (68%). This suggests the primary traveler segment is likely larger groups.
- Properties designed for 8+ guests and 6 guests dominate the Harvey Cedars STR market, accounting for 84.0% of listings.
- 88.0% of properties accommodate 6+ guests, serving the market segment for larger families or group travel in Harvey Cedars.
- On average, properties in Harvey Cedars are equipped to host 7.0 guests.
Harvey Cedars Airbnb Booking Patterns (2026): Available vs. Booked Days
Available Days Distribution
Booked Days Distribution
Booking Pattern Insights for Harvey Cedars
- The most common availability pattern in Harvey Cedars falls within the 271-366 days range, representing 80% of listings. This suggests many properties have significant open periods on their calendars.
- Approximately 100.0% of listings show high availability (181+ days open annually), indicating potential for increased bookings or specific owner usage patterns.
- For booked days, the 31-90 days range is most frequent in Harvey Cedars (40%), reflecting common guest stay durations or potential owner blocking patterns.
Harvey Cedars Airbnb Minimum Stay Requirements Analysis
Distribution of Listings by Minimum Night Requirement
2 Nights
3 listings
12% of total
3 Nights
2 listings
8% of total
4-6 Nights
10 listings
40% of total
7-29 Nights
3 listings
12% of total
30+ Nights
7 listings
28% of total
Key Insights
- The most prevalent minimum stay requirement in Harvey Cedars is 4-6 Nights, adopted by 40% of listings. This highlights the market's preference for longer commitments.
- Very short stays (1-2 nights) are less common (12.0%), suggesting hosts prefer slightly longer bookings to optimize turnover.
- A significant segment (28%) caters to monthly stays (30+ nights) in Harvey Cedars, pointing to opportunities in the extended-stay market.
Recommendations
- Align with the market by considering a 4-6 Nights minimum stay, as 40% of Harvey Cedars hosts use this setting.
- Explore offering discounts for stays of 30+ nights to attract the 28% of the market seeking extended stays.
- Adjust minimum nights based on seasonality – potentially shorter during low season and longer during peak demand periods in Harvey Cedars.
Harvey Cedars Airbnb Cancellation Policy Trends Analysis (2026)
Moderate
2 listings
8% of total
Firm
11 listings
44% of total
Strict
12 listings
48% of total
Cancellation Policy Insights for Harvey Cedars
- The prevailing Airbnb cancellation policy trend in Harvey Cedars is Strict, used by 48% of listings.
- A majority (92.0%) of hosts in Harvey Cedars utilize Firm or Strict policies, indicating a market where hosts prioritize booking security.
Recommendations for Hosts
- Consider adopting a Strict policy to align with the 48% market standard in Harvey Cedars.
- With 48% using Strict terms, this is a viable option in Harvey Cedars, particularly for high-value properties or during peak demand periods.
- Regularly review your cancellation policy against competitors and market demand shifts in Harvey Cedars.
Harvey Cedars STR Booking Lead Time Analysis (2026)
Average Booking Lead Time by Month
Booking Lead Time Insights for Harvey Cedars
- The overall average booking lead time for vacation rentals in Harvey Cedars is 80 days.
- Guests book furthest in advance for stays during August (average 125 days), likely coinciding with peak travel demand or local events.
- The shortest booking windows occur for stays in April (average 35 days), indicating more last-minute travel plans during this time.
- Seasonally, Summer (108 days avg.) sees the longest lead times, while Spring (54 days avg.) has the shortest, reflecting typical travel planning cycles.
Recommendations for Hosts
- Use the overall average lead time (80 days) as a baseline for your pricing and availability strategy in Harvey Cedars.
- For August stays, consider implementing length-of-stay discounts or slightly higher rates for bookings made less than 125 days out to capitalize on advance planning.
- Target marketing efforts for the Summer season well in advance (at least 108 days) to capture early planners.
- Monitor your own booking lead times against these Harvey Cedars averages to identify opportunities for dynamic pricing adjustments.
Popular & Essential Airbnb Amenities in Harvey Cedars (2026)
Amenity Prevalence
Amenity Insights for Harvey Cedars
- Essential amenities in Harvey Cedars that guests expect include: Air conditioning, Fire extinguisher, Carbon monoxide alarm, Wifi, Free parking on premises, Smoke alarm, TV, Kitchen. Lacking these (any) could significantly impact bookings.
- Popular amenities like Washer, Heating are common but not universal. Offering these can provide a competitive edge.
Recommendations for Hosts
- Ensure your listing includes all essential amenities for Harvey Cedars: Air conditioning, Fire extinguisher, Carbon monoxide alarm, Wifi, Free parking on premises, Smoke alarm, TV, Kitchen.
- Prioritize adding missing essentials: Kitchen.
- Consider adding popular differentiators like Washer or Heating to increase appeal.
- Highlight unique or less common amenities you offer (e.g., hot tub, dedicated workspace, EV charger) in your listing description and photos.
- Regularly check competitor amenities in Harvey Cedars to stay competitive.
Harvey Cedars Airbnb Guest Demographics & Profile Analysis (2026)
Guest Profile Summary for Harvey Cedars
- The typical guest profile for Airbnb in Harvey Cedars consists of primarily domestic travelers (98%), often arriving from nearby New York, typically belonging to the Post-2000s (Gen Z/Alpha) group (50%), primarily speaking English or French.
- Domestic travelers account for 98.1% of guests.
- Key international markets include United States (98.1%) and United Kingdom (1.9%).
- Top languages spoken are English (69.2%) followed by French (23.1%).
- A significant demographic segment is the Post-2000s (Gen Z/Alpha) group, representing 50% of guests.
Recommendations for Hosts
- Target domestic marketing efforts towards travelers from New York and Philadelphia.
- Tailor amenities and listing descriptions to appeal to the dominant Post-2000s (Gen Z/Alpha) demographic (e.g., highlight fast WiFi, smart home features, local guides).
- Highlight unique local experiences or amenities relevant to the primary guest profile.
- Consider seasonal promotions aligned with peak travel times for key origin markets.
Nearby Short-Term Rental Market Comparison
How does the Harvey Cedars Airbnb market stack up against its neighbors? Compare key performance metrics like average monthly revenue, ADR, and occupancy rates in surrounding areas to understand the broader regional STR landscape.
| Market | Active Properties | Monthly Revenue | Daily Rate | Avg. Occupancy |
|---|---|---|---|---|
| Spring Lake Heights | 16 | $5,785 | $725.20 | 40% |
| Hilltown Township | 11 | $5,557 | $578.96 | 40% |
| Cape May Point | 23 | $5,479 | $542.19 | 46% |
| Stone Harbor | 42 | $5,467 | $785.22 | 39% |
| Neptune City | 12 | $5,299 | $531.14 | 45% |
| Monmouth Beach | 12 | $5,209 | $794.91 | 38% |
| Cape May | 334 | $5,029 | $553.79 | 42% |
| Surf City | 47 | $5,004 | $715.29 | 44% |
| Avalon | 84 | $4,853 | $699.96 | 38% |
| Lambertville | 54 | $4,849 | $359.53 | 50% |