Newark Airbnb Market Analysis 2026: Short Term Rental Data & Vacation Rental Statistics in New Jersey, United States
Is Airbnb profitable in Newark in 2026? Explore comprehensive Airbnb analytics for Newark, New Jersey, United States to uncover income potential. This 2026 STR market report for Newark, based on AirROI data from February 2025 to January 2026, reveals key trends in the bustling market of 1,346 active listings.
Whether you're considering an Airbnb investment in Newark, optimizing your existing vacation rental, or exploring rental arbitrage opportunities, understanding the Newark Airbnb data is crucial. Leveraging the low regulation environment is key to maximizing your short term rental income potential. Let's dive into the specifics.
Key Newark Airbnb Performance Metrics Overview
Monthly Airbnb Revenue Variations & Income Potential in Newark (2026)
Understanding the monthly revenue variations for Airbnb listings in Newark is key to maximizing your short term rental income potential. Seasonality significantly impacts earnings. Our analysis, based on data from the past 12 months, shows that the peak revenue month for STRs in Newark is typically December, while January often presents the lowest earnings, highlighting opportunities for strategic pricing adjustments during shoulder and low seasons. Explore the typical Airbnb income in Newark across different performance tiers:
- Best-in-class properties (Top 10%) achieve $4,914+ monthly, often utilizing dynamic pricing and superior guest experiences.
- Strong performing properties (Top 25%) earn $3,154 or more, indicating effective management and desirable locations/amenities.
- Typical properties (Median) generate around $1,482 per month, representing the average market performance.
- Entry-level properties (Bottom 25%) see earnings around $611, often with potential for optimization.
Average Monthly Airbnb Earnings Trend in Newark
Newark Airbnb Occupancy Rate Trends (2026)
Maximize your bookings by understanding the Newark STR occupancy trends. Seasonal demand shifts significantly influence how often properties are booked. Typically, Junesees the highest demand (peak season occupancy), while January experiences the lowest (low season). Effective strategies, like adjusting minimum stays or offering promotions, can boost occupancy during slower periods. Here's how different property tiers perform in Newark:
- Best-in-class properties (Top 10%) achieve 82%+ occupancy, indicating high desirability and potentially optimized availability.
- Strong performing properties (Top 25%) maintain 67% or higher occupancy, suggesting good market fit and guest satisfaction.
- Typical properties (Median) have an occupancy rate around 45%.
- Entry-level properties (Bottom 25%) average 21% occupancy, potentially facing higher vacancy.
Average Monthly Occupancy Rate Trend in Newark
Average Daily Rate (ADR) Airbnb Trends in Newark (2026)
Effective short term rental pricing strategy in Newark involves understanding monthly ADR fluctuations. The Average Daily Rate (ADR) for Airbnb in Newark typically peaks in December and dips lowest during February. Leveraging Airbnb dynamic pricing tools or strategies based on this seasonality can significantly boost revenue. Here's a look at the typical nightly rates achieved:
- Best-in-class properties (Top 10%) command rates of $277+ per night, often due to premium features or locations.
- Strong performing properties (Top 25%) achieve nightly rates of $192 or more.
- Typical properties (Median) charge around $104 per night.
- Entry-level properties (Bottom 25%) earn around $60 per night.
Average Daily Rate (ADR) Trend by Month in Newark
Get Live Newark Market Intelligence 👇

Explore Real-time Analytics
Airbnb Seasonality Analysis & Trends in Newark (2026)
Peak Season (December, June, July)
- Revenue averages $2,722 per month
- Occupancy rates average 50.3%
- Daily rates average $154
Shoulder Season
- Revenue averages $2,307 per month
- Occupancy maintains around 46.5%
- Daily rates hold near $149
Low Season (January, February, March)
- Revenue drops to average $1,509 per month
- Occupancy decreases to average 35.8%
- Daily rates adjust to average $141
Seasonality Insights for Newark
- The Airbnb seasonality in Newark shows highly seasonal trends requiring careful strategy. While the sections above show seasonal averages, it's also insightful to look at the extremes:
- During the high season, the absolute peak month showcases Newark's highest earning potential, with monthly revenues capable of climbing to $3,013, occupancy reaching a high of 52.2%, and ADRs peaking at $166.
- Conversely, the slowest single month of the year, typically falling within the low season, marks the market's lowest point. In this month, revenue might dip to $1,237, occupancy could drop to 24.5%, and ADRs may adjust down to $135.
- Understanding both the seasonal averages and these monthly peaks and troughs in revenue, occupancy, and ADR is crucial for maximizing your Airbnb profit potential in Newark.
Seasonal Strategies for Maximizing Profit
- Peak Season: Maximize revenue through premium pricing and potentially longer minimum stays. Ensure high availability.
- Low Season: Offer competitive pricing, special promotions (e.g., extended stay discounts), and flexible cancellation policies. Target off-season travelers like remote workers or budget-conscious guests.
- Shoulder Seasons: Implement dynamic pricing that balances peak and low rates. Target weekend travelers or specific events. Offer slightly more flexible terms than peak season.
- Regularly analyze your own performance against these Newark seasonality benchmarks and adjust your pricing and availability strategy accordingly.
Best Areas for Airbnb Investment in Newark (2026)
Exploring the top neighborhoods for short-term rentals in Newark? This section highlights key areas, outlining why they are attractive for hosts and guests, along with notable local attractions. Consider these locations based on your target guest profile and investment strategy.
| Neighborhood / Area | Why Host Here? (Target Guests & Appeal) | Key Attractions & Landmarks |
|---|---|---|
| Ironbound | Famous for its diverse culture and Portuguese cuisine. This neighborhood is vibrant and attracts food lovers and tourists seeking authentic experiences. | Branch Brook Park, Newark Museum of Art, Ironbound district restaurants, Riverfront Park, Seafood markets |
| Downtown Newark | The central business district with a balance of residential life and urban attractions. Hosts many events and has great access to public transport, making it ideal for business travelers. | Prudential Center, Newark Symphony Hall, Military Park, New Jersey Performing Arts Center, Newark Public Library |
| University Heights | Home to several major universities, this area attracts a large number of students and families, providing ample short-term rental opportunities. | Rutgers University, NJIT, University Hospital, St. Michael's Medical Center, Branch Brook Park |
| Ironbound | This neighborhood is known for its nightlife, dining, and cultural richness, making it a sought-after location for visitors who enjoy vibrant local experiences. | Brick City Supplies, Ironbound Community Corporation, Halsey Street, Delicious Portuguese and Spanish restaurants, Festivals and cultural events |
| North Newark | Features a mix of residential homes and parks, gaining attention for its affordability and community vibe, perfect for longer stays. | Weequahic Park, Newark Liberty International Airport, Weequahic Golf Course, Newark Bears Stadium, Historic Houses |
| East Ward | An up-and-coming area with a blend of residential and commercial spaces. Great for families and visitors looking for a quieter stay. | Faith and Hope Church, Local markets, Parks and recreational centers, Nice residential neighborhoods, Cultural festivals |
| South Ward | A culturally rich community with various amenities. This area is becoming more popular for short-term rentals due to its proximity to attractions. | West Side Park, Local shops and restaurants, Cultural events, Art installations, Historic sites |
| West Ward | A diverse neighborhood that offers a unique cultural experience with various local dining and shopping options. Appealing for tourists looking for a local experience. | Columbia Park, Diverse food scene, Local art galleries, Historic architecture, Proximity to Downtown Newark |
Understanding Airbnb License Requirements & STR Laws in Newark (2026)
While Newark, New Jersey, United States currently shows low STR regulations, specific Airbnb license requirements might still exist or change. Always verify the latest short term rental regulations and Airbnb license requirements directly with local government authorities for Newark to ensure full compliance before hosting.
(Source: AirROI data, 2026, based on 6% licensed listings)
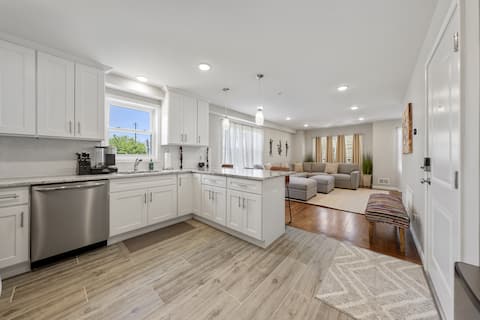
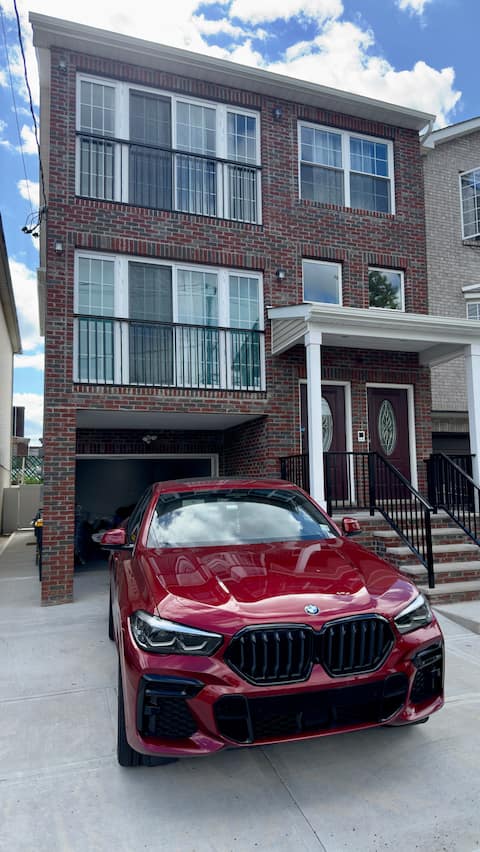
Top Performing Airbnb Properties in Newark (2026)
Benchmark your potential! Explore examples of top-performing Airbnb properties in Newarkbased on Trailing Twelve Month (TTM) revenue. Analyze their characteristics, revenue, occupancy rate, and ADR to understand what drives success in this market.

Two Apartments, One Great Stay at Newark Gem
Entire Place • 6 bedrooms
Modern Meets Culture - Newark Flagship
Entire Place • 7 bedrooms

10 bd & 5 ba | Backyard | Near NY & EWR
Entire Place • 9 bedrooms

New 6 Bdrm 4 Bthrm by Airport NJPAC American Dream
Entire Place • 6 bedrooms

Spacious group home w/ 2 kitchens & games
Entire Place • 6 bedrooms
Newark SuperHouse - Perfect for Large Groups
Entire Place • 7 bedrooms
Note: Performance varies based on location, size, amenities, seasonality, and management quality. Data reflects the past 12 months.
Top Performing Airbnb Hosts in Newark (2026)
Learn from the best! This table showcases top-performing Airbnb hosts in Newark based on the number of properties managed and estimated total revenue over the past year. Analyze their scale and performance metrics.
| Host Name | Properties | Grossing Revenue | Stay Reviews | Avg Rating |
|---|---|---|---|---|
| Joe | 17 | $803,498 | 1396 | 4.86/5.0 |
| Jorge | 12 | $645,466 | 1003 | 4.79/5.0 |
| Shaun | 14 | $571,443 | 1410 | 4.90/5.0 |
| Shelly And Abe | 13 | $486,722 | 517 | 4.91/5.0 |
| Sojourney | 12 | $414,755 | 580 | 4.77/5.0 |
| Luke | 8 | $380,906 | 394 | 4.84/5.0 |
| Perose | 10 | $333,288 | 457 | 4.53/5.0 |
| Sumana | 3 | $324,573 | 64 | 4.87/5.0 |
| Qasim | 21 | $320,719 | 220 | 4.55/5.0 |
| Skyline Manor | 4 | $312,591 | 339 | 4.92/5.0 |
Analyzing the strategies of top hosts, such as their property selection, pricing, and guest communication, can offer valuable lessons for optimizing your own Airbnb operations in Newark.
Dive Deeper: Advanced Newark STR Market Data (2026)
Ready to unlock more insights? AirROI provides access to advanced metrics and comprehensive Airbnb data for Newark. Explore detailed analytics beyond this report to refine your investment strategy, optimize pricing, and maximize your vacation rental profits.
Explore Advanced MetricsNewark Short-Term Rental Market Composition (2026): Property & Room Types
Room Type Distribution
Property Type Distribution
Market Composition Insights for Newark
- The Newark Airbnb market composition is heavily skewed towards Entire Home/Apt listings, which make up 52.4% of the 1,346 active rentals. This indicates strong guest preference for privacy and space.
- However, a notable 46.1% share for Private Rooms suggests opportunities for budget-conscious travelers or hosts renting out spare rooms.
- Looking at the property type distribution in Newark, Apartment/Condo properties are the most common (56.8%), reflecting the local real estate landscape.
- Houses represent a significant 39.8% portion, catering likely to families or larger groups.
- Smaller segments like hotel/boutique, others, outdoor/unique (combined 3.4%) offer potential for unique stay experiences.
Newark Airbnb Room Capacity Analysis (2026): Bedroom Distribution
Distribution of Listings by Number of Bedrooms
Room Capacity Insights for Newark
- The dominant room capacity in Newark is 1 bedroom listings, making up 21.9% of the market. This suggests a strong demand for properties suitable for couples or solo travelers.
- Together, 1 bedroom and 2 bedrooms properties represent 38.9% of the active Airbnb listings in Newark, indicating a high concentration in these sizes.
Newark Vacation Rental Guest Capacity Trends (2026)
Distribution of Listings by Guest Capacity
Guest Capacity Insights for Newark
- The most common guest capacity trend in Newark vacation rentals is listings accommodating 4 guests (13.3%). This suggests the primary traveler segment is likely small families or groups.
- Properties designed for 4 guests and 8+ guests dominate the Newark STR market, accounting for 24.9% of listings.
- 25.3% of properties accommodate 6+ guests, serving the market segment for larger families or group travel in Newark.
- On average, properties in Newark are equipped to host 2.9 guests.
Newark Airbnb Booking Patterns (2026): Available vs. Booked Days
Available Days Distribution
Booked Days Distribution
Booking Pattern Insights for Newark
- The most common availability pattern in Newark falls within the 271-366 days range, representing 48.8% of listings. This suggests many properties have significant open periods on their calendars.
- Approximately 79.1% of listings show high availability (181+ days open annually), indicating potential for increased bookings or specific owner usage patterns.
- For booked days, the 91-180 days range is most frequent in Newark (30.7%), reflecting common guest stay durations or potential owner blocking patterns.
- A notable 21.8% of properties secure long booking periods (181+ days booked per year), highlighting successful long-term rental strategies or significant owner usage.
Newark Airbnb Minimum Stay Requirements Analysis
Distribution of Listings by Minimum Night Requirement
1 Night
513 listings
38.1% of total
2 Nights
209 listings
15.5% of total
3 Nights
86 listings
6.4% of total
4-6 Nights
72 listings
5.3% of total
7-29 Nights
128 listings
9.5% of total
30+ Nights
338 listings
25.1% of total
Key Insights
- The most prevalent minimum stay requirement in Newark is 1 Night, adopted by 38.1% of listings. This highlights the market's preference for shorter, flexible bookings.
- A significant segment (25.1%) caters to monthly stays (30+ nights) in Newark, pointing to opportunities in the extended-stay market.
Recommendations
- Align with the market by considering a 1 Night minimum stay, as 38.1% of Newark hosts use this setting.
- Explore offering discounts for stays of 30+ nights to attract the 25.1% of the market seeking extended stays.
- Adjust minimum nights based on seasonality – potentially shorter during low season and longer during peak demand periods in Newark.
Newark Airbnb Cancellation Policy Trends Analysis (2026)
Super Strict 30 Days
56 listings
4.2% of total
Super Strict 60 Days
7 listings
0.5% of total
Limited
30 listings
2.2% of total
Flexible
300 listings
22.3% of total
Moderate
205 listings
15.2% of total
Firm
344 listings
25.6% of total
Strict
403 listings
30% of total
Cancellation Policy Insights for Newark
- The prevailing Airbnb cancellation policy trend in Newark is Strict, used by 30% of listings.
- A majority (55.6%) of hosts in Newark utilize Firm or Strict policies, indicating a market where hosts prioritize booking security.
Recommendations for Hosts
- Consider adopting a Strict policy to align with the 30% market standard in Newark.
- Regularly review your cancellation policy against competitors and market demand shifts in Newark.
Newark STR Booking Lead Time Analysis (2026)
Average Booking Lead Time by Month
Booking Lead Time Insights for Newark
- The overall average booking lead time for vacation rentals in Newark is 23 days.
- Guests book furthest in advance for stays during December (average 39 days), likely coinciding with peak travel demand or local events.
- The shortest booking windows occur for stays in February (average 16 days), indicating more last-minute travel plans during this time.
- Seasonally, Summer (27 days avg.) sees the longest lead times, while Spring (23 days avg.) has the shortest, reflecting typical travel planning cycles.
Recommendations for Hosts
- Use the overall average lead time (23 days) as a baseline for your pricing and availability strategy in Newark.
- For December stays, consider implementing length-of-stay discounts or slightly higher rates for bookings made less than 39 days out to capitalize on advance planning.
- Target marketing efforts for the Summer season well in advance (at least 27 days) to capture early planners.
- Monitor your own booking lead times against these Newark averages to identify opportunities for dynamic pricing adjustments.
Popular & Essential Airbnb Amenities in Newark (2026)
Amenity Prevalence
Amenity Insights for Newark
- Essential amenities in Newark that guests expect include: Wifi, Smoke alarm. Lacking these (any) could significantly impact bookings.
- Popular amenities like Air conditioning, Carbon monoxide alarm, TV are common but not universal. Offering these can provide a competitive edge.
Recommendations for Hosts
- Ensure your listing includes all essential amenities for Newark: Wifi, Smoke alarm.
- Prioritize adding missing essentials: Wifi, Smoke alarm.
- Consider adding popular differentiators like Air conditioning or Carbon monoxide alarm to increase appeal.
- Highlight unique or less common amenities you offer (e.g., hot tub, dedicated workspace, EV charger) in your listing description and photos.
- Regularly check competitor amenities in Newark to stay competitive.
Newark Airbnb Guest Demographics & Profile Analysis (2026)
Guest Profile Summary for Newark
- The typical guest profile for Airbnb in Newark consists of primarily domestic travelers (75%), often arriving from nearby New York, typically belonging to the Post-2000s (Gen Z/Alpha) group (50%), primarily speaking English or Spanish.
- Domestic travelers account for 75.2% of guests.
- Key international markets include United States (75.2%) and Canada (4.7%).
- Top languages spoken are English (55.5%) followed by Spanish (16.4%).
- A significant demographic segment is the Post-2000s (Gen Z/Alpha) group, representing 50% of guests.
Recommendations for Hosts
- Target domestic marketing efforts towards travelers from New York and Newark.
- Tailor amenities and listing descriptions to appeal to the dominant Post-2000s (Gen Z/Alpha) demographic (e.g., highlight fast WiFi, smart home features, local guides).
- Highlight unique local experiences or amenities relevant to the primary guest profile.
- Consider seasonal promotions aligned with peak travel times for key origin markets.
Nearby Short-Term Rental Market Comparison
How does the Newark Airbnb market stack up against its neighbors? Compare key performance metrics like average monthly revenue, ADR, and occupancy rates in surrounding areas to understand the broader regional STR landscape.
| Market | Active Properties | Monthly Revenue | Daily Rate | Avg. Occupancy |
|---|---|---|---|---|
| Freeland | 11 | $8,436 | $684.29 | 42% |
| Berlin Township | 15 | $7,208 | $729.10 | 35% |
| Town of Kingston | 10 | $6,470 | $473.76 | 49% |
| Frankford Township | 11 | $6,329 | $505.19 | 41% |
| Spring Lake Heights | 16 | $5,785 | $725.20 | 40% |
| Stroud Township | 137 | $5,728 | $478.40 | 40% |
| Town of Monroe | 22 | $5,690 | $720.52 | 37% |
| Hilltown Township | 11 | $5,557 | $578.96 | 40% |
| Stone Harbor | 42 | $5,467 | $785.22 | 39% |
| Mount Pocono | 22 | $5,346 | $485.18 | 45% |