Washington Township Airbnb Market Analysis 2025: Short Term Rental Data & Vacation Rental Statistics in New Jersey, United States
Is Airbnb profitable in Washington Township in 2025? Explore comprehensive Airbnb analytics for Washington Township, New Jersey, United States to uncover income potential. This 2025 STR market report for Washington Township, based on AirROI data from April 2024 to March 2025, reveals key trends in the niche market of 17 active listings.
Whether you're considering an Airbnb investment in Washington Township, optimizing your existing vacation rental, or exploring rental arbitrage opportunities, understanding the Washington Township Airbnb data is crucial. Leveraging the low regulation environment is key to maximizing your short term rental income potential. Let's dive into the specifics.
Key Washington Township Airbnb Performance Metrics Overview
Monthly Airbnb Revenue Variations & Income Potential in Washington Township (2025)
Understanding the monthly revenue variations for Airbnb listings in Washington Township is key to maximizing your short term rental income potential. Seasonality significantly impacts earnings. Our analysis, based on data from the past 12 months, shows that the peak revenue month for STRs in Washington Township is typically June, while March often presents the lowest earnings, highlighting opportunities for strategic pricing adjustments during shoulder and low seasons. Explore the typical Airbnb income in Washington Township across different performance tiers:
- Best-in-class properties (Top 10%) achieve $4,465+ monthly, often utilizing dynamic pricing and superior guest experiences.
- Strong performing properties (Top 25%) earn $3,143 or more, indicating effective management and desirable locations/amenities.
- Typical properties (Median) generate around $1,801 per month, representing the average market performance.
- Entry-level properties (Bottom 25%) see earnings around $613, often with potential for optimization.
Average Monthly Airbnb Earnings Trend in Washington Township
Washington Township Airbnb Occupancy Rate Trends (2025)
Maximize your bookings by understanding the Washington Township STR occupancy trends. Seasonal demand shifts significantly influence how often properties are booked. Typically, Junesees the highest demand (peak season occupancy), while March experiences the lowest (low season). Effective strategies, like adjusting minimum stays or offering promotions, can boost occupancy during slower periods. Here's how different property tiers perform in Washington Township:
- Best-in-class properties (Top 10%) achieve 75%+ occupancy, indicating high desirability and potentially optimized availability.
- Strong performing properties (Top 25%) maintain 60% or higher occupancy, suggesting good market fit and guest satisfaction.
- Typical properties (Median) have an occupancy rate around 28%.
- Entry-level properties (Bottom 25%) average 14% occupancy, potentially facing higher vacancy.
Average Monthly Occupancy Rate Trend in Washington Township
Average Daily Rate (ADR) Airbnb Trends in Washington Township (2025)
Effective short term rental pricing strategy in Washington Township involves understanding monthly ADR fluctuations. The Average Daily Rate (ADR) for Airbnb in Washington Township typically peaks in January and dips lowest during October. Leveraging Airbnb dynamic pricing tools or strategies based on this seasonality can significantly boost revenue. Here's a look at the typical nightly rates achieved:
- Best-in-class properties (Top 10%) command rates of $286+ per night, often due to premium features or locations.
- Strong performing properties (Top 25%) achieve nightly rates of $207 or more.
- Typical properties (Median) charge around $138 per night.
- Entry-level properties (Bottom 25%) earn around $86 per night.
Average Daily Rate (ADR) Trend by Month in Washington Township
Get Live Washington Township Market Intelligence 👇

Explore Real-time Analytics
Airbnb Seasonality Analysis & Trends in Washington Township (2025)
Peak Season (June, July, August)
- Revenue averages $3,177 per month
- Occupancy rates average 43.6%
- Daily rates average $191
Shoulder Season
- Revenue averages $2,359 per month
- Occupancy maintains around 40.0%
- Daily rates hold near $192
Low Season (February, March, November)
- Revenue drops to average $1,413 per month
- Occupancy decreases to average 29.0%
- Daily rates adjust to average $206
Seasonality Insights for Washington Township
- The Airbnb seasonality in Washington Township shows highly seasonal trends requiring careful strategy. While the sections above show seasonal averages, it's also insightful to look at the extremes:
- During the high season, the absolute peak month showcases Washington Township's highest earning potential, with monthly revenues capable of climbing to $3,202, occupancy reaching a high of 51.8%, and ADRs peaking at $210.
- Conversely, the slowest single month of the year, typically falling within the low season, marks the market's lowest point. In this month, revenue might dip to $919, occupancy could drop to 19.7%, and ADRs may adjust down to $181.
- Understanding both the seasonal averages and these monthly peaks and troughs in revenue, occupancy, and ADR is crucial for maximizing your Airbnb profit potential in Washington Township.
Seasonal Strategies for Maximizing Profit
- Peak Season: Maximize revenue through premium pricing and potentially longer minimum stays. Ensure high availability.
- Low Season: Offer competitive pricing, special promotions (e.g., extended stay discounts), and flexible cancellation policies. Target off-season travelers like remote workers or budget-conscious guests.
- Shoulder Seasons: Implement dynamic pricing that balances peak and low rates. Target weekend travelers or specific events. Offer slightly more flexible terms than peak season.
- Regularly analyze your own performance against these Washington Township seasonality benchmarks and adjust your pricing and availability strategy accordingly.
Best Areas for Airbnb Investment in Washington Township (2025)
Exploring the top neighborhoods for short-term rentals in Washington Township? This section highlights key areas, outlining why they are attractive for hosts and guests, along with notable local attractions. Consider these locations based on your target guest profile and investment strategy.
| Neighborhood / Area | Why Host Here? (Target Guests & Appeal) | Key Attractions & Landmarks |
|---|---|---|
| Washington Township Town Center | The central hub of Washington Township, known for its shopping, dining, and community events. Attracts families and visitors looking for convenience and local culture. | Washington Township Public Library, Township Park, local restaurants and shops, seasonal farmers market, Community Center |
| Bishop Eustace Preparatory School Area | Close to a well-known private school, this area attracts families and educational tourists due to its academic reputation and community programs. | Bishop Eustace Preparatory School, local parks, family-friendly activities, nearby shopping centers |
| Washington Lake Park | A picturesque park with a large lake and recreational facilities. Ideal for nature lovers and outdoor activities, attracting both locals and tourists. | Washington Lake, walking and biking trails, picnic areas, fishing spots, sports fields |
| Tavistock | A quiet, suburban area known for its family-friendly atmosphere and beautiful homes. Attracts visitors who seek a peaceful retreat close to amenities. | local playgrounds, nearby golf courses, community events, scenic neighborhoods |
| Renaissance Plaza | A mixed-use development area that combines residential, retail, and entertainment options. It's becoming increasingly popular with young professionals. | shopping and dining options, local entertainment venues, public art installations, community events |
| H}; the area surrounding Whitman Square | A vibrant area with a strong local community feel. Great for guests looking for a genuine suburban experience. | Whitman Square Park, local eateries, Farmers Market access, community events |
| Route 73 Corridor | A major thoroughfare with various dining and shopping options. Conveniently located and popular with travelers passing through. | shopping plazas, restaurants, car dealerships, transportation access |
| The Shoppes at Cross Keys | An area defined by shopping and dining, it serves both residents and visitors looking for retail therapy and convenient amenities. | variety of shops, restaurants, convenient parking, community events |
Understanding Airbnb License Requirements & STR Laws in Washington Township (2025)
While Washington Township, New Jersey, United States currently shows low STR regulations, specific Airbnb license requirements might still exist or change. Always verify the latest short term rental regulations and Airbnb license requirements directly with local government authorities for Washington Township to ensure full compliance before hosting.
(Source: AirROI data, 2025, finding no licensed listings among those analyzed)
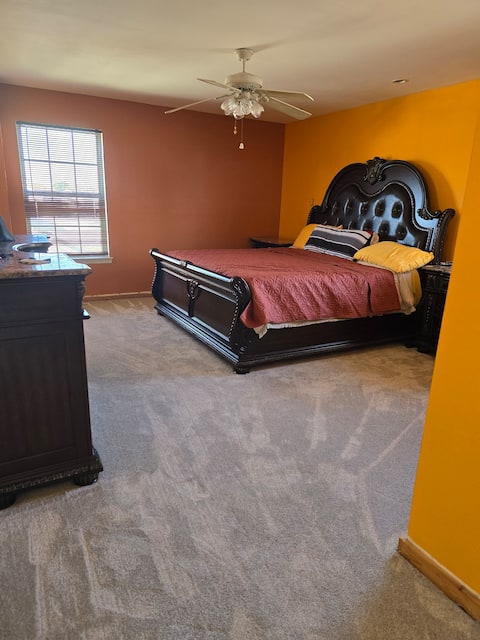
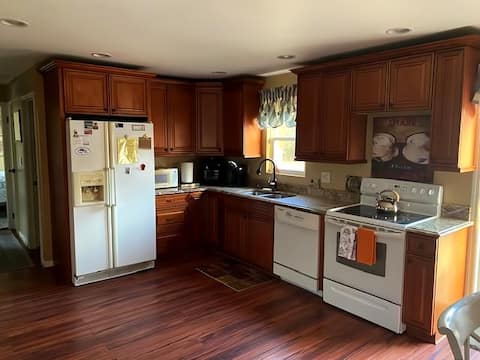
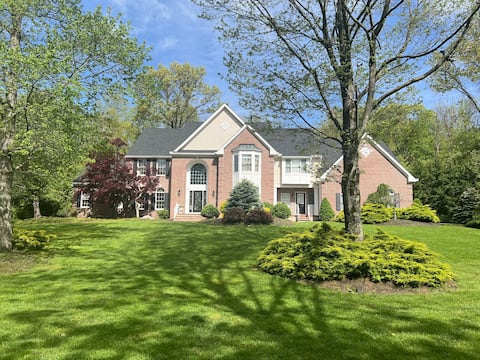
Top Performing Airbnb Properties in Washington Township (2025)
Benchmark your potential! Explore examples of top-performing Airbnb properties in Washington Townshipbased on Trailing Twelve Month (TTM) revenue. Analyze their characteristics, revenue, occupancy rate, and ADR to understand what drives success in this market.
Mountaintop Villa w amazing view, pool & hot tub
Entire Place • 5 bedrooms
The Township Golden Crib.
Entire Place • 4 bedrooms

Beautiful Townhome near Philly Stadiums & AC!!
Entire Place • 3 bedrooms
Washington Township Retreat
Entire Place • 3 bedrooms
Summer Escape from the City
Entire Place • 5 bedrooms
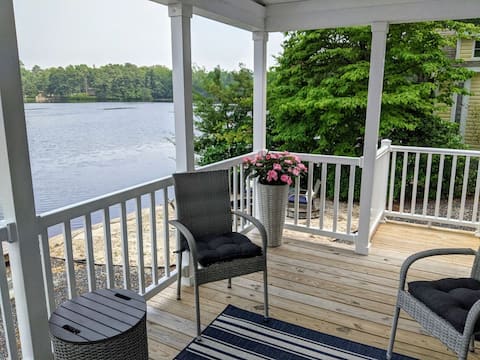
Lakeside Cottage
Entire Place • 2 bedrooms
Note: Performance varies based on location, size, amenities, seasonality, and management quality. Data reflects the past 12 months.
Top Performing Airbnb Hosts in Washington Township (2025)
Learn from the best! This table showcases top-performing Airbnb hosts in Washington Township based on the number of properties managed and estimated total revenue over the past year. Analyze their scale and performance metrics.
| Host Name | Properties | Grossing Revenue | Stay Reviews | Avg Rating |
|---|---|---|---|---|
| Joe | 1 | $66,679 | 133 | 4.88/5.0 |
| Host #327176357 | 1 | $41,752 | 7 | 4.43/5.0 |
| Janniece And Herb | 1 | $41,096 | 97 | 4.92/5.0 |
| Kate | 1 | $38,707 | 136 | 4.93/5.0 |
| Iris | 4 | $36,924 | 57 | 4.99/5.0 |
| Host #275955620 | 1 | $35,200 | 0 | 0.00/5.0 |
| Tammy | 1 | $28,580 | 3 | 5.00/5.0 |
| Host #2454352 | 1 | $15,039 | 111 | 4.95/5.0 |
| Host #157140705 | 1 | $13,938 | 97 | 4.78/5.0 |
| Donna | 1 | $7,326 | 227 | 4.94/5.0 |
Analyzing the strategies of top hosts, such as their property selection, pricing, and guest communication, can offer valuable lessons for optimizing your own Airbnb operations in Washington Township.
Dive Deeper: Advanced Washington Township STR Market Data (2025)
Ready to unlock more insights? AirROI provides access to advanced metrics and comprehensive Airbnb data for Washington Township. Explore detailed analytics beyond this report to refine your investment strategy, optimize pricing, and maximize your vacation rental profits.
Explore Advanced MetricsWashington Township Short-Term Rental Market Composition (2025): Property & Room Types
Room Type Distribution
Property Type Distribution
Market Composition Insights for Washington Township
- The Washington Township Airbnb market composition is heavily skewed towards Private Room listings, which make up 52.9% of the 17 active rentals. This indicates strong guest preference for privacy and space.
- Looking at the property type distribution in Washington Township, House properties are the most common (47.1%), reflecting the local real estate landscape.
- Houses represent a significant 47.1% portion, catering likely to families or larger groups.
- The presence of 23.5% Hotel/Boutique listings indicates integration with traditional hospitality.
Washington Township Airbnb Room Capacity Analysis (2025): Bedroom Distribution
Distribution of Listings by Number of Bedrooms
Room Capacity Insights for Washington Township
- The dominant room capacity in Washington Township is 2 bedrooms listings, making up 23.5% of the market. This suggests a strong demand for properties suitable for couples or solo travelers.
- Together, 2 bedrooms and 3 bedrooms properties represent 35.3% of the active Airbnb listings in Washington Township, indicating a high concentration in these sizes.
- A significant 29.5% of listings offer 3+ bedrooms, catering to larger groups and families seeking more space in Washington Township.
Washington Township Vacation Rental Guest Capacity Trends (2025)
Distribution of Listings by Guest Capacity
Guest Capacity Insights for Washington Township
- The most common guest capacity trend in Washington Township vacation rentals is listings accommodating 8+ guests (23.5%). This suggests the primary traveler segment is likely larger groups.
- Properties designed for 8+ guests and 4 guests dominate the Washington Township STR market, accounting for 35.3% of listings.
- 29.4% of properties accommodate 6+ guests, serving the market segment for larger families or group travel in Washington Township.
- On average, properties in Washington Township are equipped to host 3.2 guests.
Washington Township Airbnb Booking Patterns (2025): Available vs. Booked Days
Available Days Distribution
Booked Days Distribution
Booking Pattern Insights for Washington Township
- The most common availability pattern in Washington Township falls within the 271-366 days range, representing 52.9% of listings. This suggests many properties have significant open periods on their calendars.
- Approximately 88.2% of listings show high availability (181+ days open annually), indicating potential for increased bookings or specific owner usage patterns.
- For booked days, the 31-90 days range is most frequent in Washington Township (41.2%), reflecting common guest stay durations or potential owner blocking patterns.
- A notable 11.8% of properties secure long booking periods (181+ days booked per year), highlighting successful long-term rental strategies or significant owner usage.
Washington Township Airbnb Minimum Stay Requirements Analysis
Distribution of Listings by Minimum Night Requirement
1 Night
9 listings
69.2% of total
2 Nights
1 listings
7.7% of total
3 Nights
1 listings
7.7% of total
4-6 Nights
1 listings
7.7% of total
30+ Nights
1 listings
7.7% of total
Key Insights
- The most prevalent minimum stay requirement in Washington Township is 1 Night, adopted by 69.2% of listings. This highlights the market's preference for shorter, flexible bookings.
- A strong majority (76.9%) of the Washington Township Airbnb data shows acceptance of very short stays (1-2 nights), indicating a dynamic, high-turnover market.
Recommendations
- Align with the market by considering a 1 Night minimum stay, as 69.2% of Washington Township hosts use this setting.
- Explore offering discounts for stays of 30+ nights to attract the 7.7% of the market seeking extended stays.
- Adjust minimum nights based on seasonality – potentially shorter during low season and longer during peak demand periods in Washington Township.
Washington Township Airbnb Cancellation Policy Trends Analysis (2025)
Flexible
1 listings
7.7% of total
Moderate
7 listings
53.8% of total
Firm
2 listings
15.4% of total
Strict
3 listings
23.1% of total
Cancellation Policy Insights for Washington Township
- The prevailing Airbnb cancellation policy trend in Washington Township is Moderate, used by 53.8% of listings.
- There's a relatively balanced mix between guest-friendly (61.5%) and stricter (38.5%) policies, offering choices for different guest needs.
Recommendations for Hosts
- Consider adopting a Moderate policy to align with the 53.8% market standard in Washington Township.
- Regularly review your cancellation policy against competitors and market demand shifts in Washington Township.
Washington Township STR Booking Lead Time Analysis (2025)
Average Booking Lead Time by Month
Booking Lead Time Insights for Washington Township
- The overall average booking lead time for vacation rentals in Washington Township is 57 days.
- Guests book furthest in advance for stays during June (average 83 days), likely coinciding with peak travel demand or local events.
- The shortest booking windows occur for stays in August (average 50 days), indicating more last-minute travel plans during this time.
- Seasonally, Spring (72 days avg.) sees the longest lead times, while Fall (60 days avg.) has the shortest, reflecting typical travel planning cycles.
Recommendations for Hosts
- Use the overall average lead time (57 days) as a baseline for your pricing and availability strategy in Washington Township.
- For June stays, consider implementing length-of-stay discounts or slightly higher rates for bookings made less than 83 days out to capitalize on advance planning.
- Target marketing efforts for the Spring season well in advance (at least 72 days) to capture early planners.
- Monitor your own booking lead times against these Washington Township averages to identify opportunities for dynamic pricing adjustments.
Popular & Essential Airbnb Amenities in Washington Township (2025)
Amenity Prevalence
Amenity Insights for Washington Township
- Essential amenities in Washington Township that guests expect include: Carbon monoxide alarm, Air conditioning, Smoke alarm, Wifi, TV. Lacking these (any) could significantly impact bookings.
- Popular amenities like Essentials, Heating, Free parking on premises are common but not universal. Offering these can provide a competitive edge.
Recommendations for Hosts
- Ensure your listing includes all essential amenities for Washington Township: Carbon monoxide alarm, Air conditioning, Smoke alarm, Wifi, TV.
- Consider adding popular differentiators like Essentials or Heating to increase appeal.
- Highlight unique or less common amenities you offer (e.g., hot tub, dedicated workspace, EV charger) in your listing description and photos.
- Regularly check competitor amenities in Washington Township to stay competitive.
Washington Township Airbnb Guest Demographics & Profile Analysis (2025)
Guest Profile Summary for Washington Township
- The typical guest profile for Airbnb in Washington Township consists of primarily domestic travelers (93%), often arriving from nearby New York, typically belonging to the Post-2000s (Gen Z/Alpha) group (50%), primarily speaking English or Spanish.
- Domestic travelers account for 92.9% of guests.
- Key international markets include United States (92.9%) and Canada (2%).
- Top languages spoken are English (69.6%) followed by Spanish (10.7%).
- A significant demographic segment is the Post-2000s (Gen Z/Alpha) group, representing 50% of guests.
Recommendations for Hosts
- Target domestic marketing efforts towards travelers from New York and İzmir.
- Tailor amenities and listing descriptions to appeal to the dominant Post-2000s (Gen Z/Alpha) demographic (e.g., highlight fast WiFi, smart home features, local guides).
- Highlight unique local experiences or amenities relevant to the primary guest profile.
- Consider seasonal promotions aligned with peak travel times for key origin markets.
Nearby Short-Term Rental Market Comparison
How does the Washington Township Airbnb market stack up against its neighbors? Compare key performance metrics like average monthly revenue, ADR, and occupancy rates in surrounding areas to understand the broader regional STR landscape.
| Market | Active Properties | Monthly Revenue | Daily Rate | Avg. Occupancy |
|---|---|---|---|---|
| Berlin Township | 15 | $9,384 | $663.27 | 35% |
| Frankford Township | 10 | $6,656 | $501.80 | 45% |
| Penn Estates | 58 | $6,479 | $386.94 | 50% |
| Spring Lake Heights | 16 | $6,192 | $690.88 | 49% |
| Town of Kingston | 13 | $6,045 | $436.18 | 49% |
| Town of Pawling | 16 | $5,956 | $392.41 | 56% |
| Brookfield | 13 | $5,891 | $486.63 | 51% |
| Town/Village of Harrison | 10 | $5,764 | $590.20 | 48% |
| Stroud Township | 122 | $5,734 | $420.52 | 44% |
| Stone Harbor | 34 | $5,711 | $639.17 | 45% |