Española Airbnb Market Analysis 2026: Short Term Rental Data & Vacation Rental Statistics in New Mexico, United States
Is Airbnb profitable in Española in 2026? Explore comprehensive Airbnb analytics for Española, New Mexico, United States to uncover income potential. This 2026 STR market report for Española, based on AirROI data from February 2025 to January 2026, reveals key trends in the niche market of 22 active listings.
Whether you're considering an Airbnb investment in Española, optimizing your existing vacation rental, or exploring rental arbitrage opportunities, understanding the Española Airbnb data is crucial. Leveraging the low regulation environment is key to maximizing your short term rental income potential. Let's dive into the specifics.
Key Española Airbnb Performance Metrics Overview
Monthly Airbnb Revenue Variations & Income Potential in Española (2026)
Understanding the monthly revenue variations for Airbnb listings in Española is key to maximizing your short term rental income potential. Seasonality significantly impacts earnings. Our analysis, based on data from the past 12 months, shows that the peak revenue month for STRs in Española is typically July, while February often presents the lowest earnings, highlighting opportunities for strategic pricing adjustments during shoulder and low seasons. Explore the typical Airbnb income in Española across different performance tiers:
- Best-in-class properties (Top 10%) achieve $3,587+ monthly, often utilizing dynamic pricing and superior guest experiences.
- Strong performing properties (Top 25%) earn $2,667 or more, indicating effective management and desirable locations/amenities.
- Typical properties (Median) generate around $1,598 per month, representing the average market performance.
- Entry-level properties (Bottom 25%) see earnings around $753, often with potential for optimization.
Average Monthly Airbnb Earnings Trend in Española
Española Airbnb Occupancy Rate Trends (2026)
Maximize your bookings by understanding the Española STR occupancy trends. Seasonal demand shifts significantly influence how often properties are booked. Typically, Septembersees the highest demand (peak season occupancy), while January experiences the lowest (low season). Effective strategies, like adjusting minimum stays or offering promotions, can boost occupancy during slower periods. Here's how different property tiers perform in Española:
- Best-in-class properties (Top 10%) achieve 81%+ occupancy, indicating high desirability and potentially optimized availability.
- Strong performing properties (Top 25%) maintain 68% or higher occupancy, suggesting good market fit and guest satisfaction.
- Typical properties (Median) have an occupancy rate around 43%.
- Entry-level properties (Bottom 25%) average 20% occupancy, potentially facing higher vacancy.
Average Monthly Occupancy Rate Trend in Española
Average Daily Rate (ADR) Airbnb Trends in Española (2026)
Effective short term rental pricing strategy in Española involves understanding monthly ADR fluctuations. The Average Daily Rate (ADR) for Airbnb in Española typically peaks in October and dips lowest during February. Leveraging Airbnb dynamic pricing tools or strategies based on this seasonality can significantly boost revenue. Here's a look at the typical nightly rates achieved:
- Best-in-class properties (Top 10%) command rates of $200+ per night, often due to premium features or locations.
- Strong performing properties (Top 25%) achieve nightly rates of $145 or more.
- Typical properties (Median) charge around $119 per night.
- Entry-level properties (Bottom 25%) earn around $89 per night.
Average Daily Rate (ADR) Trend by Month in Española
Get Live Española Market Intelligence 👇

Explore Real-time Analytics
Airbnb Seasonality Analysis & Trends in Española (2026)
Peak Season (July, September, August)
- Revenue averages $2,900 per month
- Occupancy rates average 56.7%
- Daily rates average $136
Shoulder Season
- Revenue averages $2,366 per month
- Occupancy maintains around 43.7%
- Daily rates hold near $141
Low Season (February, March, April)
- Revenue drops to average $1,468 per month
- Occupancy decreases to average 39.2%
- Daily rates adjust to average $131
Seasonality Insights for Española
- The Airbnb seasonality in Española shows highly seasonal trends requiring careful strategy. While the sections above show seasonal averages, it's also insightful to look at the extremes:
- During the high season, the absolute peak month showcases Española's highest earning potential, with monthly revenues capable of climbing to $3,046, occupancy reaching a high of 57.9%, and ADRs peaking at $145.
- Conversely, the slowest single month of the year, typically falling within the low season, marks the market's lowest point. In this month, revenue might dip to $1,068, occupancy could drop to 31.1%, and ADRs may adjust down to $130.
- Understanding both the seasonal averages and these monthly peaks and troughs in revenue, occupancy, and ADR is crucial for maximizing your Airbnb profit potential in Española.
Seasonal Strategies for Maximizing Profit
- Peak Season: Maximize revenue through premium pricing and potentially longer minimum stays. Ensure high availability.
- Low Season: Offer competitive pricing, special promotions (e.g., extended stay discounts), and flexible cancellation policies. Target off-season travelers like remote workers or budget-conscious guests.
- Shoulder Seasons: Implement dynamic pricing that balances peak and low rates. Target weekend travelers or specific events. Offer slightly more flexible terms than peak season.
- Regularly analyze your own performance against these Española seasonality benchmarks and adjust your pricing and availability strategy accordingly.
Best Areas for Airbnb Investment in Española (2026)
Exploring the top neighborhoods for short-term rentals in Española? This section highlights key areas, outlining why they are attractive for hosts and guests, along with notable local attractions. Consider these locations based on your target guest profile and investment strategy.
| Neighborhood / Area | Why Host Here? (Target Guests & Appeal) | Key Attractions & Landmarks |
|---|---|---|
| Downtown Española | A bustling area with shops and dining options. It serves as a hub for visitors looking to explore the local culture and history, making it an appealing spot for short-term rentals. | Española Valley Historical Museum, Local art galleries, Restaurants and cafes, Civic Plaza, Española Public Library |
| Santa Cruz River Valley | Scenic area known for outdoor activities and natural beauty. It attracts nature lovers, making it a great option for Airbnb hosts focused on eco-tourism. | Santa Cruz Lake, Hiking trails, Biking routes, Picnic areas, Fishing spots |
| Chimayo | Famous for its historic sanctuary and unique artisan culture, Chimayo draws visitors interested in spirituality and heritage, providing a strong market for Airbnb stays. | Santuario de Chimayo, Chimayo Trading Post, Local artisans, Cultural festivals, Beautiful landscapes |
| Ojo Caliente | Renowned for its hot springs, this area appeals to those seeking relaxation and wellness retreats, making it a sought-after location for wellness-focused accommodations. | Ojo Caliente Mineral Springs Resort & Spa, Hiking in the surrounding areas, Yoga and wellness retreats, Stargazing opportunities, Local artworks |
| Espanola Valley | Known for its rich culture and history, this valley is ideal for cultural tourism, attracting guests interested in the local heritage and communities like the Tewa. | Local weaving shops, Native American history sites, Flamenco festivals, Cultural events, Art workshops |
| Taos Pueblo | A UNESCO World Heritage site, this area is rich in Native American culture and history, attracting tourists looking for authentic experiences. | Taos Pueblo Community Center, Cultural demonstrations, Local artisan shops, Historic tours, Festivals |
| Los Alamos | Just a drive away, Los Alamos offers a fusion of science and nature, being close to national parks. Ideal for families and science enthusiasts to explore. | Los Alamos National Laboratory, Bradbury Science Museum, Banff Park, Local trails, Historical sites |
| Abiquiu | Famous for its stunning landscapes and connection to artists like Georgia O'Keeffe, Abiquiu attracts art lovers and nature enthusiasts alike. | Ghost Ranch, Abiquiu Lake, O'Keeffe's Studio, Art shops, Hiking trails |
Understanding Airbnb License Requirements & STR Laws in Española (2026)
While Española, New Mexico, United States currently shows low STR regulations, specific Airbnb license requirements might still exist or change. Always verify the latest short term rental regulations and Airbnb license requirements directly with local government authorities for Española to ensure full compliance before hosting.
(Source: AirROI data, 2026, finding no licensed listings among those analyzed)
Top Performing Airbnb Properties in Española (2026)
Benchmark your potential! Explore examples of top-performing Airbnb properties in Españolabased on Trailing Twelve Month (TTM) revenue. Analyze their characteristics, revenue, occupancy rate, and ADR to understand what drives success in this market.
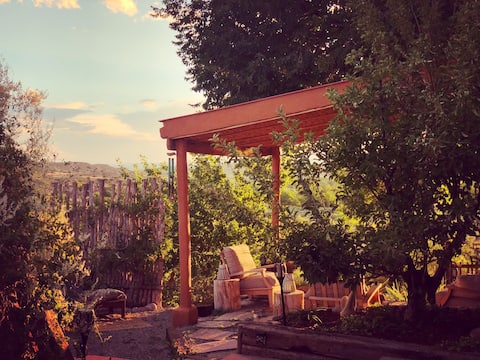
Hot Tub Views & Fireplaces | Private Ranchito
Entire Place • 5 bedrooms

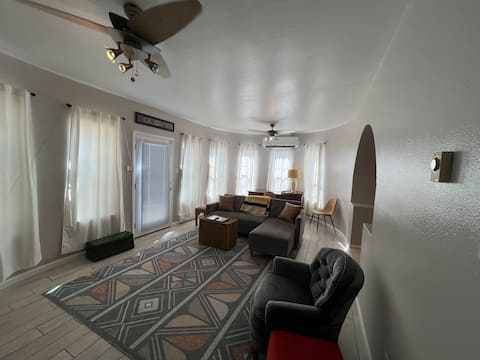
Centrally Located Southwest Oasis-Sage Casita
Entire Place • 1 bedroom

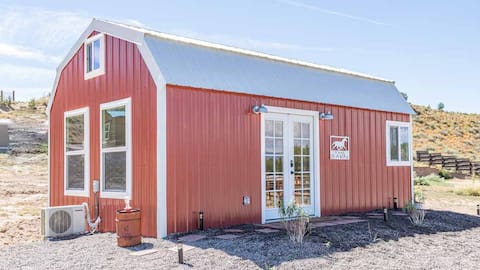
The Cabin - Tiny Home near Santa Fe & Los Alamos
Entire Place • 1 bedroom
Northern Charm
Entire Place • 2 bedrooms

Charming Camper near Santa Fe
Entire Place • 1 bedroom
The Barn - Tiny Home near Santa Fe & Los Alamos
Entire Place • 1 bedroom
Note: Performance varies based on location, size, amenities, seasonality, and management quality. Data reflects the past 12 months.
Top Performing Airbnb Hosts in Española (2026)
Learn from the best! This table showcases top-performing Airbnb hosts in Española based on the number of properties managed and estimated total revenue over the past year. Analyze their scale and performance metrics.
| Host Name | Properties | Grossing Revenue | Stay Reviews | Avg Rating |
|---|---|---|---|---|
| Misty | 1 | $124,934 | 77 | 4.99/5.0 |
| Rachel | 3 | $59,002 | 478 | 4.94/5.0 |
| Kathryn | 1 | $33,210 | 86 | 4.97/5.0 |
| Donna | 1 | $24,972 | 18 | 4.94/5.0 |
| Keri | 1 | $24,638 | 181 | 4.94/5.0 |
| Evolve | 3 | $23,799 | 54 | 4.54/5.0 |
| Mayela | 1 | $16,855 | 13 | 4.77/5.0 |
| Jessica | 1 | $14,669 | 27 | 4.89/5.0 |
| Lisa | 1 | $14,274 | 98 | 4.92/5.0 |
| Margaret | 2 | $14,185 | 45 | 4.66/5.0 |
Analyzing the strategies of top hosts, such as their property selection, pricing, and guest communication, can offer valuable lessons for optimizing your own Airbnb operations in Española.
Dive Deeper: Advanced Española STR Market Data (2026)
Ready to unlock more insights? AirROI provides access to advanced metrics and comprehensive Airbnb data for Española. Explore detailed analytics beyond this report to refine your investment strategy, optimize pricing, and maximize your vacation rental profits.
Explore Advanced MetricsEspañola Short-Term Rental Market Composition (2026): Property & Room Types
Room Type Distribution
Property Type Distribution
Market Composition Insights for Española
- The Española Airbnb market composition is heavily skewed towards Entire Home/Apt listings, which make up 95.5% of the 22 active rentals. This indicates strong guest preference for privacy and space.
- Looking at the property type distribution in Española, House properties are the most common (36.4%), reflecting the local real estate landscape.
- Houses represent a significant 36.4% portion, catering likely to families or larger groups.
- The presence of 13.6% Hotel/Boutique listings indicates integration with traditional hospitality.
- Smaller segments like others (combined 4.5%) offer potential for unique stay experiences.
Española Airbnb Room Capacity Analysis (2026): Bedroom Distribution
Distribution of Listings by Number of Bedrooms
Room Capacity Insights for Española
- The dominant room capacity in Española is 1 bedroom listings, making up 50% of the market. This suggests a strong demand for properties suitable for couples or solo travelers.
- Together, 1 bedroom and 2 bedrooms properties represent 72.7% of the active Airbnb listings in Española, indicating a high concentration in these sizes.
- A significant 22.6% of listings offer 3+ bedrooms, catering to larger groups and families seeking more space in Española.
Española Vacation Rental Guest Capacity Trends (2026)
Distribution of Listings by Guest Capacity
Guest Capacity Insights for Española
- The most common guest capacity trend in Española vacation rentals is listings accommodating 2 guests (40.9%). This suggests the primary traveler segment is likely couples or solo travelers.
- Properties designed for 2 guests and 4 guests dominate the Española STR market, accounting for 59.1% of listings.
- A significant 40.9% of listings cater specifically to 1-2 guests, highlighting strong demand from couples and solo travelers in Española.
- 27.2% of properties accommodate 6+ guests, serving the market segment for larger families or group travel in Española.
- On average, properties in Española are equipped to host 3.7 guests.
Española Airbnb Booking Patterns (2026): Available vs. Booked Days
Available Days Distribution
Booked Days Distribution
Booking Pattern Insights for Española
- The most common availability pattern in Española falls within the 271-366 days range, representing 45.5% of listings. This suggests many properties have significant open periods on their calendars.
- Approximately 81.9% of listings show high availability (181+ days open annually), indicating potential for increased bookings or specific owner usage patterns.
- For booked days, the 91-180 days range is most frequent in Española (31.8%), reflecting common guest stay durations or potential owner blocking patterns.
- A notable 22.7% of properties secure long booking periods (181+ days booked per year), highlighting successful long-term rental strategies or significant owner usage.
Española Airbnb Minimum Stay Requirements Analysis
Distribution of Listings by Minimum Night Requirement
1 Night
6 listings
27.3% of total
2 Nights
3 listings
13.6% of total
3 Nights
2 listings
9.1% of total
7-29 Nights
4 listings
18.2% of total
30+ Nights
7 listings
31.8% of total
Key Insights
- The most prevalent minimum stay requirement in Española is 30+ Nights, adopted by 31.8% of listings. This highlights the market's preference for longer commitments.
- A significant segment (31.8%) caters to monthly stays (30+ nights) in Española, pointing to opportunities in the extended-stay market.
Recommendations
- Align with the market by considering a 30+ Nights minimum stay, as 31.8% of Española hosts use this setting.
- If feasible, allowing 1-night stays, especially midweek or during low season, could capture last-minute bookings, as only 27.3% currently do.
- Explore offering discounts for stays of 30+ nights to attract the 31.8% of the market seeking extended stays.
- Adjust minimum nights based on seasonality – potentially shorter during low season and longer during peak demand periods in Española.
Española Airbnb Cancellation Policy Trends Analysis (2026)
Flexible
4 listings
18.2% of total
Moderate
7 listings
31.8% of total
Firm
7 listings
31.8% of total
Strict
4 listings
18.2% of total
Cancellation Policy Insights for Española
- The prevailing Airbnb cancellation policy trend in Española is Moderate, used by 31.8% of listings.
- There's a relatively balanced mix between guest-friendly (50.0%) and stricter (50.0%) policies, offering choices for different guest needs.
Recommendations for Hosts
- Consider adopting a Moderate policy to align with the 31.8% market standard in Española.
- Regularly review your cancellation policy against competitors and market demand shifts in Española.
Española STR Booking Lead Time Analysis (2026)
Average Booking Lead Time by Month
Booking Lead Time Insights for Española
- The overall average booking lead time for vacation rentals in Española is 42 days.
- Guests book furthest in advance for stays during April (average 65 days), likely coinciding with peak travel demand or local events.
- The shortest booking windows occur for stays in January (average 19 days), indicating more last-minute travel plans during this time.
- Seasonally, Spring (53 days avg.) sees the longest lead times, while Winter (27 days avg.) has the shortest, reflecting typical travel planning cycles.
Recommendations for Hosts
- Use the overall average lead time (42 days) as a baseline for your pricing and availability strategy in Española.
- For April stays, consider implementing length-of-stay discounts or slightly higher rates for bookings made less than 65 days out to capitalize on advance planning.
- Target marketing efforts for the Spring season well in advance (at least 53 days) to capture early planners.
- Monitor your own booking lead times against these Española averages to identify opportunities for dynamic pricing adjustments.
Popular & Essential Airbnb Amenities in Española (2026)
Amenity Prevalence
Amenity Insights for Española
- Essential amenities in Española that guests expect include: Free parking on premises, Kitchen, Heating, Hot water, Cooking basics, Air conditioning. Lacking these (any) could significantly impact bookings.
- Popular amenities like Smoke alarm, Dishes and silverware, Wifi are common but not universal. Offering these can provide a competitive edge.
- Warning: Wifi is not universally provided but is considered essential globally. Ensure reliable Wifi is offered.
Recommendations for Hosts
- Ensure your listing includes all essential amenities for Española: Free parking on premises, Kitchen, Heating, Hot water, Cooking basics, Air conditioning.
- Prioritize adding missing essentials: Kitchen, Heating, Hot water, Cooking basics, Air conditioning.
- Consider adding popular differentiators like Smoke alarm or Dishes and silverware to increase appeal.
- Highlight unique or less common amenities you offer (e.g., hot tub, dedicated workspace, EV charger) in your listing description and photos.
- Regularly check competitor amenities in Española to stay competitive.
Española Airbnb Guest Demographics & Profile Analysis (2026)
Guest Profile Summary for Española
- The typical guest profile for Airbnb in Española consists of primarily domestic travelers (96%), often arriving from nearby Denver, typically belonging to the Post-2000s (Gen Z/Alpha) group (50%), primarily speaking English or Spanish.
- Domestic travelers account for 95.9% of guests.
- Key international markets include United States (95.9%) and Mexico (1.6%).
- Top languages spoken are English (69%) followed by Spanish (15.5%).
- A significant demographic segment is the Post-2000s (Gen Z/Alpha) group, representing 50% of guests.
Recommendations for Hosts
- Target domestic marketing efforts towards travelers from Denver and Albuquerque.
- Tailor amenities and listing descriptions to appeal to the dominant Post-2000s (Gen Z/Alpha) demographic (e.g., highlight fast WiFi, smart home features, local guides).
- Highlight unique local experiences or amenities relevant to the primary guest profile.
- Consider seasonal promotions aligned with peak travel times for key origin markets.
Nearby Short-Term Rental Market Comparison
How does the Española Airbnb market stack up against its neighbors? Compare key performance metrics like average monthly revenue, ADR, and occupancy rates in surrounding areas to understand the broader regional STR landscape.
| Market | Active Properties | Monthly Revenue | Daily Rate | Avg. Occupancy |
|---|---|---|---|---|
| Santa Fe | 1,746 | $3,943 | $318.09 | 49% |
| Valdez | 31 | $3,145 | $354.77 | 34% |
| Arroyo Seco | 59 | $3,119 | $351.72 | 37% |
| Jemez Springs | 40 | $3,085 | $211.27 | 52% |
| El Prado | 221 | $3,016 | $256.61 | 45% |
| Abiquiu | 38 | $2,868 | $222.67 | 51% |
| Tres Piedras | 18 | $2,836 | $191.25 | 49% |
| Placitas | 30 | $2,714 | $233.44 | 49% |
| Dixon | 10 | $2,710 | $162.61 | 55% |
| Angel Fire | 693 | $2,706 | $381.30 | 32% |