Los Ranchos de Albuquerque Airbnb Market Analysis 2026: Short Term Rental Data & Vacation Rental Statistics in New Mexico, United States
Is Airbnb profitable in Los Ranchos de Albuquerque in 2026? Explore comprehensive Airbnb analytics for Los Ranchos de Albuquerque, New Mexico, United States to uncover income potential. This 2026 STR market report for Los Ranchos de Albuquerque, based on AirROI data from February 2025 to January 2026, reveals key trends in the niche market of 40 active listings.
Whether you're considering an Airbnb investment in Los Ranchos de Albuquerque, optimizing your existing vacation rental, or exploring rental arbitrage opportunities, understanding the Los Ranchos de Albuquerque Airbnb data is crucial. Leveraging the low regulation environment is key to maximizing your short term rental income potential. Let's dive into the specifics.
Key Los Ranchos de Albuquerque Airbnb Performance Metrics Overview
Monthly Airbnb Revenue Variations & Income Potential in Los Ranchos de Albuquerque (2026)
Understanding the monthly revenue variations for Airbnb listings in Los Ranchos de Albuquerque is key to maximizing your short term rental income potential. Seasonality significantly impacts earnings. Our analysis, based on data from the past 12 months, shows that the peak revenue month for STRs in Los Ranchos de Albuquerque is typically October, while February often presents the lowest earnings, highlighting opportunities for strategic pricing adjustments during shoulder and low seasons. Explore the typical Airbnb income in Los Ranchos de Albuquerque across different performance tiers:
- Best-in-class properties (Top 10%) achieve $5,085+ monthly, often utilizing dynamic pricing and superior guest experiences.
- Strong performing properties (Top 25%) earn $3,469 or more, indicating effective management and desirable locations/amenities.
- Typical properties (Median) generate around $2,210 per month, representing the average market performance.
- Entry-level properties (Bottom 25%) see earnings around $1,127, often with potential for optimization.
Average Monthly Airbnb Earnings Trend in Los Ranchos de Albuquerque
Los Ranchos de Albuquerque Airbnb Occupancy Rate Trends (2026)
Maximize your bookings by understanding the Los Ranchos de Albuquerque STR occupancy trends. Seasonal demand shifts significantly influence how often properties are booked. Typically, Julysees the highest demand (peak season occupancy), while January experiences the lowest (low season). Effective strategies, like adjusting minimum stays or offering promotions, can boost occupancy during slower periods. Here's how different property tiers perform in Los Ranchos de Albuquerque:
- Best-in-class properties (Top 10%) achieve 82%+ occupancy, indicating high desirability and potentially optimized availability.
- Strong performing properties (Top 25%) maintain 70% or higher occupancy, suggesting good market fit and guest satisfaction.
- Typical properties (Median) have an occupancy rate around 44%.
- Entry-level properties (Bottom 25%) average 21% occupancy, potentially facing higher vacancy.
Average Monthly Occupancy Rate Trend in Los Ranchos de Albuquerque
Average Daily Rate (ADR) Airbnb Trends in Los Ranchos de Albuquerque (2026)
Effective short term rental pricing strategy in Los Ranchos de Albuquerque involves understanding monthly ADR fluctuations. The Average Daily Rate (ADR) for Airbnb in Los Ranchos de Albuquerque typically peaks in October and dips lowest during February. Leveraging Airbnb dynamic pricing tools or strategies based on this seasonality can significantly boost revenue. Here's a look at the typical nightly rates achieved:
- Best-in-class properties (Top 10%) command rates of $401+ per night, often due to premium features or locations.
- Strong performing properties (Top 25%) achieve nightly rates of $251 or more.
- Typical properties (Median) charge around $159 per night.
- Entry-level properties (Bottom 25%) earn around $113 per night.
Average Daily Rate (ADR) Trend by Month in Los Ranchos de Albuquerque
Get Live Los Ranchos de Albuquerque Market Intelligence 👇

Explore Real-time Analytics
Airbnb Seasonality Analysis & Trends in Los Ranchos de Albuquerque (2026)
Peak Season (October, September, July)
- Revenue averages $3,640 per month
- Occupancy rates average 55.1%
- Daily rates average $213
Shoulder Season
- Revenue averages $2,519 per month
- Occupancy maintains around 45.3%
- Daily rates hold near $199
Low Season (January, February, April)
- Revenue drops to average $1,887 per month
- Occupancy decreases to average 40.0%
- Daily rates adjust to average $192
Seasonality Insights for Los Ranchos de Albuquerque
- The Airbnb seasonality in Los Ranchos de Albuquerque shows highly seasonal trends requiring careful strategy. While the sections above show seasonal averages, it's also insightful to look at the extremes:
- During the high season, the absolute peak month showcases Los Ranchos de Albuquerque's highest earning potential, with monthly revenues capable of climbing to $4,079, occupancy reaching a high of 58.7%, and ADRs peaking at $233.
- Conversely, the slowest single month of the year, typically falling within the low season, marks the market's lowest point. In this month, revenue might dip to $1,716, occupancy could drop to 36.6%, and ADRs may adjust down to $187.
- Understanding both the seasonal averages and these monthly peaks and troughs in revenue, occupancy, and ADR is crucial for maximizing your Airbnb profit potential in Los Ranchos de Albuquerque.
Seasonal Strategies for Maximizing Profit
- Peak Season: Maximize revenue through premium pricing and potentially longer minimum stays. Ensure high availability.
- Low Season: Offer competitive pricing, special promotions (e.g., extended stay discounts), and flexible cancellation policies. Target off-season travelers like remote workers or budget-conscious guests.
- Shoulder Seasons: Implement dynamic pricing that balances peak and low rates. Target weekend travelers or specific events. Offer slightly more flexible terms than peak season.
- Regularly analyze your own performance against these Los Ranchos de Albuquerque seasonality benchmarks and adjust your pricing and availability strategy accordingly.
Best Areas for Airbnb Investment in Los Ranchos de Albuquerque (2026)
Exploring the top neighborhoods for short-term rentals in Los Ranchos de Albuquerque? This section highlights key areas, outlining why they are attractive for hosts and guests, along with notable local attractions. Consider these locations based on your target guest profile and investment strategy.
| Neighborhood / Area | Why Host Here? (Target Guests & Appeal) | Key Attractions & Landmarks |
|---|---|---|
| Los Ranchos Village | A quaint, affluent suburb of Albuquerque known for its spacious homes and beautiful views. It's ideal for visitors wanting a peaceful retreat while still close to Albuquerque's attractions. | Los Ranchos Growers Market, Cottonwood Mall, ABQ BioPark, Rio Grande Nature Center State Park, Village of Los Ranchos Historic Sites |
| Coronado Neighborhood | A popular area featuring a mix of shopping, dining, and residential properties, making it ideal for short-term rentals catering to families and business travelers. | Coronado Center, Albuquerque Aquarium, Civic Plaza, Old Town Albuquerque, ABQ Trolley Co. |
| North Valley | Known for its picturesque landscape featuring the Rio Grande river and unique local farms, North Valley is sought after for its charming vacation homes and outdoor experiences. | Rio Grande Nature Center State Park, Los Poblanos Historic Inn & Organic Farm, Local Farmers Markets, Open Space Trails, Balloon Fiesta Park |
| Old Town Albuquerque | Historic area bursting with culture and charm, attracting many tourists due to its authentic adobe buildings, shops, galleries, and restaurants. | San Felipe de Neri Church, Old Town Plaza, Albuquerque Museum, Ghost Tours, Art Galleries |
| University Heights | Close to the University of New Mexico, this area is popular with students, visiting professors, and families, making it suitable for diverse types of renters. | UNM Campus, Popejoy Hall, Isotopes Park, Local Coffee Shops, Museums |
| Albuquerque Downtown | Revitalized area with a vibrant arts scene, nightlife, and dining, perfect for visitors looking for a taste of the city's urban lifestyle. | Kimo Theatre, Albuquerque Convention Center, Route 66, Art Walks, Local Breweries |
| South Valley | Offers a more rural experience with a rich cultural vibe. Popular with guests looking to explore outdoors and traditional New Mexican cultures. | South Valley Regional Recreation Center, Barelas Historic District, Duranes Loop Trail, Local Cuisine, Heritage Farm |
| Tijeras Canyon | A scenic getaway with easy access to outdoor activities like hiking and mountain biking, ideal for nature lovers and adventure seekers. | Tijeras Canyon Open Space, Hiking Trails, Cibola National Forest, Outdoor Recreation Areas, Scenic Views |
Understanding Airbnb License Requirements & STR Laws in Los Ranchos de Albuquerque (2026)
While Los Ranchos de Albuquerque, New Mexico, United States currently shows low STR regulations, specific Airbnb license requirements might still exist or change. Always verify the latest short term rental regulations and Airbnb license requirements directly with local government authorities for Los Ranchos de Albuquerque to ensure full compliance before hosting.
(Source: AirROI data, 2026, finding no licensed listings among those analyzed)
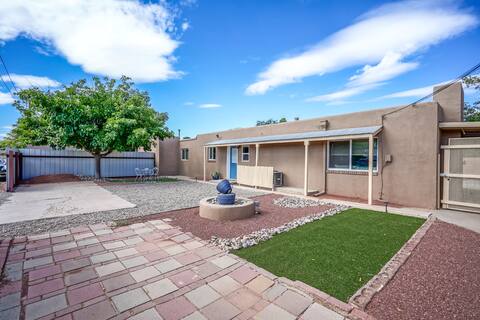
Top Performing Airbnb Properties in Los Ranchos de Albuquerque (2026)
Benchmark your potential! Explore examples of top-performing Airbnb properties in Los Ranchos de Albuquerquebased on Trailing Twelve Month (TTM) revenue. Analyze their characteristics, revenue, occupancy rate, and ADR to understand what drives success in this market.
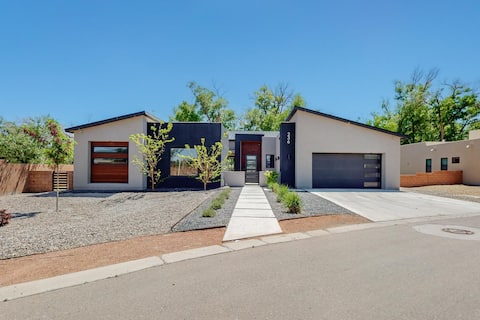
Modern Oasis
Entire Place • 3 bedrooms

Adobe Garden Bed and Breakfast
Entire Place • 3 bedrooms

Immaculate Peaceful Country Escape in the City
Entire Place • 4 bedrooms

Casita Nestled in Orchard
Entire Place • 2 bedrooms
4bd,2ba Home w/ large yard for dogs & cornhole
Entire Place • 4 bedrooms

North Valley Farm Home, La Finca
Entire Place • 4 bedrooms
Note: Performance varies based on location, size, amenities, seasonality, and management quality. Data reflects the past 12 months.
Top Performing Airbnb Hosts in Los Ranchos de Albuquerque (2026)
Learn from the best! This table showcases top-performing Airbnb hosts in Los Ranchos de Albuquerque based on the number of properties managed and estimated total revenue over the past year. Analyze their scale and performance metrics.
| Host Name | Properties | Grossing Revenue | Stay Reviews | Avg Rating |
|---|---|---|---|---|
| Nate | 1 | $77,925 | 54 | 4.96/5.0 |
| Taryn | 2 | $71,431 | 522 | 4.80/5.0 |
| Lee And Tricia | 1 | $65,248 | 55 | 4.98/5.0 |
| Leah | 1 | $58,914 | 119 | 4.96/5.0 |
| John | 1 | $56,914 | 124 | 5.00/5.0 |
| Kevin | 2 | $40,691 | 165 | 4.96/5.0 |
| Pam | 1 | $39,265 | 58 | 4.95/5.0 |
| Steven | 1 | $38,796 | 225 | 4.90/5.0 |
| Andres | 1 | $38,320 | 72 | 4.96/5.0 |
| Amy | 1 | $37,946 | 192 | 4.96/5.0 |
Analyzing the strategies of top hosts, such as their property selection, pricing, and guest communication, can offer valuable lessons for optimizing your own Airbnb operations in Los Ranchos de Albuquerque.
Dive Deeper: Advanced Los Ranchos de Albuquerque STR Market Data (2026)
Ready to unlock more insights? AirROI provides access to advanced metrics and comprehensive Airbnb data for Los Ranchos de Albuquerque. Explore detailed analytics beyond this report to refine your investment strategy, optimize pricing, and maximize your vacation rental profits.
Explore Advanced MetricsLos Ranchos de Albuquerque Short-Term Rental Market Composition (2026): Property & Room Types
Room Type Distribution
Property Type Distribution
Market Composition Insights for Los Ranchos de Albuquerque
- The Los Ranchos de Albuquerque Airbnb market composition is heavily skewed towards Entire Home/Apt listings, which make up 92.5% of the 40 active rentals. This indicates strong guest preference for privacy and space.
- Looking at the property type distribution in Los Ranchos de Albuquerque, House properties are the most common (52.5%), reflecting the local real estate landscape.
- Houses represent a significant 52.5% portion, catering likely to families or larger groups.
- The presence of 22.5% Hotel/Boutique listings indicates integration with traditional hospitality.
Los Ranchos de Albuquerque Airbnb Room Capacity Analysis (2026): Bedroom Distribution
Distribution of Listings by Number of Bedrooms
Room Capacity Insights for Los Ranchos de Albuquerque
- The dominant room capacity in Los Ranchos de Albuquerque is 1 bedroom listings, making up 32.5% of the market. This suggests a strong demand for properties suitable for couples or solo travelers.
- Together, 1 bedroom and 2 bedrooms properties represent 60.0% of the active Airbnb listings in Los Ranchos de Albuquerque, indicating a high concentration in these sizes.
- A significant 30.0% of listings offer 3+ bedrooms, catering to larger groups and families seeking more space in Los Ranchos de Albuquerque.
Los Ranchos de Albuquerque Vacation Rental Guest Capacity Trends (2026)
Distribution of Listings by Guest Capacity
Guest Capacity Insights for Los Ranchos de Albuquerque
- The most common guest capacity trend in Los Ranchos de Albuquerque vacation rentals is listings accommodating 4 guests (27.5%). This suggests the primary traveler segment is likely small families or groups.
- Properties designed for 4 guests and 2 guests dominate the Los Ranchos de Albuquerque STR market, accounting for 47.5% of listings.
- 30.0% of properties accommodate 6+ guests, serving the market segment for larger families or group travel in Los Ranchos de Albuquerque.
- On average, properties in Los Ranchos de Albuquerque are equipped to host 4.3 guests.
Los Ranchos de Albuquerque Airbnb Booking Patterns (2026): Available vs. Booked Days
Available Days Distribution
Booked Days Distribution
Booking Pattern Insights for Los Ranchos de Albuquerque
- The most common availability pattern in Los Ranchos de Albuquerque falls within the 271-366 days range, representing 55% of listings. This suggests many properties have significant open periods on their calendars.
- Approximately 72.5% of listings show high availability (181+ days open annually), indicating potential for increased bookings or specific owner usage patterns.
- For booked days, the 1-30 days range is most frequent in Los Ranchos de Albuquerque (35%), reflecting common guest stay durations or potential owner blocking patterns.
- A notable 27.5% of properties secure long booking periods (181+ days booked per year), highlighting successful long-term rental strategies or significant owner usage.
Los Ranchos de Albuquerque Airbnb Minimum Stay Requirements Analysis
Distribution of Listings by Minimum Night Requirement
1 Night
7 listings
17.5% of total
2 Nights
10 listings
25% of total
3 Nights
5 listings
12.5% of total
4-6 Nights
1 listings
2.5% of total
7-29 Nights
4 listings
10% of total
30+ Nights
13 listings
32.5% of total
Key Insights
- The most prevalent minimum stay requirement in Los Ranchos de Albuquerque is 30+ Nights, adopted by 32.5% of listings. This highlights the market's preference for longer commitments.
- A significant segment (32.5%) caters to monthly stays (30+ nights) in Los Ranchos de Albuquerque, pointing to opportunities in the extended-stay market.
Recommendations
- Align with the market by considering a 30+ Nights minimum stay, as 32.5% of Los Ranchos de Albuquerque hosts use this setting.
- If feasible, allowing 1-night stays, especially midweek or during low season, could capture last-minute bookings, as only 17.5% currently do.
- Explore offering discounts for stays of 30+ nights to attract the 32.5% of the market seeking extended stays.
- Adjust minimum nights based on seasonality – potentially shorter during low season and longer during peak demand periods in Los Ranchos de Albuquerque.
Los Ranchos de Albuquerque Airbnb Cancellation Policy Trends Analysis (2026)
Super Strict 30 Days
1 listings
2.6% of total
Flexible
14 listings
35.9% of total
Moderate
7 listings
17.9% of total
Firm
15 listings
38.5% of total
Strict
2 listings
5.1% of total
Cancellation Policy Insights for Los Ranchos de Albuquerque
- The prevailing Airbnb cancellation policy trend in Los Ranchos de Albuquerque is Firm, used by 38.5% of listings.
- There's a relatively balanced mix between guest-friendly (53.8%) and stricter (43.6%) policies, offering choices for different guest needs.
- Strict cancellation policies are quite rare (5.1%), potentially making listings with this policy less competitive unless justified by high demand or property type.
Recommendations for Hosts
- Consider adopting a Firm policy to align with the 38.5% market standard in Los Ranchos de Albuquerque.
- Using a Strict policy might deter some guests, as only 5.1% of listings use it. Evaluate if potential revenue protection outweighs possible lower booking rates.
- Regularly review your cancellation policy against competitors and market demand shifts in Los Ranchos de Albuquerque.
Los Ranchos de Albuquerque STR Booking Lead Time Analysis (2026)
Average Booking Lead Time by Month
Booking Lead Time Insights for Los Ranchos de Albuquerque
- The overall average booking lead time for vacation rentals in Los Ranchos de Albuquerque is 41 days.
- Guests book furthest in advance for stays during October (average 103 days), likely coinciding with peak travel demand or local events.
- The shortest booking windows occur for stays in July (average 26 days), indicating more last-minute travel plans during this time.
- Seasonally, Fall (60 days avg.) sees the longest lead times, while Spring (31 days avg.) has the shortest, reflecting typical travel planning cycles.
Recommendations for Hosts
- Use the overall average lead time (41 days) as a baseline for your pricing and availability strategy in Los Ranchos de Albuquerque.
- For October stays, consider implementing length-of-stay discounts or slightly higher rates for bookings made less than 103 days out to capitalize on advance planning.
- Target marketing efforts for the Fall season well in advance (at least 60 days) to capture early planners.
- Monitor your own booking lead times against these Los Ranchos de Albuquerque averages to identify opportunities for dynamic pricing adjustments.
Popular & Essential Airbnb Amenities in Los Ranchos de Albuquerque (2026)
Amenity Prevalence
Amenity Insights for Los Ranchos de Albuquerque
- Essential amenities in Los Ranchos de Albuquerque that guests expect include: Free parking on premises, Wifi, Microwave, TV, Dishes and silverware, Heating, Hot water, Smoke alarm, Coffee maker. Lacking these (any) could significantly impact bookings.
- Popular amenities like Cooking basics are common but not universal. Offering these can provide a competitive edge.
Recommendations for Hosts
- Ensure your listing includes all essential amenities for Los Ranchos de Albuquerque: Free parking on premises, Wifi, Microwave, TV, Dishes and silverware, Heating, Hot water, Smoke alarm, Coffee maker.
- Prioritize adding missing essentials: Microwave, TV, Dishes and silverware, Heating, Hot water, Smoke alarm, Coffee maker.
- Consider adding popular differentiators like Cooking basics to increase appeal.
- Highlight unique or less common amenities you offer (e.g., hot tub, dedicated workspace, EV charger) in your listing description and photos.
- Regularly check competitor amenities in Los Ranchos de Albuquerque to stay competitive.
Los Ranchos de Albuquerque Airbnb Guest Demographics & Profile Analysis (2026)
Guest Profile Summary for Los Ranchos de Albuquerque
- The typical guest profile for Airbnb in Los Ranchos de Albuquerque consists of primarily domestic travelers (98%), often arriving from nearby Albuquerque, typically belonging to the Post-2000s (Gen Z/Alpha) group (50%), primarily speaking English or Spanish.
- Domestic travelers account for 98.1% of guests.
- Key international markets include United States (98.1%) and Canada (0.2%).
- Top languages spoken are English (66.5%) followed by Spanish (21.1%).
- A significant demographic segment is the Post-2000s (Gen Z/Alpha) group, representing 50% of guests.
Recommendations for Hosts
- Target domestic marketing efforts towards travelers from Albuquerque and El Paso.
- Tailor amenities and listing descriptions to appeal to the dominant Post-2000s (Gen Z/Alpha) demographic (e.g., highlight fast WiFi, smart home features, local guides).
- Highlight unique local experiences or amenities relevant to the primary guest profile.
- Consider seasonal promotions aligned with peak travel times for key origin markets.
Nearby Short-Term Rental Market Comparison
How does the Los Ranchos de Albuquerque Airbnb market stack up against its neighbors? Compare key performance metrics like average monthly revenue, ADR, and occupancy rates in surrounding areas to understand the broader regional STR landscape.
| Market | Active Properties | Monthly Revenue | Daily Rate | Avg. Occupancy |
|---|---|---|---|---|
| Santa Fe | 1,746 | $3,943 | $318.09 | 49% |
| Valdez | 31 | $3,145 | $354.77 | 34% |
| Arroyo Seco | 59 | $3,119 | $351.72 | 37% |
| Jemez Springs | 40 | $3,085 | $211.27 | 52% |
| El Prado | 221 | $3,016 | $256.61 | 45% |
| Abiquiu | 38 | $2,868 | $222.67 | 51% |
| Tres Piedras | 18 | $2,836 | $191.25 | 49% |
| Placitas | 30 | $2,714 | $233.44 | 49% |
| Dixon | 10 | $2,710 | $162.61 | 55% |
| Angel Fire | 693 | $2,706 | $381.30 | 32% |