Nogal Airbnb Market Analysis 2026: Short Term Rental Data & Vacation Rental Statistics in New Mexico, United States
Is Airbnb profitable in Nogal in 2026? Explore comprehensive Airbnb analytics for Nogal, New Mexico, United States to uncover income potential. This 2026 STR market report for Nogal, based on AirROI data from February 2025 to January 2026, reveals key trends in the niche market of 19 active listings.
Whether you're considering an Airbnb investment in Nogal, optimizing your existing vacation rental, or exploring rental arbitrage opportunities, understanding the Nogal Airbnb data is crucial. Leveraging the low regulation environment is key to maximizing your short term rental income potential. Let's dive into the specifics.
Key Nogal Airbnb Performance Metrics Overview
Monthly Airbnb Revenue Variations & Income Potential in Nogal (2026)
Understanding the monthly revenue variations for Airbnb listings in Nogal is key to maximizing your short term rental income potential. Seasonality significantly impacts earnings. Our analysis, based on data from the past 12 months, shows that the peak revenue month for STRs in Nogal is typically March, while August often presents the lowest earnings, highlighting opportunities for strategic pricing adjustments during shoulder and low seasons. Explore the typical Airbnb income in Nogal across different performance tiers:
- Best-in-class properties (Top 10%) achieve $5,697+ monthly, often utilizing dynamic pricing and superior guest experiences.
- Strong performing properties (Top 25%) earn $3,651 or more, indicating effective management and desirable locations/amenities.
- Typical properties (Median) generate around $1,611 per month, representing the average market performance.
- Entry-level properties (Bottom 25%) see earnings around $717, often with potential for optimization.
Average Monthly Airbnb Earnings Trend in Nogal
Nogal Airbnb Occupancy Rate Trends (2026)
Maximize your bookings by understanding the Nogal STR occupancy trends. Seasonal demand shifts significantly influence how often properties are booked. Typically, Marchsees the highest demand (peak season occupancy), while August experiences the lowest (low season). Effective strategies, like adjusting minimum stays or offering promotions, can boost occupancy during slower periods. Here's how different property tiers perform in Nogal:
- Best-in-class properties (Top 10%) achieve 50%+ occupancy, indicating high desirability and potentially optimized availability.
- Strong performing properties (Top 25%) maintain 37% or higher occupancy, suggesting good market fit and guest satisfaction.
- Typical properties (Median) have an occupancy rate around 24%.
- Entry-level properties (Bottom 25%) average 12% occupancy, potentially facing higher vacancy.
Average Monthly Occupancy Rate Trend in Nogal
Average Daily Rate (ADR) Airbnb Trends in Nogal (2026)
Effective short term rental pricing strategy in Nogal involves understanding monthly ADR fluctuations. The Average Daily Rate (ADR) for Airbnb in Nogal typically peaks in November and dips lowest during April. Leveraging Airbnb dynamic pricing tools or strategies based on this seasonality can significantly boost revenue. Here's a look at the typical nightly rates achieved:
- Best-in-class properties (Top 10%) command rates of $368+ per night, often due to premium features or locations.
- Strong performing properties (Top 25%) achieve nightly rates of $262 or more.
- Typical properties (Median) charge around $180 per night.
- Entry-level properties (Bottom 25%) earn around $105 per night.
Average Daily Rate (ADR) Trend by Month in Nogal
Get Live Nogal Market Intelligence 👇

Explore Real-time Analytics
Airbnb Seasonality Analysis & Trends in Nogal (2026)
Peak Season (March, November, December)
- Revenue averages $2,966 per month
- Occupancy rates average 34.0%
- Daily rates average $206
Shoulder Season
- Revenue averages $2,312 per month
- Occupancy maintains around 26.0%
- Daily rates hold near $201
Low Season (February, July, August)
- Revenue drops to average $1,823 per month
- Occupancy decreases to average 22.1%
- Daily rates adjust to average $198
Seasonality Insights for Nogal
- The Airbnb seasonality in Nogal shows moderate seasonality with distinct peak and low periods. While the sections above show seasonal averages, it's also insightful to look at the extremes:
- During the high season, the absolute peak month showcases Nogal's highest earning potential, with monthly revenues capable of climbing to $3,064, occupancy reaching a high of 39.0%, and ADRs peaking at $220.
- Conversely, the slowest single month of the year, typically falling within the low season, marks the market's lowest point. In this month, revenue might dip to $1,635, occupancy could drop to 18.1%, and ADRs may adjust down to $175.
- Understanding both the seasonal averages and these monthly peaks and troughs in revenue, occupancy, and ADR is crucial for maximizing your Airbnb profit potential in Nogal.
Seasonal Strategies for Maximizing Profit
- Peak Season: Maximize revenue through premium pricing and potentially longer minimum stays. Ensure high availability.
- Low Season: Offer competitive pricing, special promotions (e.g., extended stay discounts), and flexible cancellation policies. Target off-season travelers like remote workers or budget-conscious guests.
- Shoulder Seasons: Implement dynamic pricing that balances peak and low rates. Target weekend travelers or specific events. Offer slightly more flexible terms than peak season.
- Regularly analyze your own performance against these Nogal seasonality benchmarks and adjust your pricing and availability strategy accordingly.
Best Areas for Airbnb Investment in Nogal (2026)
Exploring the top neighborhoods for short-term rentals in Nogal? This section highlights key areas, outlining why they are attractive for hosts and guests, along with notable local attractions. Consider these locations based on your target guest profile and investment strategy.
| Neighborhood / Area | Why Host Here? (Target Guests & Appeal) | Key Attractions & Landmarks |
|---|---|---|
| Ruidoso | A mountain resort town popular for outdoor activities year-round, including skiing in winter and hiking in summer. Offers a mix of relaxation and adventure, making it attractive to tourists seeking nature. | Ski Apache, Billy the Kid Casino, Ruidoso Downs Race Track, Lincoln National Forest, Ruidoso River Museum, Grindstone Lake |
| Cloudcroft | Known for its scenic mountain views and outdoor recreational opportunities, Cloudcroft attracts visitors looking for a quiet getaway in the Sacramento Mountains. | Cloudcroft Ski Area, White Sands National Park, Lincoln National Forest, Oregon Mountain Desert Peaks National Monument, Trestle Recreation Area |
| Capitan | Close to the iconic Smokey Bear Museum and the lush Lincoln National Forest, Capitan is a quaint village attracting those interested in history and nature. | Smokey Bear Historical Park, Capitan Mountain, Hiking Trails in Lincoln National Forest, Local artisan shops, Capitan's local dining options |
| Alto | A serene area with beautiful wooded landscapes and proximity to Ruidoso, Alto is perfect for travelers seeking peace and quiet while still being close to attractions. | The Links at Sierra Blanca, Alto Lake and Recreation Area, Sierra Blanca Mountains, Local wildlife viewing, Stargazing opportunities |
| Hatch | Renowned as the Chile Capital of the World, Hatch attracts culinary tourists who want to experience regional flavors, especially spicy green chile. | Chiles from Hatch, Hatch Chile Festival, Local markets and shops, Nearby state parks, Cultural festivals throughout the year |
| Lincoln | Famous for its historical significance in the Wild West, Lincoln offers a unique glimpse into the past and is popular with history buffs. | Lincoln Historic Site, Billy the Kid's hideout, Old West architecture, Local museums, Guided tours |
| Mescalero | Home to the Mescalero Apache Tribe, this destination has rich cultural heritage and stunning landscapes, attracting nature lovers and cultural tourists. | Inn of the Mountain Gods Resort, Ski Apache Resort, Cultural events from the Mescalero Apache Tribe, Hiking in the mountains, Lake fishing |
| Carrizozo | Known for its quirky art installations and close proximity to the White Sands, Carrizozo appeals to artists and those looking for unique local experiences. | Carrizozo Heritage Museum, Local art galleries, White Sands National Park, Historic Route 380, Carrizozo's annual art events |
Understanding Airbnb License Requirements & STR Laws in Nogal (2026)
While Nogal, New Mexico, United States currently shows low STR regulations, specific Airbnb license requirements might still exist or change. Always verify the latest short term rental regulations and Airbnb license requirements directly with local government authorities for Nogal to ensure full compliance before hosting.
(Source: AirROI data, 2026, finding no licensed listings among those analyzed)
Top Performing Airbnb Properties in Nogal (2026)
Benchmark your potential! Explore examples of top-performing Airbnb properties in Nogalbased on Trailing Twelve Month (TTM) revenue. Analyze their characteristics, revenue, occupancy rate, and ADR to understand what drives success in this market.
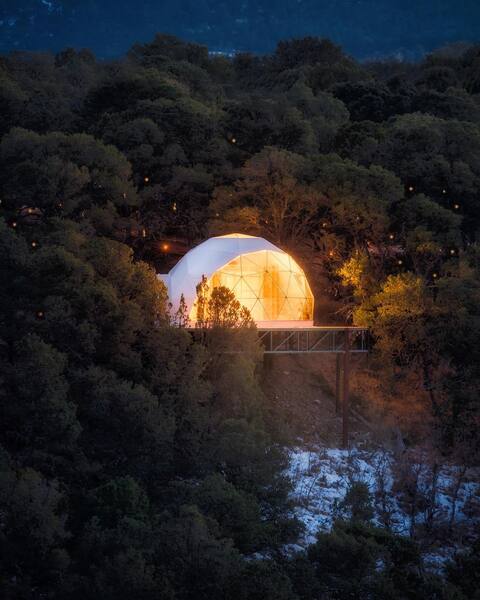
Zia Geo Dome at El Mistico Ranch (No Kids or Pets)
Entire Place • 1 bedroom

Oöna Geo Dome at El Místico (NO Kids or Pets)
Entire Place • 2 bedrooms

Freya Geo Dome Suite El Mistico Ranch NO kids, pet
Entire Place • 2 bedrooms

Crow's Nest Treehouse at El Místico Ranch
Entire Place • 1 bedroom

Ashley's Tree House at El Mistico Ranch
Entire Place • 1 bedroom
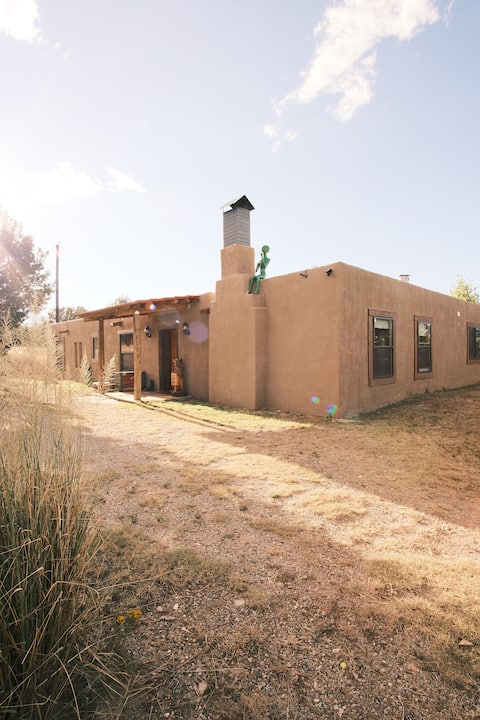
CASITA MISTICA a Southwest Adobe Field Home
Entire Place • 3 bedrooms
Note: Performance varies based on location, size, amenities, seasonality, and management quality. Data reflects the past 12 months.
Top Performing Airbnb Hosts in Nogal (2026)
Learn from the best! This table showcases top-performing Airbnb hosts in Nogal based on the number of properties managed and estimated total revenue over the past year. Analyze their scale and performance metrics.
| Host Name | Properties | Grossing Revenue | Stay Reviews | Avg Rating |
|---|---|---|---|---|
| El Mistico | 10 | $343,753 | 1244 | 4.92/5.0 |
| Chevaun | 2 | $14,428 | 26 | 4.96/5.0 |
| Scharbauer (Scar) | 1 | $6,895 | 87 | 4.95/5.0 |
| Rhonica | 1 | $6,430 | 7 | 5.00/5.0 |
| Evolve | 1 | $3,044 | 1 | Not Rated |
| Rebekah | 1 | $2,552 | 17 | 5.00/5.0 |
| Felipe | 3 | $1,409 | 15 | 4.71/5.0 |
Analyzing the strategies of top hosts, such as their property selection, pricing, and guest communication, can offer valuable lessons for optimizing your own Airbnb operations in Nogal.
Dive Deeper: Advanced Nogal STR Market Data (2026)
Ready to unlock more insights? AirROI provides access to advanced metrics and comprehensive Airbnb data for Nogal. Explore detailed analytics beyond this report to refine your investment strategy, optimize pricing, and maximize your vacation rental profits.
Explore Advanced MetricsNogal Short-Term Rental Market Composition (2026): Property & Room Types
Room Type Distribution
Property Type Distribution
Market Composition Insights for Nogal
- The Nogal Airbnb market composition is heavily skewed towards Entire Home/Apt listings, which make up 94.7% of the 19 active rentals. This indicates strong guest preference for privacy and space.
- Looking at the property type distribution in Nogal, Outdoor/Unique properties are the most common (42.1%), reflecting the local real estate landscape.
- The presence of 10.5% Hotel/Boutique listings indicates integration with traditional hospitality.
Nogal Airbnb Room Capacity Analysis (2026): Bedroom Distribution
Distribution of Listings by Number of Bedrooms
Room Capacity Insights for Nogal
- The dominant room capacity in Nogal is 1 bedroom listings, making up 63.2% of the market. This suggests a strong demand for properties suitable for couples or solo travelers.
- Together, 1 bedroom and 2 bedrooms properties represent 89.5% of the active Airbnb listings in Nogal, indicating a high concentration in these sizes.
- With over half the market (63.2%) consisting of studios or 1-bedroom units, Nogal is particularly well-suited for individuals or couples.
- Listings with 3+ bedrooms (5.3%) represent a smaller niche, potentially indicating an underserved market for larger group accommodations in Nogal.
Nogal Vacation Rental Guest Capacity Trends (2026)
Distribution of Listings by Guest Capacity
Guest Capacity Insights for Nogal
- The most common guest capacity trend in Nogal vacation rentals is listings accommodating 4 guests (47.4%). This suggests the primary traveler segment is likely small families or groups.
- Properties designed for 4 guests and 2 guests dominate the Nogal STR market, accounting for 84.2% of listings.
- 10.6% of properties accommodate 6+ guests, serving the market segment for larger families or group travel in Nogal.
- On average, properties in Nogal are equipped to host 3.5 guests.
Nogal Airbnb Booking Patterns (2026): Available vs. Booked Days
Available Days Distribution
Booked Days Distribution
Booking Pattern Insights for Nogal
- The most common availability pattern in Nogal falls within the 271-366 days range, representing 68.4% of listings. This suggests many properties have significant open periods on their calendars.
- Approximately 94.7% of listings show high availability (181+ days open annually), indicating potential for increased bookings or specific owner usage patterns.
- For booked days, the 31-90 days range is most frequent in Nogal (36.8%), reflecting common guest stay durations or potential owner blocking patterns.
- A notable 5.3% of properties secure long booking periods (181+ days booked per year), highlighting successful long-term rental strategies or significant owner usage.
Nogal Airbnb Minimum Stay Requirements Analysis
Distribution of Listings by Minimum Night Requirement
1 Night
12 listings
63.2% of total
2 Nights
6 listings
31.6% of total
4-6 Nights
1 listings
5.3% of total
Key Insights
- The most prevalent minimum stay requirement in Nogal is 1 Night, adopted by 63.2% of listings. This highlights the market's preference for shorter, flexible bookings.
- A strong majority (94.8%) of the Nogal Airbnb data shows acceptance of very short stays (1-2 nights), indicating a dynamic, high-turnover market.
Recommendations
- Align with the market by considering a 1 Night minimum stay, as 63.2% of Nogal hosts use this setting.
- Adjust minimum nights based on seasonality – potentially shorter during low season and longer during peak demand periods in Nogal.
Nogal Airbnb Cancellation Policy Trends Analysis (2026)
Flexible
5 listings
26.3% of total
Moderate
4 listings
21.1% of total
Firm
9 listings
47.4% of total
Strict
1 listings
5.3% of total
Cancellation Policy Insights for Nogal
- The prevailing Airbnb cancellation policy trend in Nogal is Firm, used by 47.4% of listings.
- A majority (52.7%) of hosts in Nogal utilize Firm or Strict policies, indicating a market where hosts prioritize booking security.
- Strict cancellation policies are quite rare (5.3%), potentially making listings with this policy less competitive unless justified by high demand or property type.
Recommendations for Hosts
- Consider adopting a Firm policy to align with the 47.4% market standard in Nogal.
- Using a Strict policy might deter some guests, as only 5.3% of listings use it. Evaluate if potential revenue protection outweighs possible lower booking rates.
- Regularly review your cancellation policy against competitors and market demand shifts in Nogal.
Nogal STR Booking Lead Time Analysis (2026)
Average Booking Lead Time by Month
Booking Lead Time Insights for Nogal
- The overall average booking lead time for vacation rentals in Nogal is 26 days.
- Guests book furthest in advance for stays during September (average 42 days), likely coinciding with peak travel demand or local events.
- The shortest booking windows occur for stays in February (average 14 days), indicating more last-minute travel plans during this time.
- Seasonally, Fall (33 days avg.) sees the longest lead times, while Winter (17 days avg.) has the shortest, reflecting typical travel planning cycles.
Recommendations for Hosts
- Use the overall average lead time (26 days) as a baseline for your pricing and availability strategy in Nogal.
- For September stays, consider implementing length-of-stay discounts or slightly higher rates for bookings made less than 42 days out to capitalize on advance planning.
- During February, focus on last-minute booking availability and promotions, as guests book with very short notice (14 days avg.).
- Target marketing efforts for the Fall season well in advance (at least 33 days) to capture early planners.
- Monitor your own booking lead times against these Nogal averages to identify opportunities for dynamic pricing adjustments.
Popular & Essential Airbnb Amenities in Nogal (2026)
Amenity Prevalence
Amenity Insights for Nogal
- Popular amenities like Free parking on premises, Coffee maker, Bed linens are common but not universal. Offering these can provide a competitive edge.
Recommendations for Hosts
- Consider adding popular differentiators like Free parking on premises or Coffee maker to increase appeal.
- Highlight unique or less common amenities you offer (e.g., hot tub, dedicated workspace, EV charger) in your listing description and photos.
- Regularly check competitor amenities in Nogal to stay competitive.
Nogal Airbnb Guest Demographics & Profile Analysis (2026)
Guest Profile Summary for Nogal
- The typical guest profile for Airbnb in Nogal consists of primarily domestic travelers (99%), often arriving from nearby El Paso, typically belonging to the Post-2000s (Gen Z/Alpha) group (50%), primarily speaking English or Spanish.
- Domestic travelers account for 98.9% of guests.
- Key international markets include United States (98.9%) and Mexico (1.1%).
- Top languages spoken are English (63%) followed by Spanish (32.6%).
- A significant demographic segment is the Post-2000s (Gen Z/Alpha) group, representing 50% of guests.
Recommendations for Hosts
- Target domestic marketing efforts towards travelers from El Paso and Albuquerque.
- Tailor amenities and listing descriptions to appeal to the dominant Post-2000s (Gen Z/Alpha) demographic (e.g., highlight fast WiFi, smart home features, local guides).
- Highlight unique local experiences or amenities relevant to the primary guest profile.
- Consider seasonal promotions aligned with peak travel times for key origin markets.
Nearby Short-Term Rental Market Comparison
How does the Nogal Airbnb market stack up against its neighbors? Compare key performance metrics like average monthly revenue, ADR, and occupancy rates in surrounding areas to understand the broader regional STR landscape.
| Market | Active Properties | Monthly Revenue | Daily Rate | Avg. Occupancy |
|---|---|---|---|---|
| Alto | 120 | $3,065 | $372.00 | 33% |
| Ruidoso | 1,135 | $2,301 | $285.33 | 31% |
| Cloudcroft | 198 | $2,130 | $190.66 | 42% |
| Carlsbad | 170 | $2,001 | $145.24 | 51% |
| High Rolls | 35 | $1,909 | $176.71 | 39% |
| Alamogordo | 85 | $1,868 | $153.86 | 48% |
| Roswell | 100 | $1,866 | $186.25 | 43% |
| Lincoln County | 11 | $1,820 | $364.86 | 28% |
| Socorro | 10 | $1,757 | $137.59 | 47% |
| Las Cruces | 471 | $1,672 | $140.43 | 47% |