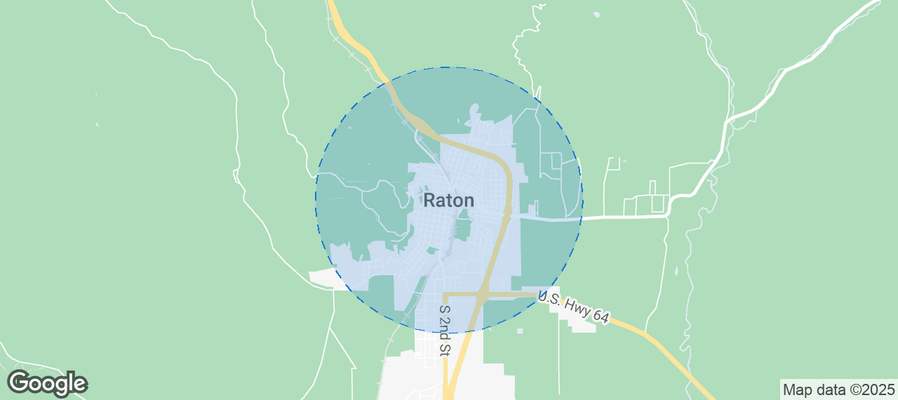
Raton Airbnb Market Analysis 2026: Short Term Rental Data & Vacation Rental Statistics in New Mexico, United States
Is Airbnb profitable in Raton in 2026? Explore comprehensive Airbnb analytics for Raton, New Mexico, United States to uncover income potential. This 2026 STR market report for Raton, based on AirROI data from February 2025 to January 2026, reveals key trends in the niche market of 31 active listings.
Whether you're considering an Airbnb investment in Raton, optimizing your existing vacation rental, or exploring rental arbitrage opportunities, understanding the Raton Airbnb data is crucial. Leveraging the low regulation environment is key to maximizing your short term rental income potential. Let's dive into the specifics.
Key Raton Airbnb Performance Metrics Overview
Monthly Airbnb Revenue Variations & Income Potential in Raton (2026)
Understanding the monthly revenue variations for Airbnb listings in Raton is key to maximizing your short term rental income potential. Seasonality significantly impacts earnings. Our analysis, based on data from the past 12 months, shows that the peak revenue month for STRs in Raton is typically October, while January often presents the lowest earnings, highlighting opportunities for strategic pricing adjustments during shoulder and low seasons. Explore the typical Airbnb income in Raton across different performance tiers:
- Best-in-class properties (Top 10%) achieve $2,922+ monthly, often utilizing dynamic pricing and superior guest experiences.
- Strong performing properties (Top 25%) earn $1,978 or more, indicating effective management and desirable locations/amenities.
- Typical properties (Median) generate around $1,026 per month, representing the average market performance.
- Entry-level properties (Bottom 25%) see earnings around $429, often with potential for optimization.
Average Monthly Airbnb Earnings Trend in Raton
Raton Airbnb Occupancy Rate Trends (2026)
Maximize your bookings by understanding the Raton STR occupancy trends. Seasonal demand shifts significantly influence how often properties are booked. Typically, Decembersees the highest demand (peak season occupancy), while January experiences the lowest (low season). Effective strategies, like adjusting minimum stays or offering promotions, can boost occupancy during slower periods. Here's how different property tiers perform in Raton:
- Best-in-class properties (Top 10%) achieve 77%+ occupancy, indicating high desirability and potentially optimized availability.
- Strong performing properties (Top 25%) maintain 54% or higher occupancy, suggesting good market fit and guest satisfaction.
- Typical properties (Median) have an occupancy rate around 28%.
- Entry-level properties (Bottom 25%) average 13% occupancy, potentially facing higher vacancy.
Average Monthly Occupancy Rate Trend in Raton
Average Daily Rate (ADR) Airbnb Trends in Raton (2026)
Effective short term rental pricing strategy in Raton involves understanding monthly ADR fluctuations. The Average Daily Rate (ADR) for Airbnb in Raton typically peaks in September and dips lowest during April. Leveraging Airbnb dynamic pricing tools or strategies based on this seasonality can significantly boost revenue. Here's a look at the typical nightly rates achieved:
- Best-in-class properties (Top 10%) command rates of $259+ per night, often due to premium features or locations.
- Strong performing properties (Top 25%) achieve nightly rates of $118 or more.
- Typical properties (Median) charge around $91 per night.
- Entry-level properties (Bottom 25%) earn around $74 per night.
Average Daily Rate (ADR) Trend by Month in Raton
Get Live Raton Market Intelligence 👇
Explore Real-time Analytics
Airbnb Seasonality Analysis & Trends in Raton (2026)
Peak Season (October, December, May)
- Revenue averages $1,763 per month
- Occupancy rates average 41.4%
- Daily rates average $122
Shoulder Season
- Revenue averages $1,470 per month
- Occupancy maintains around 35.4%
- Daily rates hold near $117
Low Season (January, February, April)
- Revenue drops to average $1,055 per month
- Occupancy decreases to average 32.9%
- Daily rates adjust to average $110
Seasonality Insights for Raton
- The Airbnb seasonality in Raton shows moderate seasonality with distinct peak and low periods. While the sections above show seasonal averages, it's also insightful to look at the extremes:
- During the high season, the absolute peak month showcases Raton's highest earning potential, with monthly revenues capable of climbing to $1,830, occupancy reaching a high of 44.0%, and ADRs peaking at $133.
- Conversely, the slowest single month of the year, typically falling within the low season, marks the market's lowest point. In this month, revenue might dip to $1,040, occupancy could drop to 30.9%, and ADRs may adjust down to $103.
- Understanding both the seasonal averages and these monthly peaks and troughs in revenue, occupancy, and ADR is crucial for maximizing your Airbnb profit potential in Raton.
Seasonal Strategies for Maximizing Profit
- Peak Season: Maximize revenue through premium pricing and potentially longer minimum stays. Ensure high availability.
- Low Season: Offer competitive pricing, special promotions (e.g., extended stay discounts), and flexible cancellation policies. Target off-season travelers like remote workers or budget-conscious guests.
- Shoulder Seasons: Implement dynamic pricing that balances peak and low rates. Target weekend travelers or specific events. Offer slightly more flexible terms than peak season.
- Regularly analyze your own performance against these Raton seasonality benchmarks and adjust your pricing and availability strategy accordingly.
Best Areas for Airbnb Investment in Raton (2026)
Exploring the top neighborhoods for short-term rentals in Raton? This section highlights key areas, outlining why they are attractive for hosts and guests, along with notable local attractions. Consider these locations based on your target guest profile and investment strategy.
| Neighborhood / Area | Why Host Here? (Target Guests & Appeal) | Key Attractions & Landmarks |
|---|---|---|
| Raton Pass | A scenic mountain pass that attracts visitors looking for outdoor adventures, including hiking and fishing. Its picturesque views and proximity to nature make it a great destination for nature lovers. | Raton Pass, Cimarron Canyon State Park, Angelfire Resort, Philmont Scout Ranch |
| Downtown Raton | The heart of Raton's community, featuring charming shops, restaurants, and historical buildings. Ideal for guests wanting to experience local culture, events, and activities. | Raton Museum, Shuler Theater, Sundance Restaurant, Historic Main Street |
| Lake Maloya | A tranquil lake area perfect for fishing, boating, and picnicking. Attracts families and outdoor enthusiasts seeking a peaceful retreat. | Lake Maloya, Lake Alice, Coyote Creek State Park, Fishing and boating opportunities |
| Sugarite Canyon State Park | Known for its stunning landscapes and recreational activities such as hiking and wildlife watching. A prime spot for visitors who love the outdoors and natural beauty. | Sugarite Canyon, Canyon Trail, Wildlife viewing, Fishing spots |
| Raton Municipal Airport area | Convenient for travelers flying in and out, this area can cater to visitors who need easy access to flights and want to explore the surrounding region. | Raton Municipal Airport, Local eateries, Proximity to Raton |
| Raton Wildlife Area | A region filled with diverse wildlife and natural beauty, perfect for outdoor lovers and photographers. Great for those looking to immerse themselves in nature. | Wildlife viewing, Hiking trails, Photography opportunities, Picnic spots |
| Capulin Volcano National Monument | A geological wonder that offers breathtaking views from the top of an ancient volcano. A unique experience for tourists interested in history and nature. | Capulin Volcano, Visitor Center, Scenic drives, Hiking trails |
| Historic Raton Mines area | Rich in mining history and heritage, attracting history buffs and those interested in the Old West. A unique perspective on the area's past. | Historic mining sites, Local history museums, Scenic views of the region |
Understanding Airbnb License Requirements & STR Laws in Raton (2026)
While Raton, New Mexico, United States currently shows low STR regulations, specific Airbnb license requirements might still exist or change. Always verify the latest short term rental regulations and Airbnb license requirements directly with local government authorities for Raton to ensure full compliance before hosting.
(Source: AirROI data, 2026, finding no licensed listings among those analyzed)
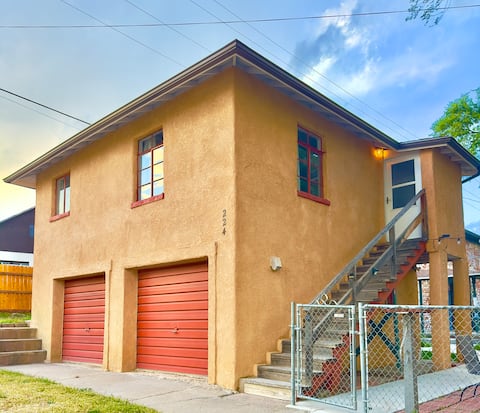
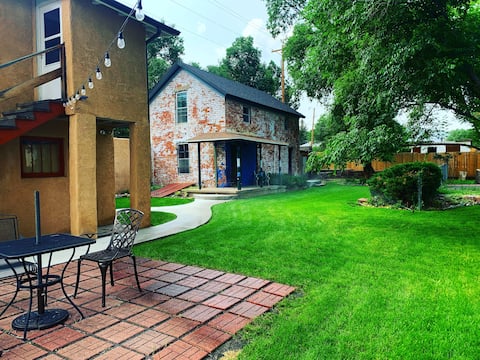
Top Performing Airbnb Properties in Raton (2026)
Benchmark your potential! Explore examples of top-performing Airbnb properties in Ratonbased on Trailing Twelve Month (TTM) revenue. Analyze their characteristics, revenue, occupancy rate, and ADR to understand what drives success in this market.

Black Bear Ridge Vacation Home
Entire Place • 3 bedrooms

Historic Queen Anne Art House | Walk to Downtown
Entire Place • 2 bedrooms

Sagebrush house. Cheerful 3 bedroom private home.
Entire Place • 3 bedrooms

The Bungalow at Cherokee Hills
Entire Place • 1 bedroom
La Casita | Santa Fe Style Near Downtown & Trails
Entire Place • 1 bedroom
Historic 1800s Carriage House | Walk to Downtown
Entire Place • 1 bedroom
Note: Performance varies based on location, size, amenities, seasonality, and management quality. Data reflects the past 12 months.
Top Performing Airbnb Hosts in Raton (2026)
Learn from the best! This table showcases top-performing Airbnb hosts in Raton based on the number of properties managed and estimated total revenue over the past year. Analyze their scale and performance metrics.
| Host Name | Properties | Grossing Revenue | Stay Reviews | Avg Rating |
|---|---|---|---|---|
| Nathan | 3 | $71,998 | 1007 | 4.82/5.0 |
| Kara | 1 | $64,220 | 58 | 4.95/5.0 |
| Matthew | 10 | $40,379 | 47 | 4.64/5.0 |
| Sofia | 6 | $35,652 | 34 | 4.75/5.0 |
| Colleen | 1 | $27,963 | 120 | 4.99/5.0 |
| Candy | 1 | $26,878 | 238 | 4.95/5.0 |
| RedAwning | 2 | $20,664 | 8 | 4.88/5.0 |
| Eloy | 2 | $16,258 | 140 | 4.92/5.0 |
| Tracy | 1 | $8,865 | 49 | 4.59/5.0 |
| Michael | 2 | $3,354 | 44 | 4.91/5.0 |
Analyzing the strategies of top hosts, such as their property selection, pricing, and guest communication, can offer valuable lessons for optimizing your own Airbnb operations in Raton.
Dive Deeper: Advanced Raton STR Market Data (2026)
Ready to unlock more insights? AirROI provides access to advanced metrics and comprehensive Airbnb data for Raton. Explore detailed analytics beyond this report to refine your investment strategy, optimize pricing, and maximize your vacation rental profits.
Explore Advanced MetricsRaton Short-Term Rental Market Composition (2026): Property & Room Types
Room Type Distribution
Property Type Distribution
Market Composition Insights for Raton
- The Raton Airbnb market composition is heavily skewed towards Private Room listings, which make up 58.1% of the 31 active rentals. This indicates strong guest preference for privacy and space.
- Looking at the property type distribution in Raton, Hotel/Boutique properties are the most common (51.6%), reflecting the local real estate landscape.
- Houses represent a significant 38.7% portion, catering likely to families or larger groups.
- The presence of 51.6% Hotel/Boutique listings indicates integration with traditional hospitality.
- Smaller segments like others (combined 3.2%) offer potential for unique stay experiences.
Raton Airbnb Room Capacity Analysis (2026): Bedroom Distribution
Distribution of Listings by Number of Bedrooms
Room Capacity Insights for Raton
- The dominant room capacity in Raton is 1 bedroom listings, making up 61.3% of the market. This suggests a strong demand for properties suitable for couples or solo travelers.
- Together, 1 bedroom and 2 bedrooms properties represent 71.0% of the active Airbnb listings in Raton, indicating a high concentration in these sizes.
- With over half the market (61.3%) consisting of studios or 1-bedroom units, Raton is particularly well-suited for individuals or couples.
Raton Vacation Rental Guest Capacity Trends (2026)
Distribution of Listings by Guest Capacity
Guest Capacity Insights for Raton
- The most common guest capacity trend in Raton vacation rentals is listings accommodating 4 guests (38.7%). This suggests the primary traveler segment is likely small families or groups.
- Properties designed for 4 guests and 2 guests dominate the Raton STR market, accounting for 64.5% of listings.
- On average, properties in Raton are equipped to host 3.0 guests.
Raton Airbnb Booking Patterns (2026): Available vs. Booked Days
Available Days Distribution
Booked Days Distribution
Booking Pattern Insights for Raton
- The most common availability pattern in Raton falls within the 271-366 days range, representing 74.2% of listings. This suggests many properties have significant open periods on their calendars.
- Approximately 80.7% of listings show high availability (181+ days open annually), indicating potential for increased bookings or specific owner usage patterns.
- For booked days, the 31-90 days range is most frequent in Raton (38.7%), reflecting common guest stay durations or potential owner blocking patterns.
- A notable 19.4% of properties secure long booking periods (181+ days booked per year), highlighting successful long-term rental strategies or significant owner usage.
Raton Airbnb Minimum Stay Requirements Analysis
Distribution of Listings by Minimum Night Requirement
1 Night
26 listings
83.9% of total
2 Nights
3 listings
9.7% of total
30+ Nights
2 listings
6.5% of total
Key Insights
- The most prevalent minimum stay requirement in Raton is 1 Night, adopted by 83.9% of listings. This highlights the market's preference for shorter, flexible bookings.
- A strong majority (93.6%) of the Raton Airbnb data shows acceptance of very short stays (1-2 nights), indicating a dynamic, high-turnover market.
Recommendations
- Align with the market by considering a 1 Night minimum stay, as 83.9% of Raton hosts use this setting.
- Explore offering discounts for stays of 30+ nights to attract the 6.5% of the market seeking extended stays.
- Adjust minimum nights based on seasonality – potentially shorter during low season and longer during peak demand periods in Raton.
Raton Airbnb Cancellation Policy Trends Analysis (2026)
Limited
3 listings
9.7% of total
Flexible
20 listings
64.5% of total
Moderate
5 listings
16.1% of total
Firm
3 listings
9.7% of total
Cancellation Policy Insights for Raton
- The prevailing Airbnb cancellation policy trend in Raton is Flexible, used by 64.5% of listings.
- The market strongly favors guest-friendly terms, with 80.6% of listings offering Flexible or Moderate policies. This suggests guests in Raton may expect booking flexibility.
Recommendations for Hosts
- Consider adopting a Flexible policy to align with the 64.5% market standard in Raton.
- Given the high prevalence of Flexible policies (64.5%), offering this can enhance booking appeal, especially during shoulder seasons.
- Regularly review your cancellation policy against competitors and market demand shifts in Raton.
Raton STR Booking Lead Time Analysis (2026)
Average Booking Lead Time by Month
Booking Lead Time Insights for Raton
- The overall average booking lead time for vacation rentals in Raton is 29 days.
- Guests book furthest in advance for stays during May (average 50 days), likely coinciding with peak travel demand or local events.
- The shortest booking windows occur for stays in January (average 14 days), indicating more last-minute travel plans during this time.
- Seasonally, Summer (37 days avg.) sees the longest lead times, while Winter (25 days avg.) has the shortest, reflecting typical travel planning cycles.
Recommendations for Hosts
- Use the overall average lead time (29 days) as a baseline for your pricing and availability strategy in Raton.
- For May stays, consider implementing length-of-stay discounts or slightly higher rates for bookings made less than 50 days out to capitalize on advance planning.
- During January, focus on last-minute booking availability and promotions, as guests book with very short notice (14 days avg.).
- Target marketing efforts for the Summer season well in advance (at least 37 days) to capture early planners.
- Monitor your own booking lead times against these Raton averages to identify opportunities for dynamic pricing adjustments.
Popular & Essential Airbnb Amenities in Raton (2026)
Amenity Prevalence
Amenity Insights for Raton
- Essential amenities in Raton that guests expect include: Air conditioning, Free parking on premises. Lacking these (any) could significantly impact bookings.
- Popular amenities like Heating, TV, Smoke alarm are common but not universal. Offering these can provide a competitive edge.
- Warning: Wifi is not universally provided but is considered essential globally. Ensure reliable Wifi is offered.
Recommendations for Hosts
- Ensure your listing includes all essential amenities for Raton: Air conditioning, Free parking on premises.
- Consider adding popular differentiators like Heating or TV to increase appeal.
- Highlight unique or less common amenities you offer (e.g., hot tub, dedicated workspace, EV charger) in your listing description and photos.
- Regularly check competitor amenities in Raton to stay competitive.
Raton Airbnb Guest Demographics & Profile Analysis (2026)
Guest Profile Summary for Raton
- The typical guest profile for Airbnb in Raton consists of primarily domestic travelers (98%), often arriving from nearby Albuquerque, typically belonging to the Post-2000s (Gen Z/Alpha) group (50%), primarily speaking English or Spanish.
- Domestic travelers account for 98.3% of guests.
- Key international markets include United States (98.3%) and Italy (0.6%).
- Top languages spoken are English (76.8%) followed by Spanish (11.6%).
- A significant demographic segment is the Post-2000s (Gen Z/Alpha) group, representing 50% of guests.
Recommendations for Hosts
- Target domestic marketing efforts towards travelers from Albuquerque and Dallas.
- Tailor amenities and listing descriptions to appeal to the dominant Post-2000s (Gen Z/Alpha) demographic (e.g., highlight fast WiFi, smart home features, local guides).
- Highlight unique local experiences or amenities relevant to the primary guest profile.
- Consider seasonal promotions aligned with peak travel times for key origin markets.
Nearby Short-Term Rental Market Comparison
How does the Raton Airbnb market stack up against its neighbors? Compare key performance metrics like average monthly revenue, ADR, and occupancy rates in surrounding areas to understand the broader regional STR landscape.
| Market | Active Properties | Monthly Revenue | Daily Rate | Avg. Occupancy |
|---|---|---|---|---|
| Santa Fe | 1,746 | $3,943 | $318.09 | 49% |
| Valdez | 31 | $3,145 | $354.77 | 34% |
| Arroyo Seco | 59 | $3,119 | $351.72 | 37% |
| El Prado | 221 | $3,016 | $256.61 | 45% |
| Tres Piedras | 18 | $2,836 | $191.25 | 49% |
| Dixon | 10 | $2,710 | $162.61 | 55% |
| Angel Fire | 693 | $2,706 | $381.30 | 32% |
| Logan | 13 | $2,674 | $283.25 | 46% |
| Lamy | 10 | $2,608 | $335.73 | 42% |
| Taos County | 15 | $2,587 | $270.07 | 42% |