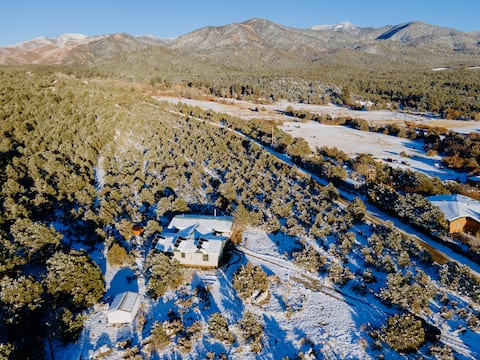
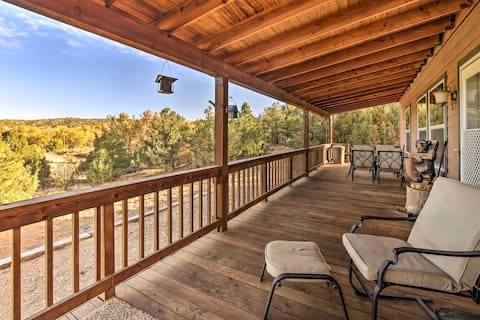
San Cristobal Airbnb Market Analysis 2025: Short Term Rental Data & Vacation Rental Statistics in New Mexico, United States
Is Airbnb profitable in San Cristobal in 2025? Explore comprehensive Airbnb analytics for San Cristobal, New Mexico, United States to uncover income potential. This 2025 STR market report for San Cristobal, based on AirROI data from April 2024 to March 2025, reveals key trends in the niche market of 17 active listings.
Whether you're considering an Airbnb investment in San Cristobal, optimizing your existing vacation rental, or exploring rental arbitrage opportunities, understanding the San Cristobal Airbnb data is crucial. Leveraging the low regulation environment is key to maximizing your short term rental income potential. Let's dive into the specifics.
Key San Cristobal Airbnb Performance Metrics Overview
Monthly Airbnb Revenue Variations & Income Potential in San Cristobal (2025)
Understanding the monthly revenue variations for Airbnb listings in San Cristobal is key to maximizing your short term rental income potential. Seasonality significantly impacts earnings. Our analysis, based on data from the past 12 months, shows that the peak revenue month for STRs in San Cristobal is typically June, while January often presents the lowest earnings, highlighting opportunities for strategic pricing adjustments during shoulder and low seasons. Explore the typical Airbnb income in San Cristobal across different performance tiers:
- Best-in-class properties (Top 10%) achieve $4,707+ monthly, often utilizing dynamic pricing and superior guest experiences.
- Strong performing properties (Top 25%) earn $2,818 or more, indicating effective management and desirable locations/amenities.
- Typical properties (Median) generate around $1,734 per month, representing the average market performance.
- Entry-level properties (Bottom 25%) see earnings around $1,039, often with potential for optimization.
Average Monthly Airbnb Earnings Trend in San Cristobal
San Cristobal Airbnb Occupancy Rate Trends (2025)
Maximize your bookings by understanding the San Cristobal STR occupancy trends. Seasonal demand shifts significantly influence how often properties are booked. Typically, Octobersees the highest demand (peak season occupancy), while May experiences the lowest (low season). Effective strategies, like adjusting minimum stays or offering promotions, can boost occupancy during slower periods. Here's how different property tiers perform in San Cristobal:
- Best-in-class properties (Top 10%) achieve 64%+ occupancy, indicating high desirability and potentially optimized availability.
- Strong performing properties (Top 25%) maintain 49% or higher occupancy, suggesting good market fit and guest satisfaction.
- Typical properties (Median) have an occupancy rate around 31%.
- Entry-level properties (Bottom 25%) average 19% occupancy, potentially facing higher vacancy.
Average Monthly Occupancy Rate Trend in San Cristobal
Average Daily Rate (ADR) Airbnb Trends in San Cristobal (2025)
Effective short term rental pricing strategy in San Cristobal involves understanding monthly ADR fluctuations. The Average Daily Rate (ADR) for Airbnb in San Cristobal typically peaks in July and dips lowest during November. Leveraging Airbnb dynamic pricing tools or strategies based on this seasonality can significantly boost revenue. Here's a look at the typical nightly rates achieved:
- Best-in-class properties (Top 10%) command rates of $299+ per night, often due to premium features or locations.
- Strong performing properties (Top 25%) achieve nightly rates of $219 or more.
- Typical properties (Median) charge around $148 per night.
- Entry-level properties (Bottom 25%) earn around $117 per night.
Average Daily Rate (ADR) Trend by Month in San Cristobal
Get Live San Cristobal Market Intelligence 👇

Explore Real-time Analytics
Airbnb Seasonality Analysis & Trends in San Cristobal (2025)
Peak Season (June, July, December)
- Revenue averages $3,104 per month
- Occupancy rates average 39.2%
- Daily rates average $352
Shoulder Season
- Revenue averages $2,155 per month
- Occupancy maintains around 35.9%
- Daily rates hold near $346
Low Season (January, April, November)
- Revenue drops to average $1,838 per month
- Occupancy decreases to average 32.4%
- Daily rates adjust to average $254
Seasonality Insights for San Cristobal
- The Airbnb seasonality in San Cristobal shows highly seasonal trends requiring careful strategy. While the sections above show seasonal averages, it's also insightful to look at the extremes:
- During the high season, the absolute peak month showcases San Cristobal's highest earning potential, with monthly revenues capable of climbing to $3,419, occupancy reaching a high of 46.7%, and ADRs peaking at $443.
- Conversely, the slowest single month of the year, typically falling within the low season, marks the market's lowest point. In this month, revenue might dip to $1,784, occupancy could drop to 22.1%, and ADRs may adjust down to $159.
- Understanding both the seasonal averages and these monthly peaks and troughs in revenue, occupancy, and ADR is crucial for maximizing your Airbnb profit potential in San Cristobal.
Seasonal Strategies for Maximizing Profit
- Peak Season: Maximize revenue through premium pricing and potentially longer minimum stays. Ensure high availability.
- Low Season: Offer competitive pricing, special promotions (e.g., extended stay discounts), and flexible cancellation policies. Target off-season travelers like remote workers or budget-conscious guests.
- Shoulder Seasons: Implement dynamic pricing that balances peak and low rates. Target weekend travelers or specific events. Offer slightly more flexible terms than peak season.
- Regularly analyze your own performance against these San Cristobal seasonality benchmarks and adjust your pricing and availability strategy accordingly.
Best Areas for Airbnb Investment in San Cristobal (2025)
Exploring the top neighborhoods for short-term rentals in San Cristobal? This section highlights key areas, outlining why they are attractive for hosts and guests, along with notable local attractions. Consider these locations based on your target guest profile and investment strategy.
| Neighborhood / Area | Why Host Here? (Target Guests & Appeal) | Key Attractions & Landmarks |
|---|---|---|
| Historic Downtown San Cristobal | Charming area with a rich cultural history, attracting tourists interested in local heritage and arts. It's centrally located, making it easy for visitors to explore nearby attractions. | San Cristobal Plaza, Local art galleries, The San Cristobal Cathedral, Cultural events, Traditional festivals |
| Rugged Outdoors Area | Perfect for nature enthusiasts and adventure seekers. This area offers beautiful landscapes and outdoor activities such as hiking and bird watching. | Bandelier National Monument, Wild Rivers Recreation Area, Vistas and hiking trails, Camping sites, Stargazing opportunities |
| Art District | Vibrant area known for its local artists and artisans. It's a trendy place for those looking to experience the local art scene and attend workshops or exhibitions. | Local craft shops, Art studios, Workshops and art classes, Cultural festivals, Art exhibitions |
| The Riverfront | A stunning area located along the river, offering scenic views and recreational activities. Great for families and groups looking to enjoy nature and outdoor fun. | River activities, Picnic areas, Nature trails, Fishing spots, Bird watching |
| Residential Hillside | A quiet residential area ideal for families and longer stays. Proximity to schools and parks makes it a safe and pleasant environment for guests. | Local parks, Community events, Family-friendly amenities, Scenic views, Quiet neighborhoods |
| Cultural Heritage Zone | Rich in Native American history and culture, this area is perfect for tourists wanting to learn about the local traditions and history. | Museums, Cultural performances, Historic sites, Guided tours, Local cuisine |
| Nearby Hot Springs | Famous for its natural hot springs, this location is perfect for relaxation and wellness tourism. Many visitors come specifically for the hot springs experience. | Hot springs spas, Wellness retreats, Nature trails, Relaxation areas, Health-focused activities |
| Festivals and Events Area | This area is known for hosting major local events and festivals throughout the year, attracting visitors who want to immerse themselves in local culture and community celebrations. | Annual festivals, Local markets, Cultural events, Live music, Community gatherings |
Understanding Airbnb License Requirements & STR Laws in San Cristobal (2025)
While San Cristobal, New Mexico, United States currently shows low STR regulations, specific Airbnb license requirements might still exist or change. Always verify the latest short term rental regulations and Airbnb license requirements directly with local government authorities for San Cristobal to ensure full compliance before hosting.
(Source: AirROI data, 2025, finding no licensed listings among those analyzed)
Top Performing Airbnb Properties in San Cristobal (2025)
Benchmark your potential! Explore examples of top-performing Airbnb properties in San Cristobalbased on Trailing Twelve Month (TTM) revenue. Analyze their characteristics, revenue, occupancy rate, and ADR to understand what drives success in this market.
Cozy Chic Getaway w/ Mountain Views: Taos Area
Entire Place • 2 bedrooms

Artist’s Retreat: Secluded with sauna, hot tub,
Entire Place • 1 bedroom
Cozy Ski Cabin w/ Deck Near Taos Ski Valley!
Entire Place • 3 bedrooms
Sweet & Sunny Adobe Home
Entire Place • 2 bedrooms

Katie’s Cozy Casa❣️
Entire Place • 1 bedroom

Aldous Huxley Historic Farm Cabin Hot Tubs Saunas
Entire Place • 1 bedroom
Note: Performance varies based on location, size, amenities, seasonality, and management quality. Data reflects the past 12 months.
Top Performing Airbnb Hosts in San Cristobal (2025)
Learn from the best! This table showcases top-performing Airbnb hosts in San Cristobal based on the number of properties managed and estimated total revenue over the past year. Analyze their scale and performance metrics.
| Host Name | Properties | Grossing Revenue | Stay Reviews | Avg Rating |
|---|---|---|---|---|
| Sia & Eric | 9 | $161,270 | 1219 | 4.74/5.0 |
| Brittaney | 1 | $62,805 | 10 | 5.00/5.0 |
| Robban | 2 | $44,948 | 313 | 4.95/5.0 |
| Aline | 2 | $36,650 | 177 | 4.92/5.0 |
| Evolve | 1 | $34,644 | 44 | 4.95/5.0 |
| Candi | 1 | $15,706 | 19 | 5.00/5.0 |
| Summer | 1 | $11,684 | 36 | 4.97/5.0 |
Analyzing the strategies of top hosts, such as their property selection, pricing, and guest communication, can offer valuable lessons for optimizing your own Airbnb operations in San Cristobal.
Dive Deeper: Advanced San Cristobal STR Market Data (2025)
Ready to unlock more insights? AirROI provides access to advanced metrics and comprehensive Airbnb data for San Cristobal. Explore detailed analytics beyond this report to refine your investment strategy, optimize pricing, and maximize your vacation rental profits.
Explore Advanced MetricsSan Cristobal Short-Term Rental Market Composition (2025): Property & Room Types
Room Type Distribution
Property Type Distribution
Market Composition Insights for San Cristobal
- The San Cristobal Airbnb market composition is heavily skewed towards Entire Home/Apt listings, which make up 94.1% of the 17 active rentals. This indicates strong guest preference for privacy and space.
- Looking at the property type distribution in San Cristobal, House properties are the most common (47.1%), reflecting the local real estate landscape.
- Houses represent a significant 47.1% portion, catering likely to families or larger groups.
- The presence of 5.9% Hotel/Boutique listings indicates integration with traditional hospitality.
San Cristobal Airbnb Room Capacity Analysis (2025): Bedroom Distribution
Distribution of Listings by Number of Bedrooms
Room Capacity Insights for San Cristobal
- The dominant room capacity in San Cristobal is 1 bedroom listings, making up 58.8% of the market. This suggests a strong demand for properties suitable for couples or solo travelers.
- Together, 1 bedroom and 2 bedrooms properties represent 70.6% of the active Airbnb listings in San Cristobal, indicating a high concentration in these sizes.
- With over half the market (58.8%) consisting of studios or 1-bedroom units, San Cristobal is particularly well-suited for individuals or couples.
San Cristobal Vacation Rental Guest Capacity Trends (2025)
Distribution of Listings by Guest Capacity
Guest Capacity Insights for San Cristobal
- The most common guest capacity trend in San Cristobal vacation rentals is listings accommodating 2 guests (47.1%). This suggests the primary traveler segment is likely couples or solo travelers.
- Properties designed for 2 guests and 4 guests dominate the San Cristobal STR market, accounting for 64.7% of listings.
- A significant 47.1% of listings cater specifically to 1-2 guests, highlighting strong demand from couples and solo travelers in San Cristobal.
- 11.8% of properties accommodate 6+ guests, serving the market segment for larger families or group travel in San Cristobal.
- On average, properties in San Cristobal are equipped to host 3.5 guests.
San Cristobal Airbnb Booking Patterns (2025): Available vs. Booked Days
Available Days Distribution
Booked Days Distribution
Booking Pattern Insights for San Cristobal
- The most common availability pattern in San Cristobal falls within the 181-270 days range, representing 64.7% of listings. This suggests many properties have significant open periods on their calendars.
- Approximately 88.2% of listings show high availability (181+ days open annually), indicating potential for increased bookings or specific owner usage patterns.
- For booked days, the 91-180 days range is most frequent in San Cristobal (64.7%), reflecting common guest stay durations or potential owner blocking patterns.
- A notable 11.8% of properties secure long booking periods (181+ days booked per year), highlighting successful long-term rental strategies or significant owner usage.
San Cristobal Airbnb Minimum Stay Requirements Analysis
Distribution of Listings by Minimum Night Requirement
1 Night
9 listings
52.9% of total
2 Nights
4 listings
23.5% of total
7-29 Nights
2 listings
11.8% of total
30+ Nights
2 listings
11.8% of total
Key Insights
- The most prevalent minimum stay requirement in San Cristobal is 1 Night, adopted by 52.9% of listings. This highlights the market's preference for shorter, flexible bookings.
- A strong majority (76.4%) of the San Cristobal Airbnb data shows acceptance of very short stays (1-2 nights), indicating a dynamic, high-turnover market.
- A significant segment (11.8%) caters to monthly stays (30+ nights) in San Cristobal, pointing to opportunities in the extended-stay market.
Recommendations
- Align with the market by considering a 1 Night minimum stay, as 52.9% of San Cristobal hosts use this setting.
- Explore offering discounts for stays of 30+ nights to attract the 11.8% of the market seeking extended stays.
- Adjust minimum nights based on seasonality – potentially shorter during low season and longer during peak demand periods in San Cristobal.
San Cristobal Airbnb Cancellation Policy Trends Analysis (2025)
Flexible
1 listings
5.9% of total
Moderate
11 listings
64.7% of total
Strict
5 listings
29.4% of total
Cancellation Policy Insights for San Cristobal
- The prevailing Airbnb cancellation policy trend in San Cristobal is Moderate, used by 64.7% of listings.
- The market strongly favors guest-friendly terms, with 70.6% of listings offering Flexible or Moderate policies. This suggests guests in San Cristobal may expect booking flexibility.
Recommendations for Hosts
- Consider adopting a Moderate policy to align with the 64.7% market standard in San Cristobal.
- Regularly review your cancellation policy against competitors and market demand shifts in San Cristobal.
San Cristobal STR Booking Lead Time Analysis (2025)
Average Booking Lead Time by Month
Booking Lead Time Insights for San Cristobal
- The overall average booking lead time for vacation rentals in San Cristobal is 43 days.
- Guests book furthest in advance for stays during August (average 67 days), likely coinciding with peak travel demand or local events.
- The shortest booking windows occur for stays in November (average 27 days), indicating more last-minute travel plans during this time.
- Seasonally, Summer (57 days avg.) sees the longest lead times, while Fall (35 days avg.) has the shortest, reflecting typical travel planning cycles.
Recommendations for Hosts
- Use the overall average lead time (43 days) as a baseline for your pricing and availability strategy in San Cristobal.
- For August stays, consider implementing length-of-stay discounts or slightly higher rates for bookings made less than 67 days out to capitalize on advance planning.
- Target marketing efforts for the Summer season well in advance (at least 57 days) to capture early planners.
- Monitor your own booking lead times against these San Cristobal averages to identify opportunities for dynamic pricing adjustments.
Popular & Essential Airbnb Amenities in San Cristobal (2025)
Amenity Prevalence
Amenity Insights for San Cristobal
- Essential amenities in San Cristobal that guests expect include: Wifi, Free parking on premises. Lacking these (any) could significantly impact bookings.
- Popular amenities like Hot water, Bed linens, Heating are common but not universal. Offering these can provide a competitive edge.
Recommendations for Hosts
- Ensure your listing includes all essential amenities for San Cristobal: Wifi, Free parking on premises.
- Consider adding popular differentiators like Hot water or Bed linens to increase appeal.
- Highlight unique or less common amenities you offer (e.g., hot tub, dedicated workspace, EV charger) in your listing description and photos.
- Regularly check competitor amenities in San Cristobal to stay competitive.
San Cristobal Airbnb Guest Demographics & Profile Analysis (2025)
Guest Profile Summary for San Cristobal
- The typical guest profile for Airbnb in San Cristobal consists of primarily domestic travelers (96%), often arriving from nearby Albuquerque, typically belonging to the Post-2000s (Gen Z/Alpha) group (50%), primarily speaking English or Spanish.
- Domestic travelers account for 95.7% of guests.
- Key international markets include United States (95.7%) and Mexico (1.4%).
- Top languages spoken are English (68.8%) followed by Spanish (17.5%).
- A significant demographic segment is the Post-2000s (Gen Z/Alpha) group, representing 50% of guests.
Recommendations for Hosts
- Target domestic marketing efforts towards travelers from Albuquerque and Denver.
- Tailor amenities and listing descriptions to appeal to the dominant Post-2000s (Gen Z/Alpha) demographic (e.g., highlight fast WiFi, smart home features, local guides).
- Highlight unique local experiences or amenities relevant to the primary guest profile.
- Consider seasonal promotions aligned with peak travel times for key origin markets.
Nearby Short-Term Rental Market Comparison
How does the San Cristobal Airbnb market stack up against its neighbors? Compare key performance metrics like average monthly revenue, ADR, and occupancy rates in surrounding areas to understand the broader regional STR landscape.
| Market | Active Properties | Monthly Revenue | Daily Rate | Avg. Occupancy |
|---|---|---|---|---|
| Santa Fe | 1,676 | $3,756 | $286.54 | 49% |
| Valdez | 30 | $3,205 | $317.79 | 38% |
| Arroyo Seco | 57 | $3,060 | $298.72 | 42% |
| El Prado | 225 | $2,913 | $231.32 | 48% |
| Tres Piedras | 16 | $2,846 | $182.08 | 49% |
| Angel Fire | 621 | $2,806 | $321.04 | 35% |
| Los Cerrillos | 22 | $2,703 | $202.91 | 44% |
| Jemez Springs | 40 | $2,645 | $181.90 | 52% |
| Placitas | 31 | $2,638 | $219.14 | 53% |
| Abiquiu | 41 | $2,580 | $200.49 | 51% |