City of Glen Cove Airbnb Market Analysis 2025: Short Term Rental Data & Vacation Rental Statistics in New York, United States
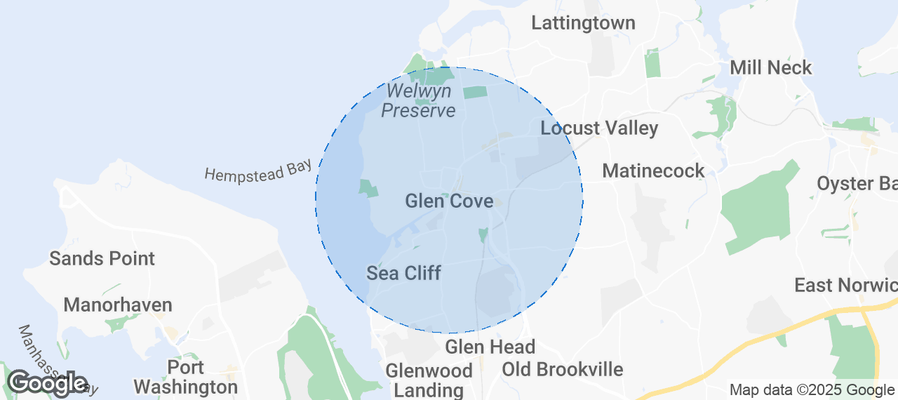
Is Airbnb profitable in City of Glen Cove in 2025? Explore comprehensive Airbnb analytics for City of Glen Cove, New York, United States to uncover income potential. This 2025 STR market report for City of Glen Cove, based on AirROI data from October 2024 to September 2025, reveals key trends in the niche market of 18 active listings.
Whether you're considering an Airbnb investment in City of Glen Cove, optimizing your existing vacation rental, or exploring rental arbitrage opportunities, understanding the City of Glen Cove Airbnb data is crucial. Leveraging the low regulation environment is key to maximizing your short term rental income potential. Let's dive into the specifics.
Key City of Glen Cove Airbnb Performance Metrics Overview
Monthly Airbnb Revenue Variations & Income Potential in City of Glen Cove (2025)
Understanding the monthly revenue variations for Airbnb listings in City of Glen Cove is key to maximizing your short term rental income potential. Seasonality significantly impacts earnings. Our analysis, based on data from the past 12 months, shows that the peak revenue month for STRs in City of Glen Cove is typically October, while February often presents the lowest earnings, highlighting opportunities for strategic pricing adjustments during shoulder and low seasons. Explore the typical Airbnb income in City of Glen Cove across different performance tiers:
- Best-in-class properties (Top 10%) achieve $8,101+ monthly, often utilizing dynamic pricing and superior guest experiences.
- Strong performing properties (Top 25%) earn $6,369 or more, indicating effective management and desirable locations/amenities.
- Typical properties (Median) generate around $4,043 per month, representing the average market performance.
- Entry-level properties (Bottom 25%) see earnings around $2,457, often with potential for optimization.
Average Monthly Airbnb Earnings Trend in City of Glen Cove
City of Glen Cove Airbnb Occupancy Rate Trends (2025)
Maximize your bookings by understanding the City of Glen Cove STR occupancy trends. Seasonal demand shifts significantly influence how often properties are booked. Typically, Octobersees the highest demand (peak season occupancy), while September experiences the lowest (low season). Effective strategies, like adjusting minimum stays or offering promotions, can boost occupancy during slower periods. Here's how different property tiers perform in City of Glen Cove:
- Best-in-class properties (Top 10%) achieve 89%+ occupancy, indicating high desirability and potentially optimized availability.
- Strong performing properties (Top 25%) maintain 75% or higher occupancy, suggesting good market fit and guest satisfaction.
- Typical properties (Median) have an occupancy rate around 52%.
- Entry-level properties (Bottom 25%) average 39% occupancy, potentially facing higher vacancy.
Average Monthly Occupancy Rate Trend in City of Glen Cove
Average Daily Rate (ADR) Airbnb Trends in City of Glen Cove (2025)
Effective short term rental pricing strategy in City of Glen Cove involves understanding monthly ADR fluctuations. The Average Daily Rate (ADR) for Airbnb in City of Glen Cove typically peaks in August and dips lowest during April. Leveraging Airbnb dynamic pricing tools or strategies based on this seasonality can significantly boost revenue. Here's a look at the typical nightly rates achieved:
- Best-in-class properties (Top 10%) command rates of $910+ per night, often due to premium features or locations.
- Strong performing properties (Top 25%) achieve nightly rates of $446 or more.
- Typical properties (Median) charge around $289 per night.
- Entry-level properties (Bottom 25%) earn around $140 per night.
Average Daily Rate (ADR) Trend by Month in City of Glen Cove
Get Live City of Glen Cove Market Intelligence 👇
Explore Real-time Analytics
Airbnb Seasonality Analysis & Trends in City of Glen Cove (2025)
Peak Season (October, July, May)
- Revenue averages $6,371 per month
- Occupancy rates average 66.9%
- Daily rates average $385
Shoulder Season
- Revenue averages $5,188 per month
- Occupancy maintains around 56.1%
- Daily rates hold near $376
Low Season (February, March, September)
- Revenue drops to average $3,044 per month
- Occupancy decreases to average 42.5%
- Daily rates adjust to average $373
Seasonality Insights for City of Glen Cove
- The Airbnb seasonality in City of Glen Cove shows highly seasonal trends requiring careful strategy. While the sections above show seasonal averages, it's also insightful to look at the extremes:
- During the high season, the absolute peak month showcases City of Glen Cove's highest earning potential, with monthly revenues capable of climbing to $6,478, occupancy reaching a high of 74.6%, and ADRs peaking at $404.
- Conversely, the slowest single month of the year, typically falling within the low season, marks the market's lowest point. In this month, revenue might dip to $1,959, occupancy could drop to 37.6%, and ADRs may adjust down to $360.
- Understanding both the seasonal averages and these monthly peaks and troughs in revenue, occupancy, and ADR is crucial for maximizing your Airbnb profit potential in City of Glen Cove.
Seasonal Strategies for Maximizing Profit
- Peak Season: Maximize revenue through premium pricing and potentially longer minimum stays. Ensure high availability.
- Low Season: Offer competitive pricing, special promotions (e.g., extended stay discounts), and flexible cancellation policies. Target off-season travelers like remote workers or budget-conscious guests.
- Shoulder Seasons: Implement dynamic pricing that balances peak and low rates. Target weekend travelers or specific events. Offer slightly more flexible terms than peak season.
- Regularly analyze your own performance against these City of Glen Cove seasonality benchmarks and adjust your pricing and availability strategy accordingly.
Best Areas for Airbnb Investment in City of Glen Cove (2025)
Exploring the top neighborhoods for short-term rentals in City of Glen Cove? This section highlights key areas, outlining why they are attractive for hosts and guests, along with notable local attractions. Consider these locations based on your target guest profile and investment strategy.
| Neighborhood / Area | Why Host Here? (Target Guests & Appeal) | Key Attractions & Landmarks |
|---|---|---|
| Glen Cove Marina | A picturesque waterfront area that attracts visitors with its scenic views, boating activities, and proximity to the Long Island Sound. It's perfect for vacationers looking for relaxation by the water. | Glen Cove Marina, Morgan Park, Sea Cliff Beach, Garvies Point Museum and Preserve, Brewster Street Recreation Center |
| Downtown Glen Cove | The bustling heart of Glen Cove featuring shops, restaurants, and cultural attractions. Ideal for tourists wanting to explore local life and enjoy easy access to amenities. | Glen Cove Village Square, Garvies Point Museum, The Downtown Arts District, Catherine's Park, Local restaurants and shops |
| Crescent Beach | A quiet and inviting beach area that provides a tranquil escape, ideal for families and individuals looking for a peaceful retreat. Offers beautiful beach access and recreational activities. | Crescent Beach, Morgan Park, Nearby parks and trails, Water sports activities, Beachfront dining options |
| Sea Cliff | A charming village located adjacent to Glen Cove, known for its stunning views of the Long Island Sound and a quaint, small-town atmosphere. Attracts visitors looking for a relaxed getaway. | Sea Cliff Beach, Sea Cliff Village Center, Baxter Pond, Local art galleries, Scenic waterfront parks |
| Lattingtown | A serene residential neighborhood with a mix of history and natural beauty, perfect for guests seeking a quiet place while being close to Glen Cove's attractions. | Planting Fields Arboretum, Nearby nature trails, Historic sites, Local parks, Cultural events in the area |
| Brookville | An upscale suburb offering a luxurious stay surrounded by lush greenery and elegant homes. Great for visitors wanting a quieter, upscale experience. | Old Westbury Gardens, Nearby golf courses, Scenic parks, Historic mansions, Fine dining options |
| Glen Cove Historic District | An area rich in history featuring beautiful architecture and cultural heritage. Ideal for history buffs and those looking to explore Glen Cove's past. | Glen Cove Mansion, Historic buildings, Local museums, Walking tours, Nearby shops and cafes |
| Oyster Bay | Just a short drive from Glen Cove, it offers a charming waterfront experience with historical significance and outdoor activities, making it a popular spot for day trippers. | Oyster Bay Town Park, Sagamore Hill National Historic Site, Local restaurants, Boating and fishing opportunities, Nature walks and tours |
Understanding Airbnb License Requirements & STR Laws in City of Glen Cove (2025)
While City of Glen Cove, New York, United States currently shows low STR regulations, specific Airbnb license requirements might still exist or change. Always verify the latest short term rental regulations and Airbnb license requirements directly with local government authorities for City of Glen Cove to ensure full compliance before hosting.
(Source: AirROI data, 2025, finding no licensed listings among those analyzed)
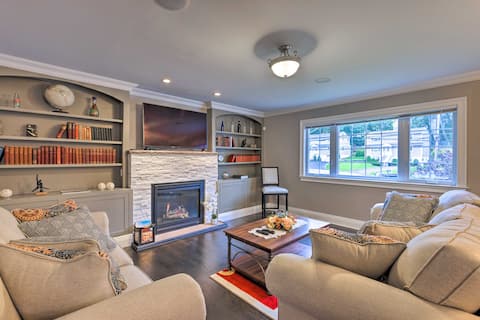
Top Performing Airbnb Properties in City of Glen Cove (2025)
Benchmark your potential! Explore examples of top-performing Airbnb properties in City of Glen Covebased on Trailing Twelve Month (TTM) revenue. Analyze their characteristics, revenue, occupancy rate, and ADR to understand what drives success in this market.
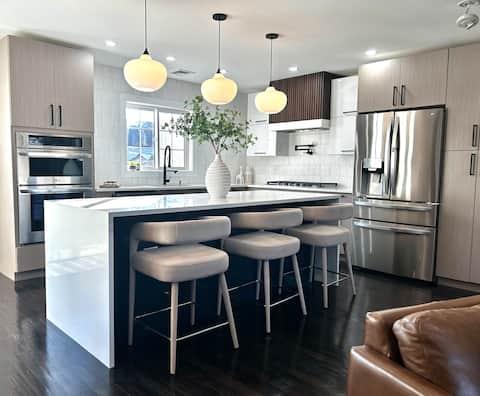
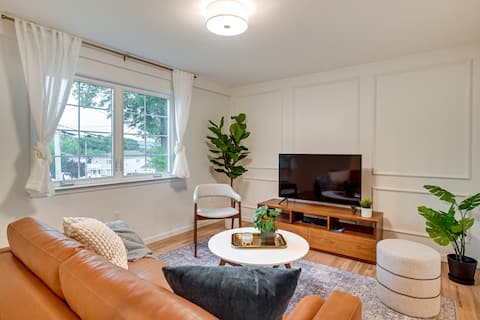
Four levels of stylish living
Entire Place • 4 bedrooms
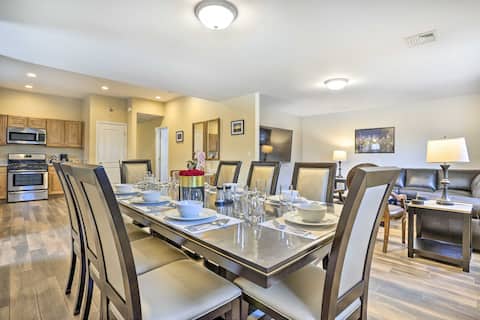
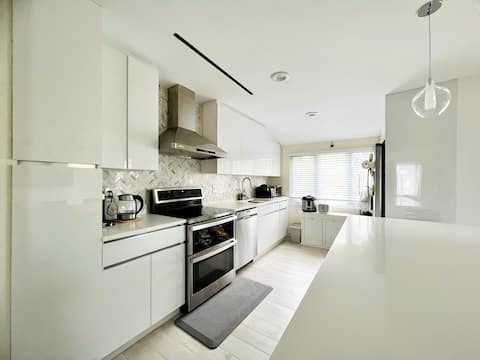
Ideally Located Glen Cove Apartment!
Entire Place • 3 bedrooms
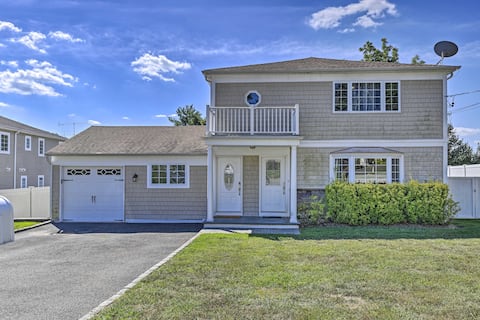
25 Mi to NYC: Walkable Long Island Apt w/ Balcony
Entire Place • 3 bedrooms
Glen Cove Vacation Rental < 1 Mi to Downtown!
Entire Place • 2 bedrooms
Beautiful 3bedrooms Home@Glen Cove
Entire Place • 3 bedrooms
Glen Cove Home: Walk to Boardwalk + Dining!
Entire Place • 3 bedrooms
Note: Performance varies based on location, size, amenities, seasonality, and management quality. Data reflects the past 12 months.
Top Performing Airbnb Hosts in City of Glen Cove (2025)
Learn from the best! This table showcases top-performing Airbnb hosts in City of Glen Cove based on the number of properties managed and estimated total revenue over the past year. Analyze their scale and performance metrics.
| Host Name | Properties | Grossing Revenue | Stay Reviews | Avg Rating |
|---|---|---|---|---|
| Evolve | 5 | $292,131 | 195 | 4.48/5.0 |
| Carmen | 1 | $129,895 | 30 | 4.93/5.0 |
| Aggie | 1 | $72,358 | 49 | 4.92/5.0 |
| Mike & Lucy | 1 | $41,445 | 178 | 4.96/5.0 |
| Al | 1 | $29,389 | 50 | 4.52/5.0 |
| Lilly | 2 | $20,669 | 140 | 4.92/5.0 |
| Vagan | 1 | $13,089 | 10 | 4.90/5.0 |
| Tina | 1 | $12,550 | 33 | 4.94/5.0 |
| Benjamin | 1 | $9,033 | 2 | Not Rated |
| Flora | 1 | $8,654 | 38 | 4.89/5.0 |
Analyzing the strategies of top hosts, such as their property selection, pricing, and guest communication, can offer valuable lessons for optimizing your own Airbnb operations in City of Glen Cove.
Dive Deeper: Advanced City of Glen Cove STR Market Data (2025)
Ready to unlock more insights? AirROI provides access to advanced metrics and comprehensive Airbnb data for City of Glen Cove. Explore detailed analytics beyond this report to refine your investment strategy, optimize pricing, and maximize your vacation rental profits.
Explore Advanced MetricsCity of Glen Cove Short-Term Rental Market Composition (2025): Property & Room Types
Room Type Distribution
Property Type Distribution
Market Composition Insights for City of Glen Cove
- The City of Glen Cove Airbnb market composition is heavily skewed towards Entire Home/Apt listings, which make up 72.2% of the 18 active rentals. This indicates strong guest preference for privacy and space.
- Looking at the property type distribution in City of Glen Cove, House properties are the most common (50%), reflecting the local real estate landscape.
- Houses represent a significant 50% portion, catering likely to families or larger groups.
City of Glen Cove Airbnb Room Capacity Analysis (2025): Bedroom Distribution
Distribution of Listings by Number of Bedrooms
Room Capacity Insights for City of Glen Cove
- The dominant room capacity in City of Glen Cove is 3 bedrooms listings, making up 22.2% of the market. This suggests a strong demand for properties suitable for families or small groups.
- Together, 3 bedrooms and 4 bedrooms properties represent 38.9% of the active Airbnb listings in City of Glen Cove, indicating a high concentration in these sizes.
- A significant 44.5% of listings offer 3+ bedrooms, catering to larger groups and families seeking more space in City of Glen Cove.
City of Glen Cove Vacation Rental Guest Capacity Trends (2025)
Distribution of Listings by Guest Capacity
Guest Capacity Insights for City of Glen Cove
- The most common guest capacity trend in City of Glen Cove vacation rentals is listings accommodating 8+ guests (22.2%). This suggests the primary traveler segment is likely larger groups.
- Properties designed for 8+ guests and 6 guests dominate the City of Glen Cove STR market, accounting for 44.4% of listings.
- 44.4% of properties accommodate 6+ guests, serving the market segment for larger families or group travel in City of Glen Cove.
- On average, properties in City of Glen Cove are equipped to host 3.9 guests.
City of Glen Cove Airbnb Booking Patterns (2025): Available vs. Booked Days
Available Days Distribution
Booked Days Distribution
Booking Pattern Insights for City of Glen Cove
- The most common availability pattern in City of Glen Cove falls within the 271-366 days range, representing 44.4% of listings. This suggests many properties have significant open periods on their calendars.
- Approximately 72.2% of listings show high availability (181+ days open annually), indicating potential for increased bookings or specific owner usage patterns.
- For booked days, the 1-30 days range is most frequent in City of Glen Cove (33.3%), reflecting common guest stay durations or potential owner blocking patterns.
- A notable 33.3% of properties secure long booking periods (181+ days booked per year), highlighting successful long-term rental strategies or significant owner usage.
City of Glen Cove Airbnb Minimum Stay Requirements Analysis
Distribution of Listings by Minimum Night Requirement
1 Night
5 listings
27.8% of total
2 Nights
5 listings
27.8% of total
3 Nights
3 listings
16.7% of total
7-29 Nights
4 listings
22.2% of total
30+ Nights
1 listings
5.6% of total
Key Insights
- The most prevalent minimum stay requirement in City of Glen Cove is 1 Night, adopted by 27.8% of listings. This highlights the market's preference for shorter, flexible bookings.
Recommendations
- Align with the market by considering a 1 Night minimum stay, as 27.8% of City of Glen Cove hosts use this setting.
- If feasible, allowing 1-night stays, especially midweek or during low season, could capture last-minute bookings, as only 27.8% currently do.
- Explore offering discounts for stays of 30+ nights to attract the 5.6% of the market seeking extended stays.
- Adjust minimum nights based on seasonality – potentially shorter during low season and longer during peak demand periods in City of Glen Cove.
City of Glen Cove Airbnb Cancellation Policy Trends Analysis (2025)
Super Strict 60 Days
1 listings
5.6% of total
Flexible
3 listings
16.7% of total
Moderate
2 listings
11.1% of total
Firm
5 listings
27.8% of total
Strict
7 listings
38.9% of total
Cancellation Policy Insights for City of Glen Cove
- The prevailing Airbnb cancellation policy trend in City of Glen Cove is Strict, used by 38.9% of listings.
- A majority (66.7%) of hosts in City of Glen Cove utilize Firm or Strict policies, indicating a market where hosts prioritize booking security.
Recommendations for Hosts
- Consider adopting a Strict policy to align with the 38.9% market standard in City of Glen Cove.
- With 38.9% using Strict terms, this is a viable option in City of Glen Cove, particularly for high-value properties or during peak demand periods.
- Regularly review your cancellation policy against competitors and market demand shifts in City of Glen Cove.
City of Glen Cove STR Booking Lead Time Analysis (2025)
Average Booking Lead Time by Month
Booking Lead Time Insights for City of Glen Cove
- The overall average booking lead time for vacation rentals in City of Glen Cove is 64 days.
- Guests book furthest in advance for stays during September (average 150 days), likely coinciding with peak travel demand or local events.
- The shortest booking windows occur for stays in March (average 19 days), indicating more last-minute travel plans during this time.
- Seasonally, Summer (80 days avg.) sees the longest lead times, while Winter (43 days avg.) has the shortest, reflecting typical travel planning cycles.
Recommendations for Hosts
- Use the overall average lead time (64 days) as a baseline for your pricing and availability strategy in City of Glen Cove.
- For September stays, consider implementing length-of-stay discounts or slightly higher rates for bookings made less than 150 days out to capitalize on advance planning.
- Target marketing efforts for the Summer season well in advance (at least 80 days) to capture early planners.
- Monitor your own booking lead times against these City of Glen Cove averages to identify opportunities for dynamic pricing adjustments.
Popular & Essential Airbnb Amenities in City of Glen Cove (2025)
Amenity Prevalence
Amenity Insights for City of Glen Cove
- Essential amenities in City of Glen Cove that guests expect include: Wifi, Air conditioning. Lacking these (any) could significantly impact bookings.
- Popular amenities like Heating, TV, Smoke alarm are common but not universal. Offering these can provide a competitive edge.
Recommendations for Hosts
- Ensure your listing includes all essential amenities for City of Glen Cove: Wifi, Air conditioning.
- Consider adding popular differentiators like Heating or TV to increase appeal.
- Highlight unique or less common amenities you offer (e.g., hot tub, dedicated workspace, EV charger) in your listing description and photos.
- Regularly check competitor amenities in City of Glen Cove to stay competitive.
City of Glen Cove Airbnb Guest Demographics & Profile Analysis (2025)
Guest Profile Summary for City of Glen Cove
- The typical guest profile for Airbnb in City of Glen Cove consists of primarily domestic travelers (93%), often arriving from nearby New York, typically belonging to the Post-2000s (Gen Z/Alpha) group (50%), primarily speaking English or Spanish.
- Domestic travelers account for 92.7% of guests.
- Key international markets include United States (92.7%) and Canada (1.8%).
- Top languages spoken are English (62.7%) followed by Spanish (13.3%).
- A significant demographic segment is the Post-2000s (Gen Z/Alpha) group, representing 50% of guests.
Recommendations for Hosts
- Target domestic marketing efforts towards travelers from New York and Chicago.
- Tailor amenities and listing descriptions to appeal to the dominant Post-2000s (Gen Z/Alpha) demographic (e.g., highlight fast WiFi, smart home features, local guides).
- Highlight unique local experiences or amenities relevant to the primary guest profile.
- Consider seasonal promotions aligned with peak travel times for key origin markets.
Nearby Short-Term Rental Market Comparison
How does the City of Glen Cove Airbnb market stack up against its neighbors? Compare key performance metrics like average monthly revenue, ADR, and occupancy rates in surrounding areas to understand the broader regional STR landscape.
| Market | Active Properties | Monthly Revenue | Daily Rate | Avg. Occupancy |
|---|---|---|---|---|
| Frankford Township | 12 | $5,803 | $571.00 | 44% |
| Spring Lake Heights | 17 | $5,495 | $699.58 | 41% |
| Town of East Hampton | 1,382 | $5,429 | $982.56 | 33% |
| Town of Kingston | 13 | $5,231 | $438.70 | 46% |
| Town of Southampton | 1,254 | $5,227 | $984.78 | 32% |
| Town of Pound Ridge | 18 | $5,204 | $574.35 | 44% |
| Monmouth Beach | 13 | $5,203 | $660.27 | 40% |
| Town of Pleasant Valley | 31 | $5,051 | $509.89 | 40% |
| Surf City | 44 | $5,032 | $731.22 | 42% |
| Town of Putnam Valley | 52 | $4,995 | $422.23 | 45% |