Inlet Airbnb Market Analysis 2026: Short Term Rental Data & Vacation Rental Statistics in New York, United States
Is Airbnb profitable in Inlet in 2026? Explore comprehensive Airbnb analytics for Inlet, New York, United States to uncover income potential. This 2026 STR market report for Inlet, based on AirROI data from February 2025 to January 2026, reveals key trends in the niche market of 69 active listings.
Whether you're considering an Airbnb investment in Inlet, optimizing your existing vacation rental, or exploring rental arbitrage opportunities, understanding the Inlet Airbnb data is crucial. Leveraging the low regulation environment is key to maximizing your short term rental income potential. Let's dive into the specifics.
Key Inlet Airbnb Performance Metrics Overview
Monthly Airbnb Revenue Variations & Income Potential in Inlet (2026)
Understanding the monthly revenue variations for Airbnb listings in Inlet is key to maximizing your short term rental income potential. Seasonality significantly impacts earnings. Our analysis, based on data from the past 12 months, shows that the peak revenue month for STRs in Inlet is typically July, while March often presents the lowest earnings, highlighting opportunities for strategic pricing adjustments during shoulder and low seasons. Explore the typical Airbnb income in Inlet across different performance tiers:
- Best-in-class properties (Top 10%) achieve $7,229+ monthly, often utilizing dynamic pricing and superior guest experiences.
- Strong performing properties (Top 25%) earn $4,749 or more, indicating effective management and desirable locations/amenities.
- Typical properties (Median) generate around $2,957 per month, representing the average market performance.
- Entry-level properties (Bottom 25%) see earnings around $1,878, often with potential for optimization.
Average Monthly Airbnb Earnings Trend in Inlet
Inlet Airbnb Occupancy Rate Trends (2026)
Maximize your bookings by understanding the Inlet STR occupancy trends. Seasonal demand shifts significantly influence how often properties are booked. Typically, Julysees the highest demand (peak season occupancy), while June experiences the lowest (low season). Effective strategies, like adjusting minimum stays or offering promotions, can boost occupancy during slower periods. Here's how different property tiers perform in Inlet:
- Best-in-class properties (Top 10%) achieve 58%+ occupancy, indicating high desirability and potentially optimized availability.
- Strong performing properties (Top 25%) maintain 42% or higher occupancy, suggesting good market fit and guest satisfaction.
- Typical properties (Median) have an occupancy rate around 26%.
- Entry-level properties (Bottom 25%) average 16% occupancy, potentially facing higher vacancy.
Average Monthly Occupancy Rate Trend in Inlet
Average Daily Rate (ADR) Airbnb Trends in Inlet (2026)
Effective short term rental pricing strategy in Inlet involves understanding monthly ADR fluctuations. The Average Daily Rate (ADR) for Airbnb in Inlet typically peaks in August and dips lowest during April. Leveraging Airbnb dynamic pricing tools or strategies based on this seasonality can significantly boost revenue. Here's a look at the typical nightly rates achieved:
- Best-in-class properties (Top 10%) command rates of $625+ per night, often due to premium features or locations.
- Strong performing properties (Top 25%) achieve nightly rates of $473 or more.
- Typical properties (Median) charge around $407 per night.
- Entry-level properties (Bottom 25%) earn around $327 per night.
Average Daily Rate (ADR) Trend by Month in Inlet
Get Live Inlet Market Intelligence 👇

Explore Real-time Analytics
Airbnb Seasonality Analysis & Trends in Inlet (2026)
Peak Season (July, August, October)
- Revenue averages $6,417 per month
- Occupancy rates average 52.2%
- Daily rates average $424
Shoulder Season
- Revenue averages $3,215 per month
- Occupancy maintains around 25.9%
- Daily rates hold near $417
Low Season (March, June, November)
- Revenue drops to average $2,455 per month
- Occupancy decreases to average 22.1%
- Daily rates adjust to average $419
Seasonality Insights for Inlet
- The Airbnb seasonality in Inlet shows highly seasonal trends requiring careful strategy. While the sections above show seasonal averages, it's also insightful to look at the extremes:
- During the high season, the absolute peak month showcases Inlet's highest earning potential, with monthly revenues capable of climbing to $8,281, occupancy reaching a high of 69.2%, and ADRs peaking at $428.
- Conversely, the slowest single month of the year, typically falling within the low season, marks the market's lowest point. In this month, revenue might dip to $2,386, occupancy could drop to 20.7%, and ADRs may adjust down to $403.
- Understanding both the seasonal averages and these monthly peaks and troughs in revenue, occupancy, and ADR is crucial for maximizing your Airbnb profit potential in Inlet.
Seasonal Strategies for Maximizing Profit
- Peak Season: Maximize revenue through premium pricing and potentially longer minimum stays. Ensure high availability.
- Low Season: Offer competitive pricing, special promotions (e.g., extended stay discounts), and flexible cancellation policies. Target off-season travelers like remote workers or budget-conscious guests.
- Shoulder Seasons: Implement dynamic pricing that balances peak and low rates. Target weekend travelers or specific events. Offer slightly more flexible terms than peak season.
- Regularly analyze your own performance against these Inlet seasonality benchmarks and adjust your pricing and availability strategy accordingly.
Best Areas for Airbnb Investment in Inlet (2026)
Exploring the top neighborhoods for short-term rentals in Inlet? This section highlights key areas, outlining why they are attractive for hosts and guests, along with notable local attractions. Consider these locations based on your target guest profile and investment strategy.
| Neighborhood / Area | Why Host Here? (Target Guests & Appeal) | Key Attractions & Landmarks |
|---|---|---|
| Inlet Beach | A serene coastal gem known for its beautiful white sandy beaches and crystal-clear waters. Ideal for vacationers looking to escape and relax in a peaceful environment, with proximity to scenic views and outdoor activities. | Inlet Beach, Camp Helen State Park, Rosemary Beach, Thomas Drive, 30A Bike Trail |
| Lake George | A popular tourist destination known for its stunning lake and surrounding mountains. Offers a range of outdoor activities and is a perfect summer getaway for families, making it a favored choice for Airbnb investments. | Lake George, Fort William Henry, Six Flags Great Escape, Thousand Islands, Adirondack Park |
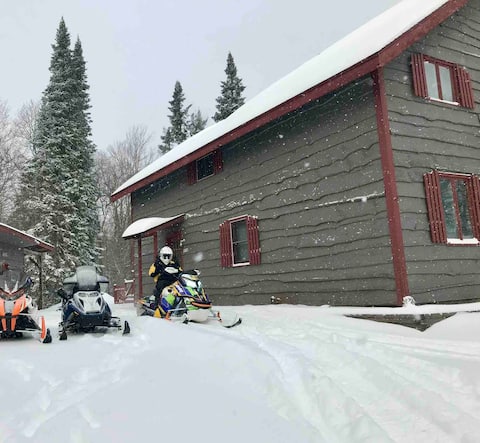
| Old Forge | Known as the 'Gateway to the Adirondacks', Old Forge offers year-round adventure opportunities such as hiking, snowmobiling, and lake activities. Attracts nature lovers and outdoor enthusiasts. | Old Forge Lakefront, Enchanted Forest Water Safari, McCauley Mountain, Adirondack Scenic Railroad, Thendara Golf Club |
| Ticonderoga | A historic town located at the confluence of Lake George and Lake Champlain. Rich in history and scenic beauty, it's ideal for vacationers interested in both relaxation and exploration of past events. | Fort Ticonderoga, Ticonderoga Wilderness, Mount Defiance, The Ticonderoga Art Gallery, The Hancock House |
| Saranac Lake | A picturesque village that serves as a gateway to the Adirondack high peaks region. Known for its vibrant cultural scene and outdoor recreation, attracting both adventure seekers and relaxation enthusiasts. | Saranac Lake, Lake Flower, Ampersand Park, The Saranac Laboratory Museum, Brewery Tours |
| Bolton Landing | A charming lakeside community known for its upscale homes and stunning views of Lake George. Very appealing for tourists seeking a mix of leisure and luxury on the water. | Bolton Landing, Lake George, The Sagamore Resort, Boulder Lake, Hikings in Tongue Mountain Range |
| Keene Valley | A small hamlet nestled in the heart of the Adirondack mountains, favored for its hiking trails and breathtaking landscapes. Great for those looking to cater to outdoor enthusiasts and nature lovers. | High Peaks, St. Hubert’s Chapel, AuSable River, Keene Valley Library, Adirondack Mountain Club |
| Lake Placid | Famous for hosting the Winter Olympics, Lake Placid is a vibrant destination that combines outdoor activities with a charming village atmosphere, appealing to tourists year-round. | Mirror Lake, Olympic Sports Complex, Whiteface Mountain, Lake Placid Olympic Museum, High Falls Gorge |
Understanding Airbnb License Requirements & STR Laws in Inlet (2026)
While Inlet, New York, United States currently shows low STR regulations, specific Airbnb license requirements might still exist or change. Always verify the latest short term rental regulations and Airbnb license requirements directly with local government authorities for Inlet to ensure full compliance before hosting.
(Source: AirROI data, 2026, finding no licensed listings among those analyzed)
Top Performing Airbnb Properties in Inlet (2026)
Benchmark your potential! Explore examples of top-performing Airbnb properties in Inletbased on Trailing Twelve Month (TTM) revenue. Analyze their characteristics, revenue, occupancy rate, and ADR to understand what drives success in this market.

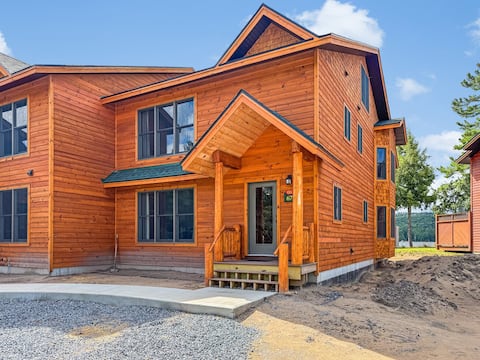
Adirondack Cabin | Grill | Fire Pit | Trail Access
Entire Place • 3 bedrooms
Adirondack Family Getaway- A Home Away from Home
Entire Place • 5 bedrooms

The Sixth Lake Retreat
Entire Place • 5 bedrooms

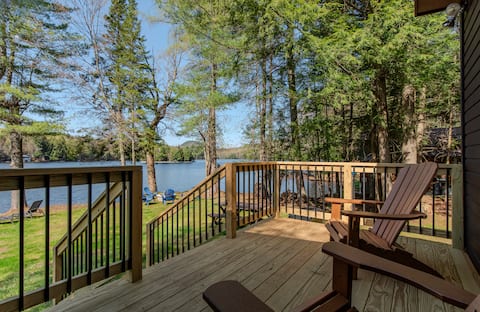
Lake Access/ADK/Trails/Near Old Forge
Entire Place • 3 bedrooms
Townhome O1 - Luxury Waterfront Home on 4th Lake
Entire Place • 3 bedrooms
Sixth Lake Retreat
Entire Place • 3 bedrooms
Note: Performance varies based on location, size, amenities, seasonality, and management quality. Data reflects the past 12 months.
Top Performing Airbnb Hosts in Inlet (2026)
Learn from the best! This table showcases top-performing Airbnb hosts in Inlet based on the number of properties managed and estimated total revenue over the past year. Analyze their scale and performance metrics.
| Host Name | Properties | Grossing Revenue | Stay Reviews | Avg Rating |
|---|---|---|---|---|
| Scott | 22 | $275,254 | 93 | 4.86/5.0 |
| Jon | 2 | $106,265 | 239 | 4.87/5.0 |
| Jacqueline | 3 | $103,808 | 92 | 4.92/5.0 |
| Bryan | 6 | $102,432 | 37 | 5.00/5.0 |
| Kathleen | 2 | $92,818 | 12 | 5.00/5.0 |
| Katherine | 2 | $82,322 | 31 | 4.95/5.0 |
| Nick | 1 | $81,764 | 94 | 4.95/5.0 |
| Marilyn | 4 | $80,748 | 11 | 5.00/5.0 |
| Melissa | 6 | $73,228 | 29 | 4.89/5.0 |
| Mark | 1 | $57,753 | 23 | 5.00/5.0 |
Analyzing the strategies of top hosts, such as their property selection, pricing, and guest communication, can offer valuable lessons for optimizing your own Airbnb operations in Inlet.
Dive Deeper: Advanced Inlet STR Market Data (2026)
Ready to unlock more insights? AirROI provides access to advanced metrics and comprehensive Airbnb data for Inlet. Explore detailed analytics beyond this report to refine your investment strategy, optimize pricing, and maximize your vacation rental profits.
Explore Advanced MetricsInlet Short-Term Rental Market Composition (2026): Property & Room Types
Room Type Distribution
Property Type Distribution
Market Composition Insights for Inlet
- The Inlet Airbnb market composition is heavily skewed towards Entire Home/Apt listings, which make up 100% of the 69 active rentals. This indicates strong guest preference for privacy and space.
- Looking at the property type distribution in Inlet, House properties are the most common (62.3%), reflecting the local real estate landscape.
- Houses represent a significant 62.3% portion, catering likely to families or larger groups.
- Smaller segments like apartment/condo (combined 1.4%) offer potential for unique stay experiences.
Inlet Airbnb Room Capacity Analysis (2026): Bedroom Distribution
Distribution of Listings by Number of Bedrooms
Room Capacity Insights for Inlet
- The dominant room capacity in Inlet is 3 bedrooms listings, making up 52.2% of the market. This suggests a strong demand for properties suitable for families or small groups.
- Together, 3 bedrooms and 2 bedrooms properties represent 72.5% of the active Airbnb listings in Inlet, indicating a high concentration in these sizes.
- A significant 75.3% of listings offer 3+ bedrooms, catering to larger groups and families seeking more space in Inlet.
Inlet Vacation Rental Guest Capacity Trends (2026)
Distribution of Listings by Guest Capacity
Guest Capacity Insights for Inlet
- The most common guest capacity trend in Inlet vacation rentals is listings accommodating 8+ guests (65.2%). This suggests the primary traveler segment is likely larger groups.
- Properties designed for 8+ guests and 6 guests dominate the Inlet STR market, accounting for 79.7% of listings.
- 86.9% of properties accommodate 6+ guests, serving the market segment for larger families or group travel in Inlet.
- On average, properties in Inlet are equipped to host 7.1 guests.
Inlet Airbnb Booking Patterns (2026): Available vs. Booked Days
Available Days Distribution
Booked Days Distribution
Booking Pattern Insights for Inlet
- The most common availability pattern in Inlet falls within the 271-366 days range, representing 81.2% of listings. This suggests many properties have significant open periods on their calendars.
- Approximately 97.1% of listings show high availability (181+ days open annually), indicating potential for increased bookings or specific owner usage patterns.
- For booked days, the 1-30 days range is most frequent in Inlet (40.6%), reflecting common guest stay durations or potential owner blocking patterns.
- A notable 2.9% of properties secure long booking periods (181+ days booked per year), highlighting successful long-term rental strategies or significant owner usage.
Inlet Airbnb Minimum Stay Requirements Analysis
Distribution of Listings by Minimum Night Requirement
1 Night
1 listings
1.4% of total
2 Nights
35 listings
50.7% of total
3 Nights
5 listings
7.2% of total
30+ Nights
28 listings
40.6% of total
Key Insights
- The most prevalent minimum stay requirement in Inlet is 2 Nights, adopted by 50.7% of listings. This highlights the market's preference for shorter, flexible bookings.
- A significant segment (40.6%) caters to monthly stays (30+ nights) in Inlet, pointing to opportunities in the extended-stay market.
Recommendations
- Align with the market by considering a 2 Nights minimum stay, as 50.7% of Inlet hosts use this setting.
- If feasible, allowing 1-night stays, especially midweek or during low season, could capture last-minute bookings, as only 1.4% currently do.
- A 2-night minimum appears standard (50.7%). Consider this for weekends or peak periods.
- Explore offering discounts for stays of 30+ nights to attract the 40.6% of the market seeking extended stays.
- Adjust minimum nights based on seasonality – potentially shorter during low season and longer during peak demand periods in Inlet.
Inlet Airbnb Cancellation Policy Trends Analysis (2026)
Super Strict 30 Days
22 listings
32.4% of total
Flexible
7 listings
10.3% of total
Moderate
13 listings
19.1% of total
Firm
17 listings
25% of total
Strict
9 listings
13.2% of total
Cancellation Policy Insights for Inlet
- The prevailing Airbnb cancellation policy trend in Inlet is Super Strict 30 Days, used by 32.4% of listings.
- There's a relatively balanced mix between guest-friendly (29.4%) and stricter (38.2%) policies, offering choices for different guest needs.
Recommendations for Hosts
- Consider adopting a Super Strict 30 Days policy to align with the 32.4% market standard in Inlet.
- Using a Strict policy might deter some guests, as only 13.2% of listings use it. Evaluate if potential revenue protection outweighs possible lower booking rates.
- Regularly review your cancellation policy against competitors and market demand shifts in Inlet.
Inlet STR Booking Lead Time Analysis (2026)
Average Booking Lead Time by Month
Booking Lead Time Insights for Inlet
- The overall average booking lead time for vacation rentals in Inlet is 104 days.
- Guests book furthest in advance for stays during November (average 125 days), likely coinciding with peak travel demand or local events.
- The shortest booking windows occur for stays in April (average 35 days), indicating more last-minute travel plans during this time.
- Seasonally, Summer (114 days avg.) sees the longest lead times, while Spring (50 days avg.) has the shortest, reflecting typical travel planning cycles.
Recommendations for Hosts
- Use the overall average lead time (104 days) as a baseline for your pricing and availability strategy in Inlet.
- For November stays, consider implementing length-of-stay discounts or slightly higher rates for bookings made less than 125 days out to capitalize on advance planning.
- Target marketing efforts for the Summer season well in advance (at least 114 days) to capture early planners.
- Monitor your own booking lead times against these Inlet averages to identify opportunities for dynamic pricing adjustments.
Popular & Essential Airbnb Amenities in Inlet (2026)
Amenity Prevalence
Amenity Insights for Inlet
- Essential amenities in Inlet that guests expect include: Kitchen, Wifi, Smoke alarm, BBQ grill. Lacking these (any) could significantly impact bookings.
- Popular amenities like Free parking on premises, TV, Refrigerator are common but not universal. Offering these can provide a competitive edge.
Recommendations for Hosts
- Ensure your listing includes all essential amenities for Inlet: Kitchen, Wifi, Smoke alarm, BBQ grill.
- Prioritize adding missing essentials: Kitchen, Wifi, Smoke alarm, BBQ grill.
- Consider adding popular differentiators like Free parking on premises or TV to increase appeal.
- Highlight unique or less common amenities you offer (e.g., hot tub, dedicated workspace, EV charger) in your listing description and photos.
- Regularly check competitor amenities in Inlet to stay competitive.
Inlet Airbnb Guest Demographics & Profile Analysis (2026)
Guest Profile Summary for Inlet
- The typical guest profile for Airbnb in Inlet consists of primarily domestic travelers (98%), often arriving from nearby Syracuse, typically belonging to the Post-2000s (Gen Z/Alpha) group (50%), primarily speaking English or German.
- Domestic travelers account for 97.6% of guests.
- Key international markets include United States (97.6%) and DC (0.8%).
- Top languages spoken are English (77.3%) followed by German (6.8%).
- A significant demographic segment is the Post-2000s (Gen Z/Alpha) group, representing 50% of guests.
Recommendations for Hosts
- Target domestic marketing efforts towards travelers from Syracuse and Buffalo.
- Tailor amenities and listing descriptions to appeal to the dominant Post-2000s (Gen Z/Alpha) demographic (e.g., highlight fast WiFi, smart home features, local guides).
- Highlight unique local experiences or amenities relevant to the primary guest profile.
- Consider seasonal promotions aligned with peak travel times for key origin markets.
Nearby Short-Term Rental Market Comparison
How does the Inlet Airbnb market stack up against its neighbors? Compare key performance metrics like average monthly revenue, ADR, and occupancy rates in surrounding areas to understand the broader regional STR landscape.
| Market | Active Properties | Monthly Revenue | Daily Rate | Avg. Occupancy |
|---|---|---|---|---|
| Town of Trenton | 13 | $7,410 | $484.59 | 43% |
| Middletown Springs | 13 | $6,843 | $507.55 | 32% |
| Fort Ann | 35 | $6,238 | $790.41 | 37% |
| Town of Ancram | 22 | $5,616 | $512.55 | 38% |
| Town of Schodack | 11 | $5,158 | $555.89 | 29% |
| Town of Stillwater | 55 | $5,153 | $564.54 | 42% |
| Monterey | 41 | $5,089 | $470.60 | 44% |
| Malletts Bay | 51 | $4,842 | $444.86 | 41% |
| Town of Wilton | 103 | $4,841 | $862.83 | 38% |
| Colebrook | 10 | $4,710 | $601.82 | 28% |