Levittown Airbnb Market Analysis 2025: Short Term Rental Data & Vacation Rental Statistics in New York, United States
Is Airbnb profitable in Levittown in 2025? Explore comprehensive Airbnb analytics for Levittown, New York, United States to uncover income potential. This 2025 STR market report for Levittown, based on AirROI data from October 2024 to September 2025, reveals key trends in the niche market of 21 active listings.
Whether you're considering an Airbnb investment in Levittown, optimizing your existing vacation rental, or exploring rental arbitrage opportunities, understanding the Levittown Airbnb data is crucial. Leveraging the low regulation environment is key to maximizing your short term rental income potential. Let's dive into the specifics.
Key Levittown Airbnb Performance Metrics Overview
Monthly Airbnb Revenue Variations & Income Potential in Levittown (2025)
Understanding the monthly revenue variations for Airbnb listings in Levittown is key to maximizing your short term rental income potential. Seasonality significantly impacts earnings. Our analysis, based on data from the past 12 months, shows that the peak revenue month for STRs in Levittown is typically August, while February often presents the lowest earnings, highlighting opportunities for strategic pricing adjustments during shoulder and low seasons. Explore the typical Airbnb income in Levittown across different performance tiers:
- Best-in-class properties (Top 10%) achieve $5,137+ monthly, often utilizing dynamic pricing and superior guest experiences.
- Strong performing properties (Top 25%) earn $3,167 or more, indicating effective management and desirable locations/amenities.
- Typical properties (Median) generate around $1,929 per month, representing the average market performance.
- Entry-level properties (Bottom 25%) see earnings around $1,065, often with potential for optimization.
Average Monthly Airbnb Earnings Trend in Levittown
Levittown Airbnb Occupancy Rate Trends (2025)
Maximize your bookings by understanding the Levittown STR occupancy trends. Seasonal demand shifts significantly influence how often properties are booked. Typically, Augustsees the highest demand (peak season occupancy), while March experiences the lowest (low season). Effective strategies, like adjusting minimum stays or offering promotions, can boost occupancy during slower periods. Here's how different property tiers perform in Levittown:
- Best-in-class properties (Top 10%) achieve 90%+ occupancy, indicating high desirability and potentially optimized availability.
- Strong performing properties (Top 25%) maintain 77% or higher occupancy, suggesting good market fit and guest satisfaction.
- Typical properties (Median) have an occupancy rate around 48%.
- Entry-level properties (Bottom 25%) average 30% occupancy, potentially facing higher vacancy.
Average Monthly Occupancy Rate Trend in Levittown
Average Daily Rate (ADR) Airbnb Trends in Levittown (2025)
Effective short term rental pricing strategy in Levittown involves understanding monthly ADR fluctuations. The Average Daily Rate (ADR) for Airbnb in Levittown typically peaks in September and dips lowest during March. Leveraging Airbnb dynamic pricing tools or strategies based on this seasonality can significantly boost revenue. Here's a look at the typical nightly rates achieved:
- Best-in-class properties (Top 10%) command rates of $419+ per night, often due to premium features or locations.
- Strong performing properties (Top 25%) achieve nightly rates of $128 or more.
- Typical properties (Median) charge around $101 per night.
- Entry-level properties (Bottom 25%) earn around $85 per night.
Average Daily Rate (ADR) Trend by Month in Levittown
Get Live Levittown Market Intelligence 👇

Explore Real-time Analytics
Airbnb Seasonality Analysis & Trends in Levittown (2025)
Peak Season (August, May, June)
- Revenue averages $3,407 per month
- Occupancy rates average 66.7%
- Daily rates average $179
Shoulder Season
- Revenue averages $2,721 per month
- Occupancy maintains around 51.9%
- Daily rates hold near $149
Low Season (February, September, November)
- Revenue drops to average $2,172 per month
- Occupancy decreases to average 46.9%
- Daily rates adjust to average $159
Seasonality Insights for Levittown
- The Airbnb seasonality in Levittown shows moderate seasonality with distinct peak and low periods. While the sections above show seasonal averages, it's also insightful to look at the extremes:
- During the high season, the absolute peak month showcases Levittown's highest earning potential, with monthly revenues capable of climbing to $3,665, occupancy reaching a high of 77.7%, and ADRs peaking at $190.
- Conversely, the slowest single month of the year, typically falling within the low season, marks the market's lowest point. In this month, revenue might dip to $2,035, occupancy could drop to 35.9%, and ADRs may adjust down to $139.
- Understanding both the seasonal averages and these monthly peaks and troughs in revenue, occupancy, and ADR is crucial for maximizing your Airbnb profit potential in Levittown.
Seasonal Strategies for Maximizing Profit
- Peak Season: Maximize revenue through premium pricing and potentially longer minimum stays. Ensure high availability.
- Low Season: Offer competitive pricing, special promotions (e.g., extended stay discounts), and flexible cancellation policies. Target off-season travelers like remote workers or budget-conscious guests.
- Shoulder Seasons: Implement dynamic pricing that balances peak and low rates. Target weekend travelers or specific events. Offer slightly more flexible terms than peak season.
- Regularly analyze your own performance against these Levittown seasonality benchmarks and adjust your pricing and availability strategy accordingly.
Best Areas for Airbnb Investment in Levittown (2025)
Exploring the top neighborhoods for short-term rentals in Levittown? This section highlights key areas, outlining why they are attractive for hosts and guests, along with notable local attractions. Consider these locations based on your target guest profile and investment strategy.
| Neighborhood / Area | Why Host Here? (Target Guests & Appeal) | Key Attractions & Landmarks |
|---|---|---|
| Levittown Village | A suburban neighborhood with a strong sense of community and family-friendly atmosphere. Levittown offers easy access to parks and shopping, making it attractive to families and vacationers alike. | Levittown Memorial Park, Old Bethpage Village Restoration, Nassau Veterans Memorial Coliseum, Nearby beaches, Various shopping centers |
| East Meadow | Located nearby, East Meadow has excellent schools and amenities, attracting families and those looking for a peaceful escape. | East Meadow Park, The East Meadow Public Library, Nassau Community College, Nearby golf courses, Shopping plazas |
| Wantagh | A desirable area with a suburban feel, Wantagh boasts numerous parks and is close to Jones Beach, making it popular among beachgoers. | Jones Beach State Park, Wantagh Park, Nearby restaurants, Wantagh Railroad Station, Tanger Outlets |
| Bethpage | Known for its beautiful landscapes and proximity to Bethpage State Park, it's appealing for those who love outdoor activities. | Bethpage State Park, Bethpage Community Park, Golf courses, Local breweries, Historical sites |
| Massapequa | A vibrant area with a strong local culture, Massapequa offers plenty of dining options and easy access to the beach. | Massapequa Park, Local shopping districts, Beaches, Massapequa State Park, Nearby nature trails |
| Hicksville | A central hub for transport, Hicksville has accessibility and shopping, attracting business travelers and families. | Hicksville Rail Road Station, Broadway Mall, Local eateries, Parks, Cultural events |
| Oyster Bay | With its scenic waterfront and historic charm, Oyster Bay attracts those seeking a quaint experience and recreational activities. | Oyster Bay Town Park, Theodore Roosevelt Memorial Park, Historic sites, Local shops, Outdoor activities |
| Seaford | Seaford combines suburban peace with proximity to water activities, appealing to tourists looking for a relaxing getaway. | Seaford Dock, Local parks, Nearby nature preserves, Restaurants, Marina access |
Understanding Airbnb License Requirements & STR Laws in Levittown (2025)
While Levittown, New York, United States currently shows low STR regulations, specific Airbnb license requirements might still exist or change. Always verify the latest short term rental regulations and Airbnb license requirements directly with local government authorities for Levittown to ensure full compliance before hosting.
(Source: AirROI data, 2025, finding no licensed listings among those analyzed)
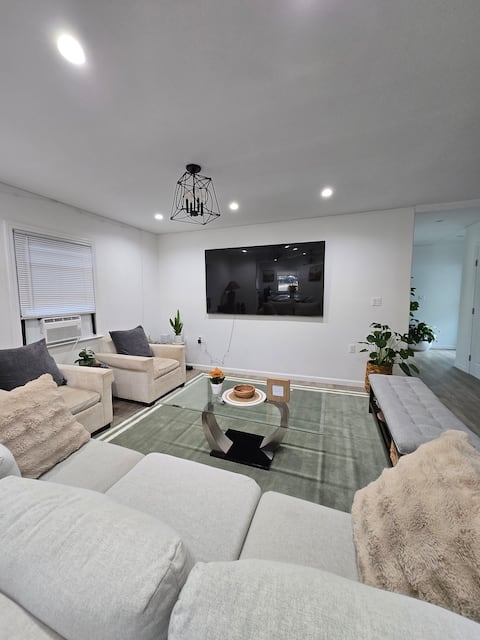
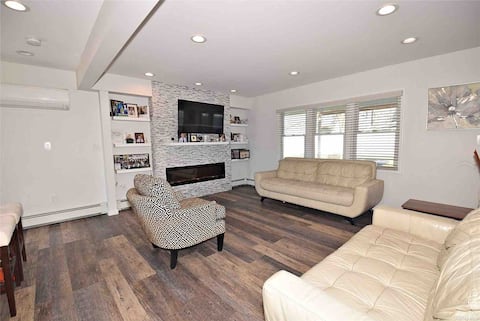
Top Performing Airbnb Properties in Levittown (2025)
Benchmark your potential! Explore examples of top-performing Airbnb properties in Levittownbased on Trailing Twelve Month (TTM) revenue. Analyze their characteristics, revenue, occupancy rate, and ADR to understand what drives success in this market.
Lendes Modern Retro House in Long Island
Entire Place • 3 bedrooms
Romance Vacation Sweet Home/Ryder Cup 8 min away
Entire Place • 3 bedrooms

Boho Basement Apartment with Private Entrance
Entire Place • 1 bedroom

Beautiful Private Studio on LI, easy access to NYC
Entire Place • N/A

Newly Redesigned Home close to NYC and all
Entire Place • 3 bedrooms

Confortable House
Entire Place • 1 bedroom
Note: Performance varies based on location, size, amenities, seasonality, and management quality. Data reflects the past 12 months.
Top Performing Airbnb Hosts in Levittown (2025)
Learn from the best! This table showcases top-performing Airbnb hosts in Levittown based on the number of properties managed and estimated total revenue over the past year. Analyze their scale and performance metrics.
| Host Name | Properties | Grossing Revenue | Stay Reviews | Avg Rating |
|---|---|---|---|---|
| Ngawang | 1 | $89,373 | 16 | 4.69/5.0 |
| Aleks | 2 | $66,375 | 195 | 4.93/5.0 |
| Heather | 1 | $52,481 | 27 | 4.85/5.0 |
| Christina | 1 | $41,740 | 102 | 4.98/5.0 |
| Bowen | 1 | $27,417 | 160 | 4.93/5.0 |
| Yvonne | 3 | $24,311 | 655 | 4.97/5.0 |
| Laura | 1 | $24,185 | 80 | 4.89/5.0 |
| Stephanie | 1 | $19,802 | 22 | 4.73/5.0 |
| Maria F | 1 | $17,649 | 66 | 4.98/5.0 |
| Tracy | 1 | $13,753 | 49 | 4.59/5.0 |
Analyzing the strategies of top hosts, such as their property selection, pricing, and guest communication, can offer valuable lessons for optimizing your own Airbnb operations in Levittown.
Dive Deeper: Advanced Levittown STR Market Data (2025)
Ready to unlock more insights? AirROI provides access to advanced metrics and comprehensive Airbnb data for Levittown. Explore detailed analytics beyond this report to refine your investment strategy, optimize pricing, and maximize your vacation rental profits.
Explore Advanced MetricsLevittown Short-Term Rental Market Composition (2025): Property & Room Types
Room Type Distribution
Property Type Distribution
Market Composition Insights for Levittown
- The Levittown Airbnb market composition is heavily skewed towards Private Room listings, which make up 52.4% of the 21 active rentals. This indicates strong guest preference for privacy and space.
- Looking at the property type distribution in Levittown, House properties are the most common (71.4%), reflecting the local real estate landscape.
- Houses represent a significant 71.4% portion, catering likely to families or larger groups.
Levittown Airbnb Room Capacity Analysis (2025): Bedroom Distribution
Distribution of Listings by Number of Bedrooms
Room Capacity Insights for Levittown
- The dominant room capacity in Levittown is 1 bedroom listings, making up 28.6% of the market. This suggests a strong demand for properties suitable for couples or solo travelers.
- Together, 1 bedroom and 3 bedrooms properties represent 42.9% of the active Airbnb listings in Levittown, indicating a high concentration in these sizes.
Levittown Vacation Rental Guest Capacity Trends (2025)
Distribution of Listings by Guest Capacity
Guest Capacity Insights for Levittown
- The most common guest capacity trend in Levittown vacation rentals is listings accommodating 2 guests (19%). This suggests the primary traveler segment is likely couples or solo travelers.
- Properties designed for 2 guests and 3 guests dominate the Levittown STR market, accounting for 28.5% of listings.
- On average, properties in Levittown are equipped to host 1.8 guests.
Levittown Airbnb Booking Patterns (2025): Available vs. Booked Days
Available Days Distribution
Booked Days Distribution
Booking Pattern Insights for Levittown
- The most common availability pattern in Levittown falls within the 271-366 days range, representing 38.1% of listings. This suggests many properties have significant open periods on their calendars.
- Approximately 71.4% of listings show high availability (181+ days open annually), indicating potential for increased bookings or specific owner usage patterns.
- For booked days, the 91-180 days range is most frequent in Levittown (33.3%), reflecting common guest stay durations or potential owner blocking patterns.
- A notable 28.6% of properties secure long booking periods (181+ days booked per year), highlighting successful long-term rental strategies or significant owner usage.
Levittown Airbnb Minimum Stay Requirements Analysis
Distribution of Listings by Minimum Night Requirement
1 Night
8 listings
38.1% of total
2 Nights
3 listings
14.3% of total
4-6 Nights
1 listings
4.8% of total
7-29 Nights
2 listings
9.5% of total
30+ Nights
7 listings
33.3% of total
Key Insights
- The most prevalent minimum stay requirement in Levittown is 1 Night, adopted by 38.1% of listings. This highlights the market's preference for shorter, flexible bookings.
- A significant segment (33.3%) caters to monthly stays (30+ nights) in Levittown, pointing to opportunities in the extended-stay market.
Recommendations
- Align with the market by considering a 1 Night minimum stay, as 38.1% of Levittown hosts use this setting.
- Explore offering discounts for stays of 30+ nights to attract the 33.3% of the market seeking extended stays.
- Adjust minimum nights based on seasonality – potentially shorter during low season and longer during peak demand periods in Levittown.
Levittown Airbnb Cancellation Policy Trends Analysis (2025)
Flexible
7 listings
35% of total
Moderate
7 listings
35% of total
Firm
2 listings
10% of total
Strict
4 listings
20% of total
Cancellation Policy Insights for Levittown
- The prevailing Airbnb cancellation policy trend in Levittown is Flexible, used by 35% of listings.
- There's a relatively balanced mix between guest-friendly (70.0%) and stricter (30.0%) policies, offering choices for different guest needs.
Recommendations for Hosts
- Consider adopting a Flexible policy to align with the 35% market standard in Levittown.
- Regularly review your cancellation policy against competitors and market demand shifts in Levittown.
Levittown STR Booking Lead Time Analysis (2025)
Average Booking Lead Time by Month
Booking Lead Time Insights for Levittown
- The overall average booking lead time for vacation rentals in Levittown is 49 days.
- Guests book furthest in advance for stays during September (average 103 days), likely coinciding with peak travel demand or local events.
- The shortest booking windows occur for stays in March (average 25 days), indicating more last-minute travel plans during this time.
- Seasonally, Fall (60 days avg.) sees the longest lead times, while Spring (34 days avg.) has the shortest, reflecting typical travel planning cycles.
Recommendations for Hosts
- Use the overall average lead time (49 days) as a baseline for your pricing and availability strategy in Levittown.
- For September stays, consider implementing length-of-stay discounts or slightly higher rates for bookings made less than 103 days out to capitalize on advance planning.
- Target marketing efforts for the Fall season well in advance (at least 60 days) to capture early planners.
- Monitor your own booking lead times against these Levittown averages to identify opportunities for dynamic pricing adjustments.
Popular & Essential Airbnb Amenities in Levittown (2025)
Amenity Prevalence
Amenity Insights for Levittown
- Essential amenities in Levittown that guests expect include: Heating, Wifi, Hot water, Hangers. Lacking these (any) could significantly impact bookings.
- Popular amenities like Smoke alarm, Air conditioning, TV are common but not universal. Offering these can provide a competitive edge.
Recommendations for Hosts
- Ensure your listing includes all essential amenities for Levittown: Heating, Wifi, Hot water, Hangers.
- Prioritize adding missing essentials: Hot water, Hangers.
- Consider adding popular differentiators like Smoke alarm or Air conditioning to increase appeal.
- Highlight unique or less common amenities you offer (e.g., hot tub, dedicated workspace, EV charger) in your listing description and photos.
- Regularly check competitor amenities in Levittown to stay competitive.
Levittown Airbnb Guest Demographics & Profile Analysis (2025)
Guest Profile Summary for Levittown
- The typical guest profile for Airbnb in Levittown consists of primarily domestic travelers (92%), often arriving from nearby New York, typically belonging to the Post-2000s (Gen Z/Alpha) group (50%), primarily speaking English or Spanish.
- Domestic travelers account for 92.2% of guests.
- Key international markets include United States (92.2%) and Canada (2.6%).
- Top languages spoken are English (60.6%) followed by Spanish (14.7%).
- A significant demographic segment is the Post-2000s (Gen Z/Alpha) group, representing 50% of guests.
Recommendations for Hosts
- Target domestic marketing efforts towards travelers from New York and Alexandria.
- Tailor amenities and listing descriptions to appeal to the dominant Post-2000s (Gen Z/Alpha) demographic (e.g., highlight fast WiFi, smart home features, local guides).
- Highlight unique local experiences or amenities relevant to the primary guest profile.
- Consider seasonal promotions aligned with peak travel times for key origin markets.
Nearby Short-Term Rental Market Comparison
How does the Levittown Airbnb market stack up against its neighbors? Compare key performance metrics like average monthly revenue, ADR, and occupancy rates in surrounding areas to understand the broader regional STR landscape.
| Market | Active Properties | Monthly Revenue | Daily Rate | Avg. Occupancy |
|---|---|---|---|---|
| Frankford Township | 12 | $5,803 | $571.00 | 44% |
| Spring Lake Heights | 17 | $5,495 | $699.58 | 41% |
| Town of East Hampton | 1,382 | $5,429 | $982.56 | 33% |
| Town of Kingston | 13 | $5,231 | $438.70 | 46% |
| Town of Southampton | 1,254 | $5,227 | $984.78 | 32% |
| Town of Pound Ridge | 18 | $5,204 | $574.35 | 44% |
| Monmouth Beach | 13 | $5,203 | $660.27 | 40% |
| Town of Pleasant Valley | 31 | $5,051 | $509.89 | 40% |
| Surf City | 44 | $5,032 | $731.22 | 42% |
| Town of Putnam Valley | 52 | $4,995 | $422.23 | 45% |