Queens Airbnb Market Analysis 2026: Short Term Rental Data & Vacation Rental Statistics in New York, United States
Is Airbnb profitable in Queens in 2026? Explore comprehensive Airbnb analytics for Queens, New York, United States to uncover income potential. This 2026 STR market report for Queens, based on AirROI data from February 2025 to January 2026, reveals key trends in the niche market of 85 active listings.
Whether you're considering an Airbnb investment in Queens, optimizing your existing vacation rental, or exploring rental arbitrage opportunities, understanding the Queens Airbnb data is crucial. Understanding the local regulations is key to maximizing your short term rental income potential. Let's dive into the specifics.
Key Queens Airbnb Performance Metrics Overview
Monthly Airbnb Revenue Variations & Income Potential in Queens (2026)
Understanding the monthly revenue variations for Airbnb listings in Queens is key to maximizing your short term rental income potential. Seasonality significantly impacts earnings. Our analysis, based on data from the past 12 months, shows that the peak revenue month for STRs in Queens is typically December, while May often presents the lowest earnings, highlighting opportunities for strategic pricing adjustments during shoulder and low seasons. Explore the typical Airbnb income in Queens across different performance tiers:
- Best-in-class properties (Top 10%) achieve $4,251+ monthly, often utilizing dynamic pricing and superior guest experiences.
- Strong performing properties (Top 25%) earn $2,405 or more, indicating effective management and desirable locations/amenities.
- Typical properties (Median) generate around $1,480 per month, representing the average market performance.
- Entry-level properties (Bottom 25%) see earnings around $786, often with potential for optimization.
Average Monthly Airbnb Earnings Trend in Queens
Queens Airbnb Occupancy Rate Trends (2026)
Maximize your bookings by understanding the Queens STR occupancy trends. Seasonal demand shifts significantly influence how often properties are booked. Typically, Junesees the highest demand (peak season occupancy), while May experiences the lowest (low season). Effective strategies, like adjusting minimum stays or offering promotions, can boost occupancy during slower periods. Here's how different property tiers perform in Queens:
- Best-in-class properties (Top 10%) achieve 78%+ occupancy, indicating high desirability and potentially optimized availability.
- Strong performing properties (Top 25%) maintain 65% or higher occupancy, suggesting good market fit and guest satisfaction.
- Typical properties (Median) have an occupancy rate around 47%.
- Entry-level properties (Bottom 25%) average 25% occupancy, potentially facing higher vacancy.
Average Monthly Occupancy Rate Trend in Queens
Average Daily Rate (ADR) Airbnb Trends in Queens (2026)
Effective short term rental pricing strategy in Queens involves understanding monthly ADR fluctuations. The Average Daily Rate (ADR) for Airbnb in Queens typically peaks in December and dips lowest during August. Leveraging Airbnb dynamic pricing tools or strategies based on this seasonality can significantly boost revenue. Here's a look at the typical nightly rates achieved:
- Best-in-class properties (Top 10%) command rates of $220+ per night, often due to premium features or locations.
- Strong performing properties (Top 25%) achieve nightly rates of $147 or more.
- Typical properties (Median) charge around $98 per night.
- Entry-level properties (Bottom 25%) earn around $64 per night.
Average Daily Rate (ADR) Trend by Month in Queens
Get Live Queens Market Intelligence 👇
Explore Real-time Analytics
Airbnb Seasonality Analysis & Trends in Queens (2026)
Peak Season (December, June, August)
- Revenue averages $2,542 per month
- Occupancy rates average 57.3%
- Daily rates average $122
Shoulder Season
- Revenue averages $1,614 per month
- Occupancy maintains around 40.1%
- Daily rates hold near $127
Low Season (February, March, April)
- Revenue drops to average $0 per month
- Occupancy decreases to average 0.0%
- Daily rates adjust to average $113
Seasonality Insights for Queens
- The Airbnb seasonality in Queens shows highly seasonal trends requiring careful strategy. While the sections above show seasonal averages, it's also insightful to look at the extremes:
- During the high season, the absolute peak month showcases Queens's highest earning potential, with monthly revenues capable of climbing to $2,994, occupancy reaching a high of 60.7%, and ADRs peaking at $144.
- Conversely, the slowest single month of the year, typically falling within the low season, marks the market's lowest point. In this month, revenue might dip to $0, occupancy could drop to 0.0%, and ADRs may adjust down to $108.
- Understanding both the seasonal averages and these monthly peaks and troughs in revenue, occupancy, and ADR is crucial for maximizing your Airbnb profit potential in Queens.
Seasonal Strategies for Maximizing Profit
- Peak Season: Maximize revenue through premium pricing and potentially longer minimum stays. Ensure high availability.
- Low Season: Offer competitive pricing, special promotions (e.g., extended stay discounts), and flexible cancellation policies. Target off-season travelers like remote workers or budget-conscious guests.
- Shoulder Seasons: Implement dynamic pricing that balances peak and low rates. Target weekend travelers or specific events. Offer slightly more flexible terms than peak season.
- Regularly analyze your own performance against these Queens seasonality benchmarks and adjust your pricing and availability strategy accordingly.
Best Areas for Airbnb Investment in Queens (2026)
Exploring the top neighborhoods for short-term rentals in Queens? This section highlights key areas, outlining why they are attractive for hosts and guests, along with notable local attractions. Consider these locations based on your target guest profile and investment strategy.
| Neighborhood / Area | Why Host Here? (Target Guests & Appeal) | Key Attractions & Landmarks |
|---|---|---|
| Astoria | Vibrant neighborhood known for its diverse culture, restaurants, and proximity to Manhattan. It's popular with tourists and young professionals, making it a lucrative area for Airbnb hosting. | Astoria Park, Museum of the Moving Image, Astoria's Food scene, Bohemian Hall and Beer Garden, Soccer Fields |
| Long Island City | An emerging neighborhood with stunning views of the Manhattan skyline, known for its trendy restaurants, galleries, and proximity to public transportation. Ideal for visitors looking for a unique stay near Manhattan. | Gantry Plaza State Park, MoMA PS1, Flecker's Land, Long Island City waterfront, Café D'Avignon |
| Jackson Heights | A culturally rich area known for its diverse community and cuisine. It's known for its affordability and accessibility, attracting tourists looking for an authentic neighborhood experience. | Jackson Heights Historic District, Diversity Plaza, Queens Museum, Queens Botanical Garden, Local markets |
| Flushing | Famous for its vibrant Chinese community and delicious food offerings. Flushing attracts both tourists and locals, making it a great place for Airbnb investment, especially for food lovers. | Flushing Meadows-Corona Park, Queens Museum, New York Hall of Science, Flushing Town Hall, Chinatown |
| Forest Hills | A suburban feel with upscale shops and restaurants, Forest Hills is appealing for families and those looking for a quieter stay close to the city, contributing to its popularity among Airbnb guests. | Forest Hills Gardens, West Side Tennis Club, Shopping on Austin Street, Cypress Hills Cemetery, Local parks |
| Ridgewood | A trendy area that has become increasingly popular among artists and young professionals. Known for its vibrant scene and affordability, it's a hidden gem for Airbnb hosting. | Ridgewood Reservoir, M train access to Manhattan, Local cafés and breweries, Vibrant street art, Historical architecture |
| Sunnyside | A charming neighborhood known for its community-oriented feel and accessibility to Manhattan. It's appealing for families and tourists looking for a quieter experience. | Sunnyside Gardens Park, Local pubs, Queens Boulevard, Greenmarket, Historic houses |
| Bayside | A suburban neighborhood that offers a quiet retreat from the city with beautiful parks and a waterfront. It's attractive to families and visitors looking for a slower pace while still being close to NYC. | Bayside Marina, Fort Totten Park, Local shops and restaurants, Bayside Historical Society, Parks and gardens |
Understanding Airbnb License Requirements & STR Laws in Queens (2026)
With 29% of listings showing registration in 2026, understanding potential Airbnb license requirements is crucial in Queens. Always verify the latest short term rental regulations and Airbnb license requirements directly with local government authorities for Queens to ensure full compliance before hosting.
(Source: AirROI data, 2026, based on 29% licensed listings)
Top Performing Airbnb Properties in Queens (2026)
Benchmark your potential! Explore examples of top-performing Airbnb properties in Queensbased on Trailing Twelve Month (TTM) revenue. Analyze their characteristics, revenue, occupancy rate, and ADR to understand what drives success in this market.
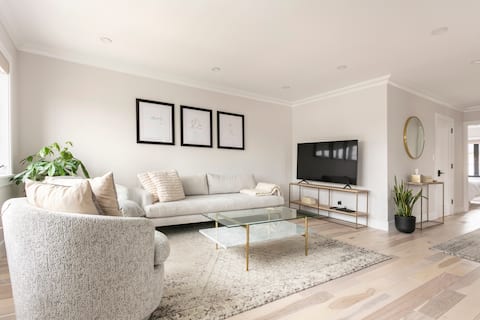
Duplex Smart Home 2 Bed 2 Bath
Entire Place • 2 bedrooms
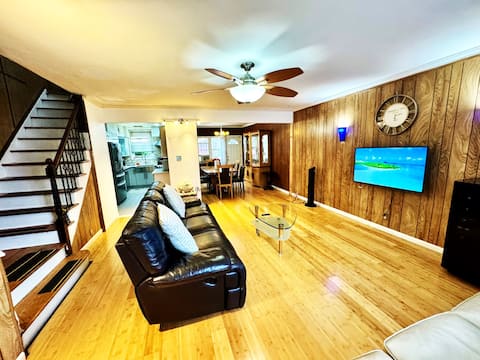
LGA 5 mins,3 Br Duplex Private House with Driveway
Entire Place • 3 bedrooms

Modern One bedroom with Private Yard
Entire Place • 1 bedroom
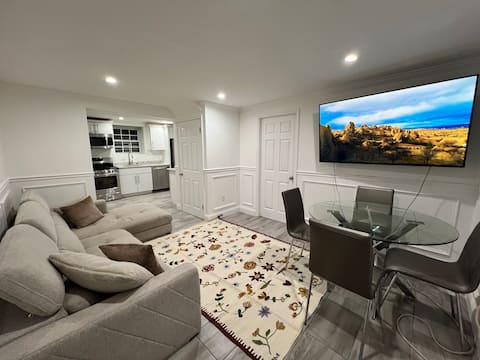
Cozy Home 1 Min from LGA
Entire Place • 1 bedroom

Beautiful Suite w Bathroom - Convenient to JFK
Entire Place • 2 bedrooms

Cozy & Spacious Master Suite - 15 Min to Manhattan
Private Room • N/A
Note: Performance varies based on location, size, amenities, seasonality, and management quality. Data reflects the past 12 months.
Top Performing Airbnb Hosts in Queens (2026)
Learn from the best! This table showcases top-performing Airbnb hosts in Queens based on the number of properties managed and estimated total revenue over the past year. Analyze their scale and performance metrics.
| Host Name | Properties | Grossing Revenue | Stay Reviews | Avg Rating |
|---|---|---|---|---|
| Stella | 5 | $63,683 | 146 | 4.43/5.0 |
| Farhan | 1 | $61,801 | 56 | 5.00/5.0 |
| Tusher | 1 | $51,633 | 17 | 4.59/5.0 |
| Samantha | 1 | $50,188 | 33 | 4.91/5.0 |
| Mohamed | 1 | $39,917 | 53 | 4.77/5.0 |
| Michelle | 2 | $37,747 | 40 | 4.61/5.0 |
| Kumar | 2 | $30,646 | 117 | 4.89/5.0 |
| Tracey | 2 | $29,774 | 96 | 4.87/5.0 |
| Dewey | 1 | $29,511 | 19 | 4.89/5.0 |
| Ngawang | 2 | $29,457 | 55 | 4.84/5.0 |
Analyzing the strategies of top hosts, such as their property selection, pricing, and guest communication, can offer valuable lessons for optimizing your own Airbnb operations in Queens.
Dive Deeper: Advanced Queens STR Market Data (2026)
Ready to unlock more insights? AirROI provides access to advanced metrics and comprehensive Airbnb data for Queens. Explore detailed analytics beyond this report to refine your investment strategy, optimize pricing, and maximize your vacation rental profits.
Explore Advanced MetricsQueens Short-Term Rental Market Composition (2026): Property & Room Types
Room Type Distribution
Property Type Distribution
Market Composition Insights for Queens
- The Queens Airbnb market composition is heavily skewed towards Private Room listings, which make up 56.5% of the 85 active rentals. This indicates strong guest preference for privacy and space.
- Looking at the property type distribution in Queens, House properties are the most common (63.5%), reflecting the local real estate landscape.
- Houses represent a significant 63.5% portion, catering likely to families or larger groups.
Queens Airbnb Room Capacity Analysis (2026): Bedroom Distribution
Distribution of Listings by Number of Bedrooms
Room Capacity Insights for Queens
- The dominant room capacity in Queens is 1 bedroom listings, making up 25.9% of the market. This suggests a strong demand for properties suitable for couples or solo travelers.
- Together, 1 bedroom and 2 bedrooms properties represent 34.1% of the active Airbnb listings in Queens, indicating a high concentration in these sizes.
- Listings with 3+ bedrooms (7.1%) represent a smaller niche, potentially indicating an underserved market for larger group accommodations in Queens.
Queens Vacation Rental Guest Capacity Trends (2026)
Distribution of Listings by Guest Capacity
Guest Capacity Insights for Queens
- The most common guest capacity trend in Queens vacation rentals is listings accommodating 2 guests (15.3%). This suggests the primary traveler segment is likely couples or solo travelers.
- Properties designed for 2 guests and 4 guests dominate the Queens STR market, accounting for 24.7% of listings.
- Listings for large groups (6+ guests) are relatively rare (3.6%), potentially indicating an opportunity for hosts targeting this segment in Queens.
- On average, properties in Queens are equipped to host 1.2 guests.
Queens Airbnb Booking Patterns (2026): Available vs. Booked Days
Available Days Distribution
Booked Days Distribution
Booking Pattern Insights for Queens
- The most common availability pattern in Queens falls within the 271-366 days range, representing 61.2% of listings. This suggests many properties have significant open periods on their calendars.
- Approximately 95.3% of listings show high availability (181+ days open annually), indicating potential for increased bookings or specific owner usage patterns.
- For booked days, the 31-90 days range is most frequent in Queens (47.1%), reflecting common guest stay durations or potential owner blocking patterns.
- A notable 4.7% of properties secure long booking periods (181+ days booked per year), highlighting successful long-term rental strategies or significant owner usage.
Queens Airbnb Minimum Stay Requirements Analysis
Distribution of Listings by Minimum Night Requirement
1 Night
22 listings
25.9% of total
2 Nights
2 listings
2.4% of total
3 Nights
1 listings
1.2% of total
7-29 Nights
4 listings
4.7% of total
30+ Nights
56 listings
65.9% of total
Key Insights
- The most prevalent minimum stay requirement in Queens is 30+ Nights, adopted by 65.9% of listings. This highlights the market's preference for longer commitments.
- A significant segment (65.9%) caters to monthly stays (30+ nights) in Queens, pointing to opportunities in the extended-stay market.
Recommendations
- Align with the market by considering a 30+ Nights minimum stay, as 65.9% of Queens hosts use this setting.
- If feasible, allowing 1-night stays, especially midweek or during low season, could capture last-minute bookings, as only 25.9% currently do.
- Explore offering discounts for stays of 30+ nights to attract the 65.9% of the market seeking extended stays.
- Adjust minimum nights based on seasonality – potentially shorter during low season and longer during peak demand periods in Queens.
Queens Airbnb Cancellation Policy Trends Analysis (2026)
Limited
2 listings
2.4% of total
Flexible
34 listings
40% of total
Moderate
19 listings
22.4% of total
Firm
24 listings
28.2% of total
Strict
6 listings
7.1% of total
Cancellation Policy Insights for Queens
- The prevailing Airbnb cancellation policy trend in Queens is Flexible, used by 40% of listings.
- There's a relatively balanced mix between guest-friendly (62.4%) and stricter (35.3%) policies, offering choices for different guest needs.
- Strict cancellation policies are quite rare (7.1%), potentially making listings with this policy less competitive unless justified by high demand or property type.
Recommendations for Hosts
- Consider adopting a Flexible policy to align with the 40% market standard in Queens.
- Using a Strict policy might deter some guests, as only 7.1% of listings use it. Evaluate if potential revenue protection outweighs possible lower booking rates.
- Regularly review your cancellation policy against competitors and market demand shifts in Queens.
Queens STR Booking Lead Time Analysis (2026)
Average Booking Lead Time by Month
Booking Lead Time Insights for Queens
- The overall average booking lead time for vacation rentals in Queens is 13 days.
- Guests book furthest in advance for stays during August (average 21 days), likely coinciding with peak travel demand or local events.
- The shortest booking windows occur for stays in April (average 0 days), indicating more last-minute travel plans during this time.
- Seasonally, Fall (19 days avg.) sees the longest lead times, while Spring (1 days avg.) has the shortest, reflecting typical travel planning cycles.
Recommendations for Hosts
- Use the overall average lead time (13 days) as a baseline for your pricing and availability strategy in Queens.
- During April, focus on last-minute booking availability and promotions, as guests book with very short notice (0 days avg.).
- Target marketing efforts for the Fall season well in advance (at least 19 days) to capture early planners.
- Monitor your own booking lead times against these Queens averages to identify opportunities for dynamic pricing adjustments.
Popular & Essential Airbnb Amenities in Queens (2026)
Amenity Prevalence
Amenity Insights for Queens
- Essential amenities in Queens that guests expect include: Wifi, Smoke alarm. Lacking these (any) could significantly impact bookings.
- Popular amenities like Air conditioning, Carbon monoxide alarm, Kitchen are common but not universal. Offering these can provide a competitive edge.
Recommendations for Hosts
- Ensure your listing includes all essential amenities for Queens: Wifi, Smoke alarm.
- Prioritize adding missing essentials: Smoke alarm.
- Consider adding popular differentiators like Air conditioning or Carbon monoxide alarm to increase appeal.
- Highlight unique or less common amenities you offer (e.g., hot tub, dedicated workspace, EV charger) in your listing description and photos.
- Regularly check competitor amenities in Queens to stay competitive.
Queens Airbnb Guest Demographics & Profile Analysis (2026)
Guest Profile Summary for Queens
- The typical guest profile for Airbnb in Queens consists of primarily domestic travelers (77%), often arriving from nearby New York, typically belonging to the Post-2000s (Gen Z/Alpha) group (50%), primarily speaking English or Spanish.
- Domestic travelers account for 77.3% of guests.
- Key international markets include United States (77.3%) and United Kingdom (3%).
- Top languages spoken are English (55.6%) followed by Spanish (13.2%).
- A significant demographic segment is the Post-2000s (Gen Z/Alpha) group, representing 50% of guests.
Recommendations for Hosts
- Target domestic marketing efforts towards travelers from New York and Boston.
- Tailor amenities and listing descriptions to appeal to the dominant Post-2000s (Gen Z/Alpha) demographic (e.g., highlight fast WiFi, smart home features, local guides).
- Highlight unique local experiences or amenities relevant to the primary guest profile.
- Consider seasonal promotions aligned with peak travel times for key origin markets.
Nearby Short-Term Rental Market Comparison
How does the Queens Airbnb market stack up against its neighbors? Compare key performance metrics like average monthly revenue, ADR, and occupancy rates in surrounding areas to understand the broader regional STR landscape.
| Market | Active Properties | Monthly Revenue | Daily Rate | Avg. Occupancy |
|---|---|---|---|---|
| Town of Kingston | 10 | $6,470 | $473.76 | 49% |
| Frankford Township | 11 | $6,329 | $505.19 | 41% |
| Sag Harbor | 15 | $6,129 | $1280.84 | 40% |
| Town of East Hampton | 1,327 | $5,945 | $986.02 | 36% |
| Spring Lake Heights | 16 | $5,785 | $725.20 | 40% |
| Town of Monroe | 22 | $5,690 | $720.52 | 37% |
| Town of Southampton | 1,201 | $5,620 | $1002.45 | 33% |
| Stone Harbor | 42 | $5,467 | $785.22 | 39% |
| Southampton | 19 | $5,405 | $1456.43 | 30% |
| Neptune City | 12 | $5,299 | $531.14 | 45% |