Town of Esopus Airbnb Market Analysis 2026: Short Term Rental Data & Vacation Rental Statistics in New York, United States
Is Airbnb profitable in Town of Esopus in 2026? Explore comprehensive Airbnb analytics for Town of Esopus, New York, United States to uncover income potential. This 2026 STR market report for Town of Esopus, based on AirROI data from February 2025 to January 2026, reveals key trends in the niche market of 59 active listings.
Whether you're considering an Airbnb investment in Town of Esopus, optimizing your existing vacation rental, or exploring rental arbitrage opportunities, understanding the Town of Esopus Airbnb data is crucial. Leveraging the low regulation environment is key to maximizing your short term rental income potential. Let's dive into the specifics.
Key Town of Esopus Airbnb Performance Metrics Overview
Monthly Airbnb Revenue Variations & Income Potential in Town of Esopus (2026)
Understanding the monthly revenue variations for Airbnb listings in Town of Esopus is key to maximizing your short term rental income potential. Seasonality significantly impacts earnings. Our analysis, based on data from the past 12 months, shows that the peak revenue month for STRs in Town of Esopus is typically July, while January often presents the lowest earnings, highlighting opportunities for strategic pricing adjustments during shoulder and low seasons. Explore the typical Airbnb income in Town of Esopus across different performance tiers:
- Best-in-class properties (Top 10%) achieve $10,330+ monthly, often utilizing dynamic pricing and superior guest experiences.
- Strong performing properties (Top 25%) earn $5,910 or more, indicating effective management and desirable locations/amenities.
- Typical properties (Median) generate around $3,325 per month, representing the average market performance.
- Entry-level properties (Bottom 25%) see earnings around $1,726, often with potential for optimization.
Average Monthly Airbnb Earnings Trend in Town of Esopus
Town of Esopus Airbnb Occupancy Rate Trends (2026)
Maximize your bookings by understanding the Town of Esopus STR occupancy trends. Seasonal demand shifts significantly influence how often properties are booked. Typically, Augustsees the highest demand (peak season occupancy), while January experiences the lowest (low season). Effective strategies, like adjusting minimum stays or offering promotions, can boost occupancy during slower periods. Here's how different property tiers perform in Town of Esopus:
- Best-in-class properties (Top 10%) achieve 78%+ occupancy, indicating high desirability and potentially optimized availability.
- Strong performing properties (Top 25%) maintain 59% or higher occupancy, suggesting good market fit and guest satisfaction.
- Typical properties (Median) have an occupancy rate around 39%.
- Entry-level properties (Bottom 25%) average 23% occupancy, potentially facing higher vacancy.
Average Monthly Occupancy Rate Trend in Town of Esopus
Average Daily Rate (ADR) Airbnb Trends in Town of Esopus (2026)
Effective short term rental pricing strategy in Town of Esopus involves understanding monthly ADR fluctuations. The Average Daily Rate (ADR) for Airbnb in Town of Esopus typically peaks in October and dips lowest during February. Leveraging Airbnb dynamic pricing tools or strategies based on this seasonality can significantly boost revenue. Here's a look at the typical nightly rates achieved:
- Best-in-class properties (Top 10%) command rates of $764+ per night, often due to premium features or locations.
- Strong performing properties (Top 25%) achieve nightly rates of $443 or more.
- Typical properties (Median) charge around $317 per night.
- Entry-level properties (Bottom 25%) earn around $175 per night.
Average Daily Rate (ADR) Trend by Month in Town of Esopus
Get Live Town of Esopus Market Intelligence 👇

Explore Real-time Analytics
Airbnb Seasonality Analysis & Trends in Town of Esopus (2026)
Peak Season (July, August, October)
- Revenue averages $7,697 per month
- Occupancy rates average 54.5%
- Daily rates average $460
Shoulder Season
- Revenue averages $5,040 per month
- Occupancy maintains around 40.3%
- Daily rates hold near $437
Low Season (January, February, March)
- Revenue drops to average $3,335 per month
- Occupancy decreases to average 34.2%
- Daily rates adjust to average $406
Seasonality Insights for Town of Esopus
- The Airbnb seasonality in Town of Esopus shows highly seasonal trends requiring careful strategy. While the sections above show seasonal averages, it's also insightful to look at the extremes:
- During the high season, the absolute peak month showcases Town of Esopus's highest earning potential, with monthly revenues capable of climbing to $8,871, occupancy reaching a high of 56.7%, and ADRs peaking at $470.
- Conversely, the slowest single month of the year, typically falling within the low season, marks the market's lowest point. In this month, revenue might dip to $2,904, occupancy could drop to 25.2%, and ADRs may adjust down to $396.
- Understanding both the seasonal averages and these monthly peaks and troughs in revenue, occupancy, and ADR is crucial for maximizing your Airbnb profit potential in Town of Esopus.
Seasonal Strategies for Maximizing Profit
- Peak Season: Maximize revenue through premium pricing and potentially longer minimum stays. Ensure high availability.
- Low Season: Offer competitive pricing, special promotions (e.g., extended stay discounts), and flexible cancellation policies. Target off-season travelers like remote workers or budget-conscious guests.
- Shoulder Seasons: Implement dynamic pricing that balances peak and low rates. Target weekend travelers or specific events. Offer slightly more flexible terms than peak season.
- Regularly analyze your own performance against these Town of Esopus seasonality benchmarks and adjust your pricing and availability strategy accordingly.
Best Areas for Airbnb Investment in Town of Esopus (2026)
Exploring the top neighborhoods for short-term rentals in Town of Esopus? This section highlights key areas, outlining why they are attractive for hosts and guests, along with notable local attractions. Consider these locations based on your target guest profile and investment strategy.
| Neighborhood / Area | Why Host Here? (Target Guests & Appeal) | Key Attractions & Landmarks |
|---|---|---|
| Marlboro | A charming village with stunning river views and access to outdoor activities such as hiking and boating. It's perfect for nature lovers looking for a peaceful getaway. | Marlboro Falls, Hudson River Waterfront, Wilderness Road Park, Marlboro Free Library, Locust Grove Estate |
| Highland | Known for its quaint downtown and proximity to both the Hudson River and the Walkway Over the Hudson, offering unique experiences for visitors looking to explore the area's history and natural beauty. | Walkway Over the Hudson, Hudson Valley Rail Trail, Highland Landing Park, Lighthouse Park, Tivoli Bays |
| Esopus Creek | Famous for its beautiful creeks and rivers, attracting fishing enthusiasts and nature lovers. It's ideal for travelers looking for tranquility and scenic views. | Esopus Creek, Robert Post Park, Woods Road Park, Shady Acres Campground, H1 Hydroponics |
| Saugerties | A historic town with vibrant arts scene, charming shops, and beautiful natural surroundings. Popular for weekend trips and artistic retreats. | Saugerties Lighthouse, Opus 40, Karma Triyana Dharmachakra, Saugerties Village Beach, Blue Mountain Bistro |
| Catskill | A picturesque town with stunning mountain views, outdoor recreational activities, and a thriving arts community. Attractive for both tourists and those escaping city life. | Catskill Park, Kaaterskill Falls, Olana State Historic Site, Catskill Animal Sanctuary, Thomas Cole National Historic Site |
| Rhinebeck | A historic village known for its charming streets and rich history, offering various festivals and local dining experiences. A hit among tourists seeking culture and community. | Ferncliff Forest, Rhinebeck Farmers' Market, Wilderstein Historic Site, The Rhinebeck Village Park, Bard College |
| New Paltz | A college town with a blend of local history and outdoor activities, attracting visitors seeking adventure as well as cultural experiences. | New Paltz Historic Huguenot Street, Mohonk Preserve, Minnewaska State Park, Gunk Mountain, Storm King Art Center |
| Lake Katrine | A peaceful area known for its scenic lake views and outdoor activities, perfect for families and nature enthusiasts looking for a relaxing retreat. | Katrine Lake, Lakeside Park, Rondout Creek, Bushkill Park, Ripley Grier Studios |
Understanding Airbnb License Requirements & STR Laws in Town of Esopus (2026)
While Town of Esopus, New York, United States currently shows low STR regulations, specific Airbnb license requirements might still exist or change. Always verify the latest short term rental regulations and Airbnb license requirements directly with local government authorities for Town of Esopus to ensure full compliance before hosting.
(Source: AirROI data, 2026, finding no licensed listings among those analyzed)
Top Performing Airbnb Properties in Town of Esopus (2026)
Benchmark your potential! Explore examples of top-performing Airbnb properties in Town of Esopusbased on Trailing Twelve Month (TTM) revenue. Analyze their characteristics, revenue, occupancy rate, and ADR to understand what drives success in this market.

Private 37 Acre Lake Estate on 164 Acres - 11 BR
Entire Place • 14 bedrooms
Nestled in Hudson River nature park near Kingston
Entire Place • 2 bedrooms
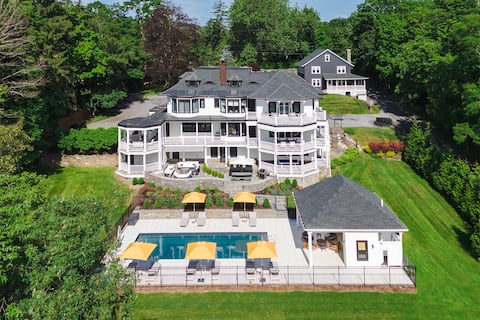
Bright & Spacious Hudson Valley Home with Pool
Entire Place • 6 bedrooms
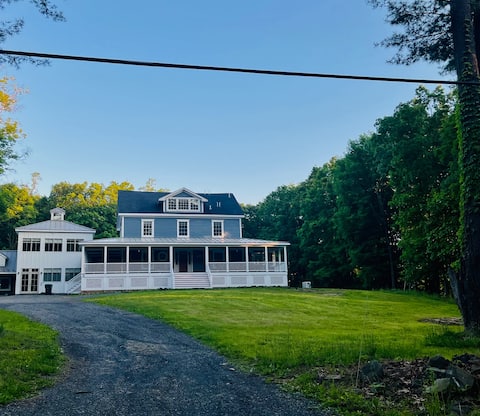
Jewel House NEW Oversized Country, Quiet Retreat
Entire Place • 9 bedrooms

Hudson Waterfront Mid-Century Modern Home
Entire Place • 3 bedrooms

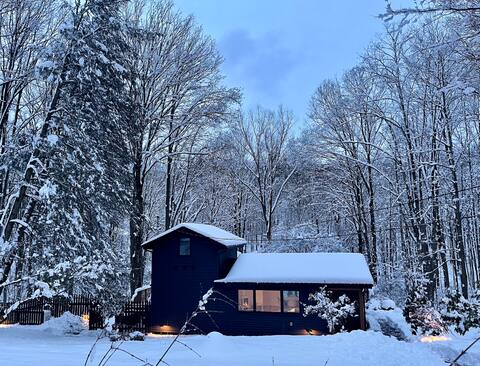
Maple Ridge Modern Rustic Retreat
Entire Place • 5 bedrooms
Note: Performance varies based on location, size, amenities, seasonality, and management quality. Data reflects the past 12 months.
Top Performing Airbnb Hosts in Town of Esopus (2026)
Learn from the best! This table showcases top-performing Airbnb hosts in Town of Esopus based on the number of properties managed and estimated total revenue over the past year. Analyze their scale and performance metrics.
| Host Name | Properties | Grossing Revenue | Stay Reviews | Avg Rating |
|---|---|---|---|---|
| Glasco Properties | 1 | $559,087 | 28 | 4.96/5.0 |
| Stephen Jay | 3 | $211,742 | 73 | 4.85/5.0 |
| Toby | 1 | $132,239 | 70 | 5.00/5.0 |
| Jillian | 1 | $128,894 | 7 | 5.00/5.0 |
| Home Sweet Hudson | 2 | $117,060 | 45 | 4.82/5.0 |
| Abigail | 1 | $112,091 | 59 | 4.95/5.0 |
| Steve | 1 | $107,823 | 55 | 4.96/5.0 |
| Angela | 2 | $97,824 | 79 | 4.93/5.0 |
| Rafi | 1 | $93,806 | 25 | 4.96/5.0 |
| Marilu | 1 | $87,803 | 33 | 5.00/5.0 |
Analyzing the strategies of top hosts, such as their property selection, pricing, and guest communication, can offer valuable lessons for optimizing your own Airbnb operations in Town of Esopus.
Dive Deeper: Advanced Town of Esopus STR Market Data (2026)
Ready to unlock more insights? AirROI provides access to advanced metrics and comprehensive Airbnb data for Town of Esopus. Explore detailed analytics beyond this report to refine your investment strategy, optimize pricing, and maximize your vacation rental profits.
Explore Advanced MetricsTown of Esopus Short-Term Rental Market Composition (2026): Property & Room Types
Room Type Distribution
Property Type Distribution
Market Composition Insights for Town of Esopus
- The Town of Esopus Airbnb market composition is heavily skewed towards Entire Home/Apt listings, which make up 98.3% of the 59 active rentals. This indicates strong guest preference for privacy and space.
- Looking at the property type distribution in Town of Esopus, House properties are the most common (76.3%), reflecting the local real estate landscape.
- Houses represent a significant 76.3% portion, catering likely to families or larger groups.
- The presence of 5.1% Hotel/Boutique listings indicates integration with traditional hospitality.
Town of Esopus Airbnb Room Capacity Analysis (2026): Bedroom Distribution
Distribution of Listings by Number of Bedrooms
Room Capacity Insights for Town of Esopus
- The dominant room capacity in Town of Esopus is 1 bedroom listings, making up 28.8% of the market. This suggests a strong demand for properties suitable for couples or solo travelers.
- Together, 1 bedroom and 3 bedrooms properties represent 50.8% of the active Airbnb listings in Town of Esopus, indicating a high concentration in these sizes.
- A significant 50.8% of listings offer 3+ bedrooms, catering to larger groups and families seeking more space in Town of Esopus.
Town of Esopus Vacation Rental Guest Capacity Trends (2026)
Distribution of Listings by Guest Capacity
Guest Capacity Insights for Town of Esopus
- The most common guest capacity trend in Town of Esopus vacation rentals is listings accommodating 8+ guests (33.9%). This suggests the primary traveler segment is likely larger groups.
- Properties designed for 8+ guests and 4 guests dominate the Town of Esopus STR market, accounting for 54.2% of listings.
- 49.2% of properties accommodate 6+ guests, serving the market segment for larger families or group travel in Town of Esopus.
- On average, properties in Town of Esopus are equipped to host 5.3 guests.
Town of Esopus Airbnb Booking Patterns (2026): Available vs. Booked Days
Available Days Distribution
Booked Days Distribution
Booking Pattern Insights for Town of Esopus
- The most common availability pattern in Town of Esopus falls within the 271-366 days range, representing 40.7% of listings. This suggests many properties have significant open periods on their calendars.
- Approximately 74.6% of listings show high availability (181+ days open annually), indicating potential for increased bookings or specific owner usage patterns.
- For booked days, the 91-180 days range is most frequent in Town of Esopus (37.3%), reflecting common guest stay durations or potential owner blocking patterns.
- A notable 25.4% of properties secure long booking periods (181+ days booked per year), highlighting successful long-term rental strategies or significant owner usage.
Town of Esopus Airbnb Minimum Stay Requirements Analysis
Distribution of Listings by Minimum Night Requirement
1 Night
9 listings
15.3% of total
2 Nights
29 listings
49.2% of total
3 Nights
1 listings
1.7% of total
4-6 Nights
2 listings
3.4% of total
30+ Nights
18 listings
30.5% of total
Key Insights
- The most prevalent minimum stay requirement in Town of Esopus is 2 Nights, adopted by 49.2% of listings. This highlights the market's preference for shorter, flexible bookings.
- A strong majority (64.5%) of the Town of Esopus Airbnb data shows acceptance of very short stays (1-2 nights), indicating a dynamic, high-turnover market.
- A significant segment (30.5%) caters to monthly stays (30+ nights) in Town of Esopus, pointing to opportunities in the extended-stay market.
Recommendations
- Align with the market by considering a 2 Nights minimum stay, as 49.2% of Town of Esopus hosts use this setting.
- If feasible, allowing 1-night stays, especially midweek or during low season, could capture last-minute bookings, as only 15.3% currently do.
- A 2-night minimum appears standard (49.2%). Consider this for weekends or peak periods.
- Explore offering discounts for stays of 30+ nights to attract the 30.5% of the market seeking extended stays.
- Adjust minimum nights based on seasonality – potentially shorter during low season and longer during peak demand periods in Town of Esopus.
Town of Esopus Airbnb Cancellation Policy Trends Analysis (2026)
Limited
3 listings
5.1% of total
Flexible
9 listings
15.3% of total
Moderate
21 listings
35.6% of total
Firm
20 listings
33.9% of total
Strict
6 listings
10.2% of total
Cancellation Policy Insights for Town of Esopus
- The prevailing Airbnb cancellation policy trend in Town of Esopus is Moderate, used by 35.6% of listings.
- There's a relatively balanced mix between guest-friendly (50.9%) and stricter (44.1%) policies, offering choices for different guest needs.
Recommendations for Hosts
- Consider adopting a Moderate policy to align with the 35.6% market standard in Town of Esopus.
- Using a Strict policy might deter some guests, as only 10.2% of listings use it. Evaluate if potential revenue protection outweighs possible lower booking rates.
- Regularly review your cancellation policy against competitors and market demand shifts in Town of Esopus.
Town of Esopus STR Booking Lead Time Analysis (2026)
Average Booking Lead Time by Month
Booking Lead Time Insights for Town of Esopus
- The overall average booking lead time for vacation rentals in Town of Esopus is 57 days.
- Guests book furthest in advance for stays during October (average 99 days), likely coinciding with peak travel demand or local events.
- The shortest booking windows occur for stays in January (average 22 days), indicating more last-minute travel plans during this time.
- Seasonally, Fall (63 days avg.) sees the longest lead times, while Winter (29 days avg.) has the shortest, reflecting typical travel planning cycles.
Recommendations for Hosts
- Use the overall average lead time (57 days) as a baseline for your pricing and availability strategy in Town of Esopus.
- For October stays, consider implementing length-of-stay discounts or slightly higher rates for bookings made less than 99 days out to capitalize on advance planning.
- Target marketing efforts for the Fall season well in advance (at least 63 days) to capture early planners.
- Monitor your own booking lead times against these Town of Esopus averages to identify opportunities for dynamic pricing adjustments.
Popular & Essential Airbnb Amenities in Town of Esopus (2026)
Amenity Prevalence
Amenity Insights for Town of Esopus
- Essential amenities in Town of Esopus that guests expect include: Free parking on premises, Wifi, Smoke alarm, Fire extinguisher, Coffee maker, Heating, Kitchen. Lacking these (any) could significantly impact bookings.
- Popular amenities like Bed linens, Dishes and silverware, Cooking basics are common but not universal. Offering these can provide a competitive edge.
Recommendations for Hosts
- Ensure your listing includes all essential amenities for Town of Esopus: Free parking on premises, Wifi, Smoke alarm, Fire extinguisher, Coffee maker, Heating, Kitchen.
- Prioritize adding missing essentials: Wifi, Smoke alarm, Fire extinguisher, Coffee maker, Heating, Kitchen.
- Consider adding popular differentiators like Bed linens or Dishes and silverware to increase appeal.
- Highlight unique or less common amenities you offer (e.g., hot tub, dedicated workspace, EV charger) in your listing description and photos.
- Regularly check competitor amenities in Town of Esopus to stay competitive.
Town of Esopus Airbnb Guest Demographics & Profile Analysis (2026)
Guest Profile Summary for Town of Esopus
- The typical guest profile for Airbnb in Town of Esopus consists of primarily domestic travelers (96%), often arriving from nearby New York, typically belonging to the Post-2000s (Gen Z/Alpha) group (50%), primarily speaking English or Spanish.
- Domestic travelers account for 96.2% of guests.
- Key international markets include United States (96.2%) and DC (0.5%).
- Top languages spoken are English (60%) followed by Spanish (10.8%).
- A significant demographic segment is the Post-2000s (Gen Z/Alpha) group, representing 50% of guests.
Recommendations for Hosts
- Target domestic marketing efforts towards travelers from New York and Philadelphia.
- Tailor amenities and listing descriptions to appeal to the dominant Post-2000s (Gen Z/Alpha) demographic (e.g., highlight fast WiFi, smart home features, local guides).
- Highlight unique local experiences or amenities relevant to the primary guest profile.
- Consider seasonal promotions aligned with peak travel times for key origin markets.
Nearby Short-Term Rental Market Comparison
How does the Town of Esopus Airbnb market stack up against its neighbors? Compare key performance metrics like average monthly revenue, ADR, and occupancy rates in surrounding areas to understand the broader regional STR landscape.
| Market | Active Properties | Monthly Revenue | Daily Rate | Avg. Occupancy |
|---|---|---|---|---|
| Town of Kingston | 10 | $6,470 | $473.76 | 49% |
| Frankford Township | 11 | $6,329 | $505.19 | 41% |
| Sag Harbor | 15 | $6,129 | $1280.84 | 40% |
| Town of East Hampton | 1,327 | $5,945 | $986.02 | 36% |
| Spring Lake Heights | 16 | $5,785 | $725.20 | 40% |
| Town of Monroe | 22 | $5,690 | $720.52 | 37% |
| Town of Southampton | 1,201 | $5,620 | $1002.45 | 33% |
| Town of Ancram | 22 | $5,616 | $512.55 | 38% |
| Southampton | 19 | $5,405 | $1456.43 | 30% |
| Neptune City | 12 | $5,299 | $531.14 | 45% |