Town of Greenburgh Airbnb Market Analysis 2026: Short Term Rental Data & Vacation Rental Statistics in New York, United States
Is Airbnb profitable in Town of Greenburgh in 2026? Explore comprehensive Airbnb analytics for Town of Greenburgh, New York, United States to uncover income potential. This 2026 STR market report for Town of Greenburgh, based on AirROI data from February 2025 to January 2026, reveals key trends in the niche market of 20 active listings.
Whether you're considering an Airbnb investment in Town of Greenburgh, optimizing your existing vacation rental, or exploring rental arbitrage opportunities, understanding the Town of Greenburgh Airbnb data is crucial. Leveraging the low regulation environment is key to maximizing your short term rental income potential. Let's dive into the specifics.
Key Town of Greenburgh Airbnb Performance Metrics Overview
Monthly Airbnb Revenue Variations & Income Potential in Town of Greenburgh (2026)
Understanding the monthly revenue variations for Airbnb listings in Town of Greenburgh is key to maximizing your short term rental income potential. Seasonality significantly impacts earnings. Our analysis, based on data from the past 12 months, shows that the peak revenue month for STRs in Town of Greenburgh is typically July, while January often presents the lowest earnings, highlighting opportunities for strategic pricing adjustments during shoulder and low seasons. Explore the typical Airbnb income in Town of Greenburgh across different performance tiers:
- Best-in-class properties (Top 10%) achieve $6,703+ monthly, often utilizing dynamic pricing and superior guest experiences.
- Strong performing properties (Top 25%) earn $2,929 or more, indicating effective management and desirable locations/amenities.
- Typical properties (Median) generate around $1,718 per month, representing the average market performance.
- Entry-level properties (Bottom 25%) see earnings around $990, often with potential for optimization.
Average Monthly Airbnb Earnings Trend in Town of Greenburgh
Town of Greenburgh Airbnb Occupancy Rate Trends (2026)
Maximize your bookings by understanding the Town of Greenburgh STR occupancy trends. Seasonal demand shifts significantly influence how often properties are booked. Typically, Julysees the highest demand (peak season occupancy), while January experiences the lowest (low season). Effective strategies, like adjusting minimum stays or offering promotions, can boost occupancy during slower periods. Here's how different property tiers perform in Town of Greenburgh:
- Best-in-class properties (Top 10%) achieve 78%+ occupancy, indicating high desirability and potentially optimized availability.
- Strong performing properties (Top 25%) maintain 66% or higher occupancy, suggesting good market fit and guest satisfaction.
- Typical properties (Median) have an occupancy rate around 48%.
- Entry-level properties (Bottom 25%) average 29% occupancy, potentially facing higher vacancy.
Average Monthly Occupancy Rate Trend in Town of Greenburgh
Average Daily Rate (ADR) Airbnb Trends in Town of Greenburgh (2026)
Effective short term rental pricing strategy in Town of Greenburgh involves understanding monthly ADR fluctuations. The Average Daily Rate (ADR) for Airbnb in Town of Greenburgh typically peaks in July and dips lowest during February. Leveraging Airbnb dynamic pricing tools or strategies based on this seasonality can significantly boost revenue. Here's a look at the typical nightly rates achieved:
- Best-in-class properties (Top 10%) command rates of $368+ per night, often due to premium features or locations.
- Strong performing properties (Top 25%) achieve nightly rates of $200 or more.
- Typical properties (Median) charge around $118 per night.
- Entry-level properties (Bottom 25%) earn around $76 per night.
Average Daily Rate (ADR) Trend by Month in Town of Greenburgh
Get Live Town of Greenburgh Market Intelligence 👇

Explore Real-time Analytics
Airbnb Seasonality Analysis & Trends in Town of Greenburgh (2026)
Peak Season (July, August, December)
- Revenue averages $3,523 per month
- Occupancy rates average 56.5%
- Daily rates average $198
Shoulder Season
- Revenue averages $2,653 per month
- Occupancy maintains around 50.3%
- Daily rates hold near $192
Low Season (January, April, November)
- Revenue drops to average $1,880 per month
- Occupancy decreases to average 36.5%
- Daily rates adjust to average $190
Seasonality Insights for Town of Greenburgh
- The Airbnb seasonality in Town of Greenburgh shows highly seasonal trends requiring careful strategy. While the sections above show seasonal averages, it's also insightful to look at the extremes:
- During the high season, the absolute peak month showcases Town of Greenburgh's highest earning potential, with monthly revenues capable of climbing to $4,054, occupancy reaching a high of 60.7%, and ADRs peaking at $201.
- Conversely, the slowest single month of the year, typically falling within the low season, marks the market's lowest point. In this month, revenue might dip to $1,500, occupancy could drop to 21.7%, and ADRs may adjust down to $182.
- Understanding both the seasonal averages and these monthly peaks and troughs in revenue, occupancy, and ADR is crucial for maximizing your Airbnb profit potential in Town of Greenburgh.
Seasonal Strategies for Maximizing Profit
- Peak Season: Maximize revenue through premium pricing and potentially longer minimum stays. Ensure high availability.
- Low Season: Offer competitive pricing, special promotions (e.g., extended stay discounts), and flexible cancellation policies. Target off-season travelers like remote workers or budget-conscious guests.
- Shoulder Seasons: Implement dynamic pricing that balances peak and low rates. Target weekend travelers or specific events. Offer slightly more flexible terms than peak season.
- Regularly analyze your own performance against these Town of Greenburgh seasonality benchmarks and adjust your pricing and availability strategy accordingly.
Best Areas for Airbnb Investment in Town of Greenburgh (2026)
Exploring the top neighborhoods for short-term rentals in Town of Greenburgh? This section highlights key areas, outlining why they are attractive for hosts and guests, along with notable local attractions. Consider these locations based on your target guest profile and investment strategy.
| Neighborhood / Area | Why Host Here? (Target Guests & Appeal) | Key Attractions & Landmarks |
|---|---|---|
| Hartsdale | A quaint suburban village with a strong community feel, ideal for families and those seeking a peaceful stay. It offers easy access to New York City via Metro-North, making it appealing for business travelers as well. | Hartsdale Pet Cemetery, Greenburgh Nature Center, Westchester Mall, Scarsdale Village, Edgemont |
| Elmsford | Located near major highways, Elmsford is a vibrant community that offers a mix of retail and dining. Close to attractions such as the Westchester Broadway Theatre, it is favored by visitors seeking entertainment. | The Westchester Broadway Theatre, Legoland Discovery Center, Aqueduct Park, Recreation Park, Elmsford Village Park |
| Dobbs Ferry | A picturesque riverside village with historic charm and beautiful views of the Hudson River, Dobbs Ferry attracts those looking for a scenic retreat while still being within commuting distance to New York City. | Hudson River MetroNorth train, Dobbs Ferry Waterfront, The Old Croton Aqueduct, Iona Island, Woodsom Point |
| White Plains | The bustling city of White Plains serves as a commercial hub with a vibrant downtown area filled with shopping, dining, and entertainment options. It's ideal for those looking to cater to business travelers as well as tourists. | The Westchester Mall, White Plains Performing Arts Center, Kensico Dam Plaza, The White Plains Farmers Market, Greenburgh Public Library |
| Tarrytown | A charming village known for its historic architecture and proximity to Sleepy Hollow. Tarrytown is a popular destination for visitors interested in the history and scenic views of the Hudson Valley. | Kykuit (the Rockefeller Estate), Lyndhurst Mansion, Sleepy Hollow Cemetery, Tarrytown Lighthouse, Peebles Island |
| Irvington | A small village with a rich history and beautiful riverfront locations. It appeals to guests looking for a quiet getaway close to nature while being conveniently located to New York City. | Irvington Town Hall Theater, The Old Croton Aqueduct, Irvington Nature Preserve, Matthiessen Park, Flutterby's on Hudson |
| Scarsdale | An affluent suburban community known for its top-rated schools and beautiful homes. Scarsdale offers an upscale experience for families and guests looking for luxury accommodations near New York City. | Scarsdale Golf Club, Coyote Flaco Mexican Grill, Scarsdale Village, Greenburgh Nature Center, Old Scarsdale |
| Ardsley | A charming and tight-knit community with parks and a serene environment. Ardsley is attractive for guests seeking a peaceful retreat while still being close to urban amenities. | Ardsley Village Hall, Rockwood Park, Ardsley High School, Ardsley Park, The Bronx River Parkway |
Understanding Airbnb License Requirements & STR Laws in Town of Greenburgh (2026)
While Town of Greenburgh, New York, United States currently shows low STR regulations, specific Airbnb license requirements might still exist or change. Always verify the latest short term rental regulations and Airbnb license requirements directly with local government authorities for Town of Greenburgh to ensure full compliance before hosting.
(Source: AirROI data, 2026, finding no licensed listings among those analyzed)
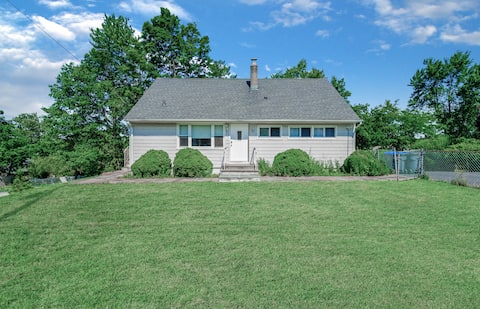
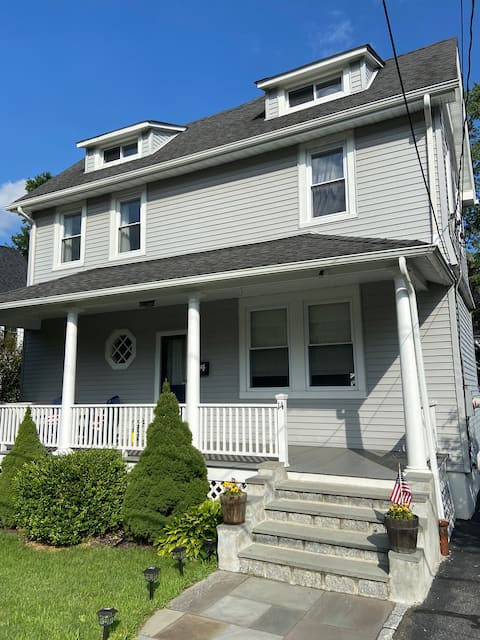
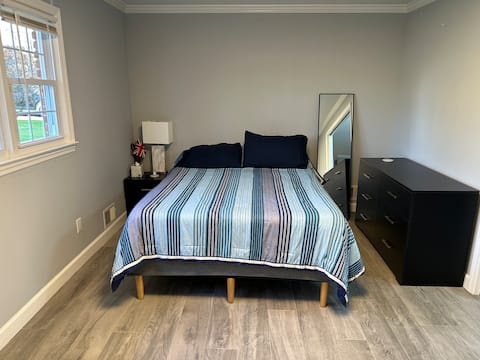
Top Performing Airbnb Properties in Town of Greenburgh (2026)
Benchmark your potential! Explore examples of top-performing Airbnb properties in Town of Greenburghbased on Trailing Twelve Month (TTM) revenue. Analyze their characteristics, revenue, occupancy rate, and ADR to understand what drives success in this market.

Lovely Tarrytown Home in Hudson
Entire Place • 3 bedrooms
Entire house in a beautiful quiet neighborhood
Entire Place • 4 bedrooms

Beautiful Home In Elmsford, NY
Entire Place • 6 bedrooms
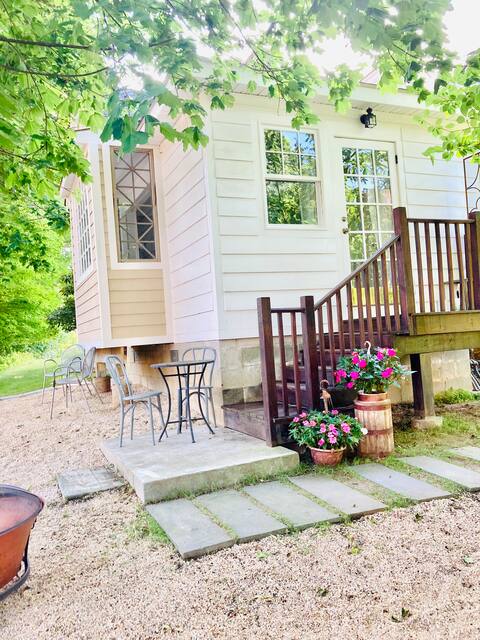
Garden Duplex Apt with Personal Outdoor Space
Entire Place • 2 bedrooms
Haven in Hartsdale! Private guest suite & bathroom
Entire Place • 1 bedroom
Private Room in a Scenic NYC Suburb
Private Room • N/A
Note: Performance varies based on location, size, amenities, seasonality, and management quality. Data reflects the past 12 months.
Top Performing Airbnb Hosts in Town of Greenburgh (2026)
Learn from the best! This table showcases top-performing Airbnb hosts in Town of Greenburgh based on the number of properties managed and estimated total revenue over the past year. Analyze their scale and performance metrics.
| Host Name | Properties | Grossing Revenue | Stay Reviews | Avg Rating |
|---|---|---|---|---|
| Elinisa | 1 | $93,549 | 66 | 4.80/5.0 |
| Koby | 1 | $77,658 | 33 | 4.76/5.0 |
| Najea | 1 | $68,755 | 7 | 4.71/5.0 |
| Daren | 3 | $40,156 | 429 | 4.82/5.0 |
| Vasilika | 1 | $35,813 | 64 | 4.95/5.0 |
| Manni | 2 | $31,109 | 249 | 4.88/5.0 |
| Carly | 1 | $28,147 | 158 | 4.89/5.0 |
| Rakesh | 1 | $27,396 | 31 | 5.00/5.0 |
| Nikhil | 1 | $21,287 | 73 | 4.93/5.0 |
| Eva | 4 | $19,253 | 152 | 4.76/5.0 |
Analyzing the strategies of top hosts, such as their property selection, pricing, and guest communication, can offer valuable lessons for optimizing your own Airbnb operations in Town of Greenburgh.
Dive Deeper: Advanced Town of Greenburgh STR Market Data (2026)
Ready to unlock more insights? AirROI provides access to advanced metrics and comprehensive Airbnb data for Town of Greenburgh. Explore detailed analytics beyond this report to refine your investment strategy, optimize pricing, and maximize your vacation rental profits.
Explore Advanced MetricsTown of Greenburgh Short-Term Rental Market Composition (2026): Property & Room Types
Room Type Distribution
Property Type Distribution
Market Composition Insights for Town of Greenburgh
- The Town of Greenburgh Airbnb market composition is heavily skewed towards Private Room listings, which make up 65% of the 20 active rentals. This indicates strong guest preference for privacy and space.
- Looking at the property type distribution in Town of Greenburgh, House properties are the most common (85%), reflecting the local real estate landscape.
- Houses represent a significant 85% portion, catering likely to families or larger groups.
Town of Greenburgh Airbnb Room Capacity Analysis (2026): Bedroom Distribution
Distribution of Listings by Number of Bedrooms
Room Capacity Insights for Town of Greenburgh
- The dominant room capacity in Town of Greenburgh is 1 bedroom listings, making up 15% of the market. This suggests a strong demand for properties suitable for couples or solo travelers.
- Together, 1 bedroom and 5+ bedrooms properties represent 25.0% of the active Airbnb listings in Town of Greenburgh, indicating a high concentration in these sizes.
Town of Greenburgh Vacation Rental Guest Capacity Trends (2026)
Distribution of Listings by Guest Capacity
Guest Capacity Insights for Town of Greenburgh
- The most common guest capacity trend in Town of Greenburgh vacation rentals is listings accommodating 8+ guests (15%). This suggests the primary traveler segment is likely larger groups.
- Properties designed for 8+ guests and 2 guests dominate the Town of Greenburgh STR market, accounting for 25.0% of listings.
- 20.0% of properties accommodate 6+ guests, serving the market segment for larger families or group travel in Town of Greenburgh.
- On average, properties in Town of Greenburgh are equipped to host 2.1 guests.
Town of Greenburgh Airbnb Booking Patterns (2026): Available vs. Booked Days
Available Days Distribution
Booked Days Distribution
Booking Pattern Insights for Town of Greenburgh
- The most common availability pattern in Town of Greenburgh falls within the 181-270 days range, representing 35% of listings. This suggests many properties have significant open periods on their calendars.
- Approximately 65.0% of listings show high availability (181+ days open annually), indicating potential for increased bookings or specific owner usage patterns.
- For booked days, the 91-180 days range is most frequent in Town of Greenburgh (40%), reflecting common guest stay durations or potential owner blocking patterns.
- A notable 35.0% of properties secure long booking periods (181+ days booked per year), highlighting successful long-term rental strategies or significant owner usage.
Town of Greenburgh Airbnb Minimum Stay Requirements Analysis
Distribution of Listings by Minimum Night Requirement
1 Night
7 listings
35% of total
2 Nights
3 listings
15% of total
7-29 Nights
6 listings
30% of total
30+ Nights
4 listings
20% of total
Key Insights
- The most prevalent minimum stay requirement in Town of Greenburgh is 1 Night, adopted by 35% of listings. This highlights the market's preference for shorter, flexible bookings.
- A significant segment (20%) caters to monthly stays (30+ nights) in Town of Greenburgh, pointing to opportunities in the extended-stay market.
Recommendations
- Align with the market by considering a 1 Night minimum stay, as 35% of Town of Greenburgh hosts use this setting.
- Explore offering discounts for stays of 30+ nights to attract the 20% of the market seeking extended stays.
- Adjust minimum nights based on seasonality – potentially shorter during low season and longer during peak demand periods in Town of Greenburgh.
Town of Greenburgh Airbnb Cancellation Policy Trends Analysis (2026)
Flexible
1 listings
5% of total
Moderate
6 listings
30% of total
Firm
5 listings
25% of total
Strict
8 listings
40% of total
Cancellation Policy Insights for Town of Greenburgh
- The prevailing Airbnb cancellation policy trend in Town of Greenburgh is Strict, used by 40% of listings.
- A majority (65.0%) of hosts in Town of Greenburgh utilize Firm or Strict policies, indicating a market where hosts prioritize booking security.
Recommendations for Hosts
- Consider adopting a Strict policy to align with the 40% market standard in Town of Greenburgh.
- With 40% using Strict terms, this is a viable option in Town of Greenburgh, particularly for high-value properties or during peak demand periods.
- Regularly review your cancellation policy against competitors and market demand shifts in Town of Greenburgh.
Town of Greenburgh STR Booking Lead Time Analysis (2026)
Average Booking Lead Time by Month
Booking Lead Time Insights for Town of Greenburgh
- The overall average booking lead time for vacation rentals in Town of Greenburgh is 38 days.
- Guests book furthest in advance for stays during July (average 63 days), likely coinciding with peak travel demand or local events.
- The shortest booking windows occur for stays in January (average 11 days), indicating more last-minute travel plans during this time.
- Seasonally, Summer (48 days avg.) sees the longest lead times, while Winter (23 days avg.) has the shortest, reflecting typical travel planning cycles.
Recommendations for Hosts
- Use the overall average lead time (38 days) as a baseline for your pricing and availability strategy in Town of Greenburgh.
- For July stays, consider implementing length-of-stay discounts or slightly higher rates for bookings made less than 63 days out to capitalize on advance planning.
- During January, focus on last-minute booking availability and promotions, as guests book with very short notice (11 days avg.).
- Target marketing efforts for the Summer season well in advance (at least 48 days) to capture early planners.
- Monitor your own booking lead times against these Town of Greenburgh averages to identify opportunities for dynamic pricing adjustments.
Popular & Essential Airbnb Amenities in Town of Greenburgh (2026)
Amenity Prevalence
Amenity Insights for Town of Greenburgh
- Essential amenities in Town of Greenburgh that guests expect include: Carbon monoxide alarm, Air conditioning, Wifi, Free parking on premises, Smoke alarm, Hot water, Heating, Iron. Lacking these (any) could significantly impact bookings.
- Popular amenities like Hangers, First aid kit are common but not universal. Offering these can provide a competitive edge.
Recommendations for Hosts
- Ensure your listing includes all essential amenities for Town of Greenburgh: Carbon monoxide alarm, Air conditioning, Wifi, Free parking on premises, Smoke alarm, Hot water, Heating, Iron.
- Prioritize adding missing essentials: Hot water, Heating, Iron.
- Consider adding popular differentiators like Hangers or First aid kit to increase appeal.
- Highlight unique or less common amenities you offer (e.g., hot tub, dedicated workspace, EV charger) in your listing description and photos.
- Regularly check competitor amenities in Town of Greenburgh to stay competitive.
Town of Greenburgh Airbnb Guest Demographics & Profile Analysis (2026)
Guest Profile Summary for Town of Greenburgh
- The typical guest profile for Airbnb in Town of Greenburgh consists of primarily domestic travelers (95%), often arriving from nearby New York, typically belonging to the Post-2000s (Gen Z/Alpha) group (50%), primarily speaking English or Spanish.
- Domestic travelers account for 94.7% of guests.
- Key international markets include United States (94.7%) and Switzerland (0.7%).
- Top languages spoken are English (59.8%) followed by Spanish (13.4%).
- A significant demographic segment is the Post-2000s (Gen Z/Alpha) group, representing 50% of guests.
Recommendations for Hosts
- Target domestic marketing efforts towards travelers from New York and Boston.
- Tailor amenities and listing descriptions to appeal to the dominant Post-2000s (Gen Z/Alpha) demographic (e.g., highlight fast WiFi, smart home features, local guides).
- Highlight unique local experiences or amenities relevant to the primary guest profile.
- Consider seasonal promotions aligned with peak travel times for key origin markets.
Nearby Short-Term Rental Market Comparison
How does the Town of Greenburgh Airbnb market stack up against its neighbors? Compare key performance metrics like average monthly revenue, ADR, and occupancy rates in surrounding areas to understand the broader regional STR landscape.
| Market | Active Properties | Monthly Revenue | Daily Rate | Avg. Occupancy |
|---|---|---|---|---|
| Town of Kingston | 10 | $6,470 | $473.76 | 49% |
| Frankford Township | 11 | $6,329 | $505.19 | 41% |
| Sag Harbor | 15 | $6,129 | $1280.84 | 40% |
| Town of East Hampton | 1,327 | $5,945 | $986.02 | 36% |
| Spring Lake Heights | 16 | $5,785 | $725.20 | 40% |
| Town of Monroe | 22 | $5,690 | $720.52 | 37% |
| Town of Southampton | 1,201 | $5,620 | $1002.45 | 33% |
| Town of Ancram | 22 | $5,616 | $512.55 | 38% |
| Southampton | 19 | $5,405 | $1456.43 | 30% |
| Neptune City | 12 | $5,299 | $531.14 | 45% |