Almond Airbnb Market Analysis 2026: Short Term Rental Data & Vacation Rental Statistics in North Carolina, United States
Is Airbnb profitable in Almond in 2026? Explore comprehensive Airbnb analytics for Almond, North Carolina, United States to uncover income potential. This 2026 STR market report for Almond, based on AirROI data from February 2025 to January 2026, reveals key trends in the niche market of 45 active listings.
Whether you're considering an Airbnb investment in Almond, optimizing your existing vacation rental, or exploring rental arbitrage opportunities, understanding the Almond Airbnb data is crucial. Leveraging the low regulation environment is key to maximizing your short term rental income potential. Let's dive into the specifics.
Key Almond Airbnb Performance Metrics Overview
Monthly Airbnb Revenue Variations & Income Potential in Almond (2026)
Understanding the monthly revenue variations for Airbnb listings in Almond is key to maximizing your short term rental income potential. Seasonality significantly impacts earnings. Our analysis, based on data from the past 12 months, shows that the peak revenue month for STRs in Almond is typically October, while February often presents the lowest earnings, highlighting opportunities for strategic pricing adjustments during shoulder and low seasons. Explore the typical Airbnb income in Almond across different performance tiers:
- Best-in-class properties (Top 10%) achieve $6,998+ monthly, often utilizing dynamic pricing and superior guest experiences.
- Strong performing properties (Top 25%) earn $4,456 or more, indicating effective management and desirable locations/amenities.
- Typical properties (Median) generate around $2,735 per month, representing the average market performance.
- Entry-level properties (Bottom 25%) see earnings around $1,454, often with potential for optimization.
Average Monthly Airbnb Earnings Trend in Almond
Almond Airbnb Occupancy Rate Trends (2026)
Maximize your bookings by understanding the Almond STR occupancy trends. Seasonal demand shifts significantly influence how often properties are booked. Typically, Octobersees the highest demand (peak season occupancy), while January experiences the lowest (low season). Effective strategies, like adjusting minimum stays or offering promotions, can boost occupancy during slower periods. Here's how different property tiers perform in Almond:
- Best-in-class properties (Top 10%) achieve 75%+ occupancy, indicating high desirability and potentially optimized availability.
- Strong performing properties (Top 25%) maintain 60% or higher occupancy, suggesting good market fit and guest satisfaction.
- Typical properties (Median) have an occupancy rate around 42%.
- Entry-level properties (Bottom 25%) average 21% occupancy, potentially facing higher vacancy.
Average Monthly Occupancy Rate Trend in Almond
Average Daily Rate (ADR) Airbnb Trends in Almond (2026)
Effective short term rental pricing strategy in Almond involves understanding monthly ADR fluctuations. The Average Daily Rate (ADR) for Airbnb in Almond typically peaks in December and dips lowest during March. Leveraging Airbnb dynamic pricing tools or strategies based on this seasonality can significantly boost revenue. Here's a look at the typical nightly rates achieved:
- Best-in-class properties (Top 10%) command rates of $449+ per night, often due to premium features or locations.
- Strong performing properties (Top 25%) achieve nightly rates of $308 or more.
- Typical properties (Median) charge around $237 per night.
- Entry-level properties (Bottom 25%) earn around $168 per night.
Average Daily Rate (ADR) Trend by Month in Almond
Get Live Almond Market Intelligence 👇

Explore Real-time Analytics
Airbnb Seasonality Analysis & Trends in Almond (2026)
Peak Season (October, December, July)
- Revenue averages $4,680 per month
- Occupancy rates average 51.2%
- Daily rates average $317
Shoulder Season
- Revenue averages $3,337 per month
- Occupancy maintains around 43.9%
- Daily rates hold near $288
Low Season (January, February, April)
- Revenue drops to average $2,089 per month
- Occupancy decreases to average 30.7%
- Daily rates adjust to average $279
Seasonality Insights for Almond
- The Airbnb seasonality in Almond shows highly seasonal trends requiring careful strategy. While the sections above show seasonal averages, it's also insightful to look at the extremes:
- During the high season, the absolute peak month showcases Almond's highest earning potential, with monthly revenues capable of climbing to $5,143, occupancy reaching a high of 57.4%, and ADRs peaking at $325.
- Conversely, the slowest single month of the year, typically falling within the low season, marks the market's lowest point. In this month, revenue might dip to $1,716, occupancy could drop to 26.0%, and ADRs may adjust down to $268.
- Understanding both the seasonal averages and these monthly peaks and troughs in revenue, occupancy, and ADR is crucial for maximizing your Airbnb profit potential in Almond.
Seasonal Strategies for Maximizing Profit
- Peak Season: Maximize revenue through premium pricing and potentially longer minimum stays. Ensure high availability.
- Low Season: Offer competitive pricing, special promotions (e.g., extended stay discounts), and flexible cancellation policies. Target off-season travelers like remote workers or budget-conscious guests.
- Shoulder Seasons: Implement dynamic pricing that balances peak and low rates. Target weekend travelers or specific events. Offer slightly more flexible terms than peak season.
- Regularly analyze your own performance against these Almond seasonality benchmarks and adjust your pricing and availability strategy accordingly.
Best Areas for Airbnb Investment in Almond (2026)
Exploring the top neighborhoods for short-term rentals in Almond? This section highlights key areas, outlining why they are attractive for hosts and guests, along with notable local attractions. Consider these locations based on your target guest profile and investment strategy.
| Neighborhood / Area | Why Host Here? (Target Guests & Appeal) | Key Attractions & Landmarks |
|---|---|---|
| Almond Village | A quaint community located near the Great Smoky Mountains, perfect for those looking to escape to nature. Ideal for families and outdoor enthusiasts seeking a peaceful retreat. | Great Smoky Mountains National Park, Nantahala Outdoor Center, Joyce Kilmer Memorial Forest, Fontana Lake, Cherokee Bear Zoo |
| Bryson City | Adjacent to the Great Smoky Mountains, this charming town offers a blend of outdoor adventures and small-town charm, making it a great spot for tourists and travelers. | Great Smoky Mountains Railroad, Deep Creek Park, Nantahala River, Juney Whank Falls, Cherokee Cultural Heritage |
| Dillsboro | This historic town has a vibrant arts scene and access to beautiful rivers, drawing tourists who appreciate local crafts and outdoor fun. | Dillsboro River Company, Dillsboro Chocolate Factory, Art galleries, Nantahala River, Nearby hiking trails |
| Cherokee | A gateway to the Great Smoky Mountains, offering rich Native American culture and numerous attractions, popular among history buffs and nature lovers. | Cherokee Indian Reservation, Oconaluftee Visitor Center, Museum of the Cherokee Indian, Mingo Falls, Harrah's Cherokee Casino |
| Sylva | A picturesque mountain town with a thriving downtown area, it attracts visitors with its shops and outdoor activities, ideal for Airbnb hosting. | Downtown Sylva, Jackson County Public Library, Balsam Mountain Preserve, Nantahala National Forest, Historic courthouse |
| Franklin | Known for its gem mining and beautiful mountain scenery, Franklin is popular among visitors looking for both adventure and relaxation. | Franklin Gem and Mineral Museum, Coweeta Hydrologic Laboratory, Nantahala National Forest, Routes for hiking, Scottish Tartans Museum |
| Lake Santeetlah | This quiet lake area provides tranquility and recreation opportunities, ideal for vacation rentals focusing on relaxation and nature experiences. | Lake Santeetlah, Boating and fishing, Nature trails, Scenic views, Wildlife observation |
| Highlands | An upscale mountain town known for its luxury accommodations and beautiful scenery, attracts affluent visitors year-round. | Whiteside Mountain, Highlands Botanical Garden, Dry Falls, Shopping and dining downtown, Golf courses |
Understanding Airbnb License Requirements & STR Laws in Almond (2026)
While Almond, North Carolina, United States currently shows low STR regulations, specific Airbnb license requirements might still exist or change. Always verify the latest short term rental regulations and Airbnb license requirements directly with local government authorities for Almond to ensure full compliance before hosting.
(Source: AirROI data, 2026, finding no licensed listings among those analyzed)
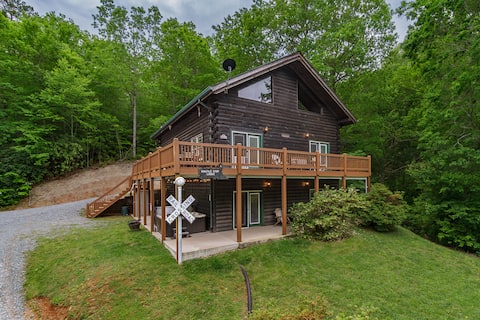
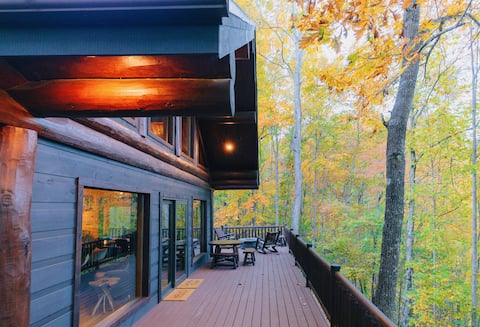
Top Performing Airbnb Properties in Almond (2026)
Benchmark your potential! Explore examples of top-performing Airbnb properties in Almondbased on Trailing Twelve Month (TTM) revenue. Analyze their characteristics, revenue, occupancy rate, and ADR to understand what drives success in this market.
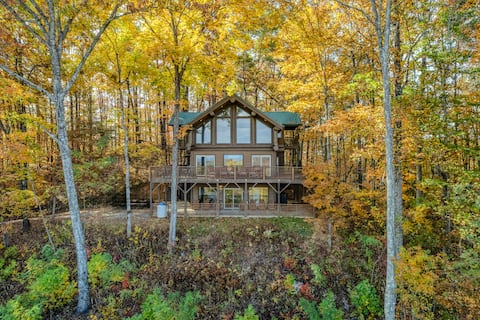
Fontana View 3: Smoky Mnt Family Cabin, Sleeps 18!
Entire Place • 5 bedrooms

5br Log Cabin • Hot Tub, Game Room, Yard, Firepit!
Entire Place • 5 bedrooms
Unique/Luxurious/Stunning Mtn & Lake Views, Wi-Fi!
Entire Place • 4 bedrooms
Whistle Stop Lodge
Entire Place • 6 bedrooms
Moonstruck |Hot Tub|Luxurious King Bed & Tub
Entire Place • 1 bedroom

Fontana View 2 | Gorgeous Smoky Mt Cabin w/ Views
Entire Place • 2 bedrooms
Note: Performance varies based on location, size, amenities, seasonality, and management quality. Data reflects the past 12 months.
Top Performing Airbnb Hosts in Almond (2026)
Learn from the best! This table showcases top-performing Airbnb hosts in Almond based on the number of properties managed and estimated total revenue over the past year. Analyze their scale and performance metrics.
| Host Name | Properties | Grossing Revenue | Stay Reviews | Avg Rating |
|---|---|---|---|---|
| Stonewood | 6 | $333,574 | 859 | 4.83/5.0 |
| Carolina Mountain Vacations | 3 | $119,064 | 126 | 4.78/5.0 |
| Shelby | 4 | $102,270 | 1216 | 4.88/5.0 |
| Alexander | 1 | $95,282 | 108 | 4.99/5.0 |
| Kathleen | 1 | $94,618 | 78 | 4.83/5.0 |
| Maria-Tim | 4 | $78,963 | 66 | 4.81/5.0 |
| Kyle | 2 | $78,948 | 196 | 4.95/5.0 |
| Yanelis | 1 | $59,615 | 124 | 4.97/5.0 |
| Yellow Rose | 2 | $58,935 | 59 | 4.98/5.0 |
| Daniel And Anna | 1 | $48,021 | 70 | 4.94/5.0 |
Analyzing the strategies of top hosts, such as their property selection, pricing, and guest communication, can offer valuable lessons for optimizing your own Airbnb operations in Almond.
Dive Deeper: Advanced Almond STR Market Data (2026)
Ready to unlock more insights? AirROI provides access to advanced metrics and comprehensive Airbnb data for Almond. Explore detailed analytics beyond this report to refine your investment strategy, optimize pricing, and maximize your vacation rental profits.
Explore Advanced MetricsAlmond Short-Term Rental Market Composition (2026): Property & Room Types
Room Type Distribution
Property Type Distribution
Market Composition Insights for Almond
- The Almond Airbnb market composition is heavily skewed towards Entire Home/Apt listings, which make up 100% of the 45 active rentals. This indicates strong guest preference for privacy and space.
- Looking at the property type distribution in Almond, Outdoor/Unique properties are the most common (71.1%), reflecting the local real estate landscape.
- Houses represent a significant 28.9% portion, catering likely to families or larger groups.
Almond Airbnb Room Capacity Analysis (2026): Bedroom Distribution
Distribution of Listings by Number of Bedrooms
Room Capacity Insights for Almond
- The dominant room capacity in Almond is 2 bedrooms listings, making up 31.1% of the market. This suggests a strong demand for properties suitable for couples or solo travelers.
- Together, 2 bedrooms and 1 bedroom properties represent 55.5% of the active Airbnb listings in Almond, indicating a high concentration in these sizes.
- A significant 42.2% of listings offer 3+ bedrooms, catering to larger groups and families seeking more space in Almond.
Almond Vacation Rental Guest Capacity Trends (2026)
Distribution of Listings by Guest Capacity
Guest Capacity Insights for Almond
- The most common guest capacity trend in Almond vacation rentals is listings accommodating 8+ guests (33.3%). This suggests the primary traveler segment is likely larger groups.
- Properties designed for 8+ guests and 6 guests dominate the Almond STR market, accounting for 66.6% of listings.
- 66.6% of properties accommodate 6+ guests, serving the market segment for larger families or group travel in Almond.
- On average, properties in Almond are equipped to host 5.8 guests.
Almond Airbnb Booking Patterns (2026): Available vs. Booked Days
Available Days Distribution
Booked Days Distribution
Booking Pattern Insights for Almond
- The most common availability pattern in Almond falls within the 271-366 days range, representing 46.7% of listings. This suggests many properties have significant open periods on their calendars.
- Approximately 68.9% of listings show high availability (181+ days open annually), indicating potential for increased bookings or specific owner usage patterns.
- For booked days, the 181-270 days range is most frequent in Almond (28.9%), reflecting common guest stay durations or potential owner blocking patterns.
- A notable 31.1% of properties secure long booking periods (181+ days booked per year), highlighting successful long-term rental strategies or significant owner usage.
Almond Airbnb Minimum Stay Requirements Analysis
Distribution of Listings by Minimum Night Requirement
1 Night
3 listings
6.7% of total
2 Nights
22 listings
48.9% of total
3 Nights
3 listings
6.7% of total
30+ Nights
17 listings
37.8% of total
Key Insights
- The most prevalent minimum stay requirement in Almond is 2 Nights, adopted by 48.9% of listings. This highlights the market's preference for shorter, flexible bookings.
- A significant segment (37.8%) caters to monthly stays (30+ nights) in Almond, pointing to opportunities in the extended-stay market.
Recommendations
- Align with the market by considering a 2 Nights minimum stay, as 48.9% of Almond hosts use this setting.
- If feasible, allowing 1-night stays, especially midweek or during low season, could capture last-minute bookings, as only 6.7% currently do.
- A 2-night minimum appears standard (48.9%). Consider this for weekends or peak periods.
- Explore offering discounts for stays of 30+ nights to attract the 37.8% of the market seeking extended stays.
- Adjust minimum nights based on seasonality – potentially shorter during low season and longer during peak demand periods in Almond.
Almond Airbnb Cancellation Policy Trends Analysis (2026)
Super Strict 60 Days
1 listings
2.2% of total
Super Strict 30 Days
13 listings
28.9% of total
Flexible
6 listings
13.3% of total
Moderate
3 listings
6.7% of total
Firm
19 listings
42.2% of total
Strict
3 listings
6.7% of total
Cancellation Policy Insights for Almond
- The prevailing Airbnb cancellation policy trend in Almond is Firm, used by 42.2% of listings.
- There's a relatively balanced mix between guest-friendly (20.0%) and stricter (48.9%) policies, offering choices for different guest needs.
- Strict cancellation policies are quite rare (6.7%), potentially making listings with this policy less competitive unless justified by high demand or property type.
Recommendations for Hosts
- Consider adopting a Firm policy to align with the 42.2% market standard in Almond.
- Using a Strict policy might deter some guests, as only 6.7% of listings use it. Evaluate if potential revenue protection outweighs possible lower booking rates.
- Regularly review your cancellation policy against competitors and market demand shifts in Almond.
Almond STR Booking Lead Time Analysis (2026)
Average Booking Lead Time by Month
Booking Lead Time Insights for Almond
- The overall average booking lead time for vacation rentals in Almond is 57 days.
- Guests book furthest in advance for stays during December (average 79 days), likely coinciding with peak travel demand or local events.
- The shortest booking windows occur for stays in February (average 27 days), indicating more last-minute travel plans during this time.
- Seasonally, Fall (69 days avg.) sees the longest lead times, while Winter (49 days avg.) has the shortest, reflecting typical travel planning cycles.
Recommendations for Hosts
- Use the overall average lead time (57 days) as a baseline for your pricing and availability strategy in Almond.
- For December stays, consider implementing length-of-stay discounts or slightly higher rates for bookings made less than 79 days out to capitalize on advance planning.
- Target marketing efforts for the Fall season well in advance (at least 69 days) to capture early planners.
- Monitor your own booking lead times against these Almond averages to identify opportunities for dynamic pricing adjustments.
Popular & Essential Airbnb Amenities in Almond (2026)
Amenity Prevalence
Amenity Insights for Almond
- Essential amenities in Almond that guests expect include: Free parking on premises, Kitchen, Air conditioning, TV, Smoke alarm, Dishes and silverware, Fire extinguisher. Lacking these (any) could significantly impact bookings.
- Popular amenities like Heating, Refrigerator, Cooking basics are common but not universal. Offering these can provide a competitive edge.
Recommendations for Hosts
- Ensure your listing includes all essential amenities for Almond: Free parking on premises, Kitchen, Air conditioning, TV, Smoke alarm, Dishes and silverware, Fire extinguisher.
- Prioritize adding missing essentials: Free parking on premises, Kitchen, Air conditioning, TV, Smoke alarm, Dishes and silverware, Fire extinguisher.
- Consider adding popular differentiators like Heating or Refrigerator to increase appeal.
- Highlight unique or less common amenities you offer (e.g., hot tub, dedicated workspace, EV charger) in your listing description and photos.
- Regularly check competitor amenities in Almond to stay competitive.
Almond Airbnb Guest Demographics & Profile Analysis (2026)
Guest Profile Summary for Almond
- The typical guest profile for Airbnb in Almond consists of primarily domestic travelers (97%), often arriving from nearby Asheville, typically belonging to the Post-2000s (Gen Z/Alpha) group (50%), primarily speaking English or Spanish.
- Domestic travelers account for 97.3% of guests.
- Key international markets include United States (97.3%) and Canada (0.6%).
- Top languages spoken are English (71.3%) followed by Spanish (12.8%).
- A significant demographic segment is the Post-2000s (Gen Z/Alpha) group, representing 50% of guests.
Recommendations for Hosts
- Target domestic marketing efforts towards travelers from Asheville and Charlotte.
- Tailor amenities and listing descriptions to appeal to the dominant Post-2000s (Gen Z/Alpha) demographic (e.g., highlight fast WiFi, smart home features, local guides).
- Highlight unique local experiences or amenities relevant to the primary guest profile.
- Consider seasonal promotions aligned with peak travel times for key origin markets.
Nearby Short-Term Rental Market Comparison
How does the Almond Airbnb market stack up against its neighbors? Compare key performance metrics like average monthly revenue, ADR, and occupancy rates in surrounding areas to understand the broader regional STR landscape.
| Market | Active Properties | Monthly Revenue | Daily Rate | Avg. Occupancy |
|---|---|---|---|---|
| Sevier County | 68 | $7,108 | $567.95 | 44% |
| Gilmer County | 26 | $5,298 | $459.59 | 40% |
| Union Mills | 15 | $4,938 | $442.76 | 41% |
| Sevierville | 6,269 | $4,747 | $370.20 | 46% |
| Fannin County | 42 | $4,574 | $435.93 | 38% |
| East Ellijay | 15 | $4,415 | $368.05 | 41% |
| Epworth | 79 | $4,411 | $406.97 | 40% |
| Six Mile | 57 | $4,396 | $449.78 | 42% |
| Gatlinburg | 3,565 | $4,385 | $353.70 | 45% |
| Commerce | 19 | $4,298 | $285.34 | 45% |