Ashville Airbnb Market Analysis 2026: Short Term Rental Data & Vacation Rental Statistics in North Carolina, United States
Is Airbnb profitable in Ashville in 2026? Explore comprehensive Airbnb analytics for Ashville, North Carolina, United States to uncover income potential. This 2026 STR market report for Ashville, based on AirROI data from February 2025 to January 2026, reveals key trends in the niche market of 79 active listings.
Whether you're considering an Airbnb investment in Ashville, optimizing your existing vacation rental, or exploring rental arbitrage opportunities, understanding the Ashville Airbnb data is crucial. Leveraging the low regulation environment is key to maximizing your short term rental income potential. Let's dive into the specifics.
Key Ashville Airbnb Performance Metrics Overview
Monthly Airbnb Revenue Variations & Income Potential in Ashville (2026)
Understanding the monthly revenue variations for Airbnb listings in Ashville is key to maximizing your short term rental income potential. Seasonality significantly impacts earnings. Our analysis, based on data from the past 12 months, shows that the peak revenue month for STRs in Ashville is typically December, while May often presents the lowest earnings, highlighting opportunities for strategic pricing adjustments during shoulder and low seasons. Explore the typical Airbnb income in Ashville across different performance tiers:
- Best-in-class properties (Top 10%) achieve $8,954+ monthly, often utilizing dynamic pricing and superior guest experiences.
- Strong performing properties (Top 25%) earn $5,201 or more, indicating effective management and desirable locations/amenities.
- Typical properties (Median) generate around $2,441 per month, representing the average market performance.
- Entry-level properties (Bottom 25%) see earnings around $949, often with potential for optimization.
Average Monthly Airbnb Earnings Trend in Ashville
Ashville Airbnb Occupancy Rate Trends (2026)
Maximize your bookings by understanding the Ashville STR occupancy trends. Seasonal demand shifts significantly influence how often properties are booked. Typically, Octobersees the highest demand (peak season occupancy), while May experiences the lowest (low season). Effective strategies, like adjusting minimum stays or offering promotions, can boost occupancy during slower periods. Here's how different property tiers perform in Ashville:
- Best-in-class properties (Top 10%) achieve 73%+ occupancy, indicating high desirability and potentially optimized availability.
- Strong performing properties (Top 25%) maintain 58% or higher occupancy, suggesting good market fit and guest satisfaction.
- Typical properties (Median) have an occupancy rate around 40%.
- Entry-level properties (Bottom 25%) average 23% occupancy, potentially facing higher vacancy.
Average Monthly Occupancy Rate Trend in Ashville
Average Daily Rate (ADR) Airbnb Trends in Ashville (2026)
Effective short term rental pricing strategy in Ashville involves understanding monthly ADR fluctuations. The Average Daily Rate (ADR) for Airbnb in Ashville typically peaks in October and dips lowest during August. Leveraging Airbnb dynamic pricing tools or strategies based on this seasonality can significantly boost revenue. Here's a look at the typical nightly rates achieved:
- Best-in-class properties (Top 10%) command rates of $605+ per night, often due to premium features or locations.
- Strong performing properties (Top 25%) achieve nightly rates of $295 or more.
- Typical properties (Median) charge around $201 per night.
- Entry-level properties (Bottom 25%) earn around $104 per night.
Average Daily Rate (ADR) Trend by Month in Ashville
Get Live Ashville Market Intelligence 👇
Explore Real-time Analytics
Airbnb Seasonality Analysis & Trends in Ashville (2026)
Peak Season (December, October, November)
- Revenue averages $5,924 per month
- Occupancy rates average 49.7%
- Daily rates average $347
Shoulder Season
- Revenue averages $2,919 per month
- Occupancy maintains around 37.4%
- Daily rates hold near $252
Low Season (February, March, April)
- Revenue drops to average $0 per month
- Occupancy decreases to average 0.0%
- Daily rates adjust to average $245
Seasonality Insights for Ashville
- The Airbnb seasonality in Ashville shows highly seasonal trends requiring careful strategy. While the sections above show seasonal averages, it's also insightful to look at the extremes:
- During the high season, the absolute peak month showcases Ashville's highest earning potential, with monthly revenues capable of climbing to $6,474, occupancy reaching a high of 53.6%, and ADRs peaking at $362.
- Conversely, the slowest single month of the year, typically falling within the low season, marks the market's lowest point. In this month, revenue might dip to $0, occupancy could drop to 0.0%, and ADRs may adjust down to $217.
- Understanding both the seasonal averages and these monthly peaks and troughs in revenue, occupancy, and ADR is crucial for maximizing your Airbnb profit potential in Ashville.
Seasonal Strategies for Maximizing Profit
- Peak Season: Maximize revenue through premium pricing and potentially longer minimum stays. Ensure high availability.
- Low Season: Offer competitive pricing, special promotions (e.g., extended stay discounts), and flexible cancellation policies. Target off-season travelers like remote workers or budget-conscious guests.
- Shoulder Seasons: Implement dynamic pricing that balances peak and low rates. Target weekend travelers or specific events. Offer slightly more flexible terms than peak season.
- Regularly analyze your own performance against these Ashville seasonality benchmarks and adjust your pricing and availability strategy accordingly.
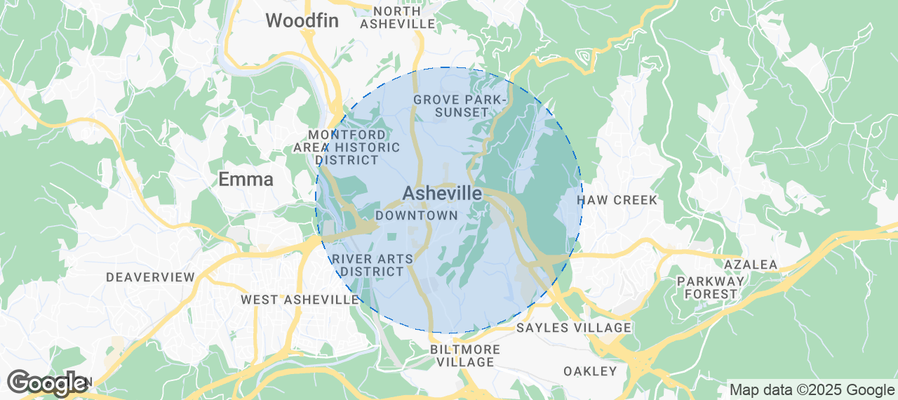
Best Areas for Airbnb Investment in Ashville (2026)
Exploring the top neighborhoods for short-term rentals in Ashville? This section highlights key areas, outlining why they are attractive for hosts and guests, along with notable local attractions. Consider these locations based on your target guest profile and investment strategy.
| Neighborhood / Area | Why Host Here? (Target Guests & Appeal) | Key Attractions & Landmarks |
|---|---|---|
| Downtown Asheville | The vibrant heart of Asheville, known for its historic architecture, arts scene, and proximity to popular restaurants and shops. Ideal for tourists looking to explore the city. | Asheville Art Museum, Pack Square Park, Woolworth Walk, The Orange Peel, Biltmore Estate |
| Biltmore Village | A charming neighborhood adjacent to the Biltmore Estate, featuring boutique shops, fine dining, and scenic views. A top choice for visitors wanting a quaint experience near Asheville's biggest attraction. | Biltmore Estate, Biltmore Winery, The Gardens at Biltmore, Antler Hill Village, Village Antiques |
| North Asheville | A residential area offering a more laid-back atmosphere with beautiful parks and access to the Blue Ridge Parkway. Attracts families and nature lovers looking for tranquility and natural beauty. | Beaver Lake, North Asheville County Club, Lake View Park, The Blue Ridge Parkway, Reed Creek Greenway |
| West Asheville | Known for its hipster vibe, unique shops, and local breweries. Popular among younger crowds and those looking for a more eclectic stay with a strong local feel. | The Rad Bakery, Wedge Brewing Company, Carrier Park, West Asheville's eclectic shops, Restaurants with live music |
| South Asheville | A suburban area with family-friendly amenities and access to the scenic Blue Ridge Parkway. Great for visitors looking for a quieter stay while being close to attractions. | Blue Ridge Parkway, French Broad River Park, Asheville Outlets, Hendersonville Road shopping, Biltmore Park Town Square |
| East Asheville | Known for its beautiful vistas and access to hiking trails. It’s popular with outdoor enthusiasts and those seeking a more tranquil environment amidst nature. | Pisgah National Forest, Mount Mitchell, The North Carolina Arboretum, Bee Tree Park, Catawba Falls |
| River Arts District | An artsy area filled with studios, galleries, and a vibrant community of artists. It's an up-and-coming location popular with creatives and couples looking for a unique experience. | Art studios and galleries, River Arts District Farmers Market, The French Broad River, Asheville's street art, Local breweries and cafes |
| Montford Historic District | A historic residential neighborhood with charming homes and tree-lined streets. Ideal for visitors wanting a peaceful stay while being close to downtown. | Montford Park, The Asheville Community Theater, Historic homes, Garden walks, Local cafes |
Understanding Airbnb License Requirements & STR Laws in Ashville (2026)
While Ashville, North Carolina, United States currently shows low STR regulations, specific Airbnb license requirements might still exist or change. Always verify the latest short term rental regulations and Airbnb license requirements directly with local government authorities for Ashville to ensure full compliance before hosting.
(Source: AirROI data, 2026, finding no licensed listings among those analyzed)
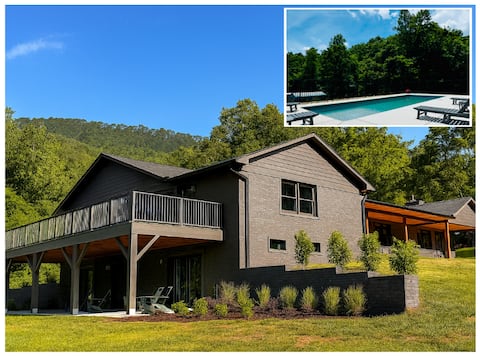
Top Performing Airbnb Properties in Ashville (2026)
Benchmark your potential! Explore examples of top-performing Airbnb properties in Ashvillebased on Trailing Twelve Month (TTM) revenue. Analyze their characteristics, revenue, occupancy rate, and ADR to understand what drives success in this market.
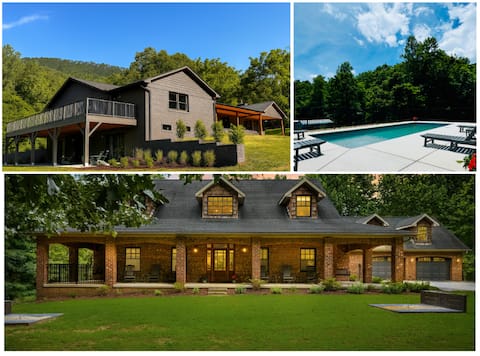
Huntly Estate · Pool · Sleeps 46
Entire Place • 17 bedrooms
The Grange · Heated Pool, Fire Pit · Sleeps 16
Entire Place • 8 bedrooms

Luxury Views, Geodome, Arcades 15 min to Asheville
Entire Place • 6 bedrooms

Game Room, Hot Tub, Cold Plunge, Sauna, Fire Pit
Entire Place • 5 bedrooms

Newly Built 6BR Net Zero Home 5 mins to Biltmore
Entire Place • 6 bedrooms
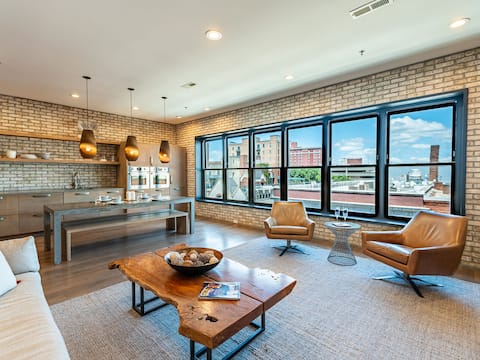
Downtown Penthouse +Biltmore Pass, Pet-Friendly
Entire Place • 3 bedrooms
Note: Performance varies based on location, size, amenities, seasonality, and management quality. Data reflects the past 12 months.
Top Performing Airbnb Hosts in Ashville (2026)
Learn from the best! This table showcases top-performing Airbnb hosts in Ashville based on the number of properties managed and estimated total revenue over the past year. Analyze their scale and performance metrics.
| Host Name | Properties | Grossing Revenue | Stay Reviews | Avg Rating |
|---|---|---|---|---|
| Yonder | 2 | $316,239 | 5 | 5.00/5.0 |
| Mindi | 1 | $119,685 | 29 | 5.00/5.0 |
| Lance & Micaela | 1 | $101,460 | 25 | 5.00/5.0 |
| Ania | 3 | $97,390 | 66 | 4.95/5.0 |
| Molly Rose | 1 | $91,243 | 7 | 5.00/5.0 |
| Jennifer | 3 | $84,426 | 54 | 4.96/5.0 |
| Carolina Mornings | 1 | $82,623 | 10 | 4.70/5.0 |
| Ronit | 1 | $73,316 | 30 | 4.77/5.0 |
| Sean | 1 | $71,523 | 17 | 5.00/5.0 |
| Towns | 1 | $70,721 | 19 | 4.89/5.0 |
Analyzing the strategies of top hosts, such as their property selection, pricing, and guest communication, can offer valuable lessons for optimizing your own Airbnb operations in Ashville.
Dive Deeper: Advanced Ashville STR Market Data (2026)
Ready to unlock more insights? AirROI provides access to advanced metrics and comprehensive Airbnb data for Ashville. Explore detailed analytics beyond this report to refine your investment strategy, optimize pricing, and maximize your vacation rental profits.
Explore Advanced MetricsAshville Short-Term Rental Market Composition (2026): Property & Room Types
Room Type Distribution
Property Type Distribution
Market Composition Insights for Ashville
- The Ashville Airbnb market composition is heavily skewed towards Entire Home/Apt listings, which make up 86.1% of the 79 active rentals. This indicates strong guest preference for privacy and space.
- Looking at the property type distribution in Ashville, House properties are the most common (48.1%), reflecting the local real estate landscape.
- Houses represent a significant 48.1% portion, catering likely to families or larger groups.
- The presence of 6.3% Hotel/Boutique listings indicates integration with traditional hospitality.
Ashville Airbnb Room Capacity Analysis (2026): Bedroom Distribution
Distribution of Listings by Number of Bedrooms
Room Capacity Insights for Ashville
- The dominant room capacity in Ashville is 1 bedroom listings, making up 30.4% of the market. This suggests a strong demand for properties suitable for couples or solo travelers.
- Together, 1 bedroom and 2 bedrooms properties represent 54.5% of the active Airbnb listings in Ashville, indicating a high concentration in these sizes.
- A significant 33.0% of listings offer 3+ bedrooms, catering to larger groups and families seeking more space in Ashville.
Ashville Vacation Rental Guest Capacity Trends (2026)
Distribution of Listings by Guest Capacity
Guest Capacity Insights for Ashville
- The most common guest capacity trend in Ashville vacation rentals is listings accommodating 8+ guests (25.3%). This suggests the primary traveler segment is likely larger groups.
- Properties designed for 8+ guests and 4 guests dominate the Ashville STR market, accounting for 48.1% of listings.
- 39.2% of properties accommodate 6+ guests, serving the market segment for larger families or group travel in Ashville.
- On average, properties in Ashville are equipped to host 4.4 guests.
Ashville Airbnb Booking Patterns (2026): Available vs. Booked Days
Available Days Distribution
Booked Days Distribution
Booking Pattern Insights for Ashville
- The most common availability pattern in Ashville falls within the 271-366 days range, representing 49.4% of listings. This suggests many properties have significant open periods on their calendars.
- Approximately 92.4% of listings show high availability (181+ days open annually), indicating potential for increased bookings or specific owner usage patterns.
- For booked days, the 91-180 days range is most frequent in Ashville (44.3%), reflecting common guest stay durations or potential owner blocking patterns.
- A notable 8.9% of properties secure long booking periods (181+ days booked per year), highlighting successful long-term rental strategies or significant owner usage.
Ashville Airbnb Minimum Stay Requirements Analysis
Distribution of Listings by Minimum Night Requirement
1 Night
28 listings
35.4% of total
2 Nights
20 listings
25.3% of total
3 Nights
5 listings
6.3% of total
4-6 Nights
2 listings
2.5% of total
7-29 Nights
6 listings
7.6% of total
30+ Nights
18 listings
22.8% of total
Key Insights
- The most prevalent minimum stay requirement in Ashville is 1 Night, adopted by 35.4% of listings. This highlights the market's preference for shorter, flexible bookings.
- A strong majority (60.7%) of the Ashville Airbnb data shows acceptance of very short stays (1-2 nights), indicating a dynamic, high-turnover market.
- A significant segment (22.8%) caters to monthly stays (30+ nights) in Ashville, pointing to opportunities in the extended-stay market.
Recommendations
- Align with the market by considering a 1 Night minimum stay, as 35.4% of Ashville hosts use this setting.
- Explore offering discounts for stays of 30+ nights to attract the 22.8% of the market seeking extended stays.
- Adjust minimum nights based on seasonality – potentially shorter during low season and longer during peak demand periods in Ashville.
Ashville Airbnb Cancellation Policy Trends Analysis (2026)
Super Strict 30 Days
3 listings
3.8% of total
Limited
2 listings
2.5% of total
Super Strict 60 Days
5 listings
6.3% of total
Flexible
16 listings
20.3% of total
Moderate
16 listings
20.3% of total
Firm
28 listings
35.4% of total
Strict
9 listings
11.4% of total
Cancellation Policy Insights for Ashville
- The prevailing Airbnb cancellation policy trend in Ashville is Firm, used by 35.4% of listings.
- There's a relatively balanced mix between guest-friendly (40.6%) and stricter (46.8%) policies, offering choices for different guest needs.
Recommendations for Hosts
- Consider adopting a Firm policy to align with the 35.4% market standard in Ashville.
- Using a Strict policy might deter some guests, as only 11.4% of listings use it. Evaluate if potential revenue protection outweighs possible lower booking rates.
- Regularly review your cancellation policy against competitors and market demand shifts in Ashville.
Ashville STR Booking Lead Time Analysis (2026)
Average Booking Lead Time by Month
Booking Lead Time Insights for Ashville
- The overall average booking lead time for vacation rentals in Ashville is 27 days.
- Guests book furthest in advance for stays during October (average 49 days), likely coinciding with peak travel demand or local events.
- The shortest booking windows occur for stays in April (average 0 days), indicating more last-minute travel plans during this time.
- Seasonally, Fall (41 days avg.) sees the longest lead times, while Spring (1 days avg.) has the shortest, reflecting typical travel planning cycles.
Recommendations for Hosts
- Use the overall average lead time (27 days) as a baseline for your pricing and availability strategy in Ashville.
- For October stays, consider implementing length-of-stay discounts or slightly higher rates for bookings made less than 49 days out to capitalize on advance planning.
- During April, focus on last-minute booking availability and promotions, as guests book with very short notice (0 days avg.).
- Target marketing efforts for the Fall season well in advance (at least 41 days) to capture early planners.
- Monitor your own booking lead times against these Ashville averages to identify opportunities for dynamic pricing adjustments.
Popular & Essential Airbnb Amenities in Ashville (2026)
Amenity Prevalence
Amenity Insights for Ashville
- Essential amenities in Ashville that guests expect include: Wifi, Smoke alarm, Air conditioning. Lacking these (any) could significantly impact bookings.
- Popular amenities like TV, Kitchen, Carbon monoxide alarm are common but not universal. Offering these can provide a competitive edge.
Recommendations for Hosts
- Ensure your listing includes all essential amenities for Ashville: Wifi, Smoke alarm, Air conditioning.
- Prioritize adding missing essentials: Air conditioning.
- Consider adding popular differentiators like TV or Kitchen to increase appeal.
- Highlight unique or less common amenities you offer (e.g., hot tub, dedicated workspace, EV charger) in your listing description and photos.
- Regularly check competitor amenities in Ashville to stay competitive.
Ashville Airbnb Guest Demographics & Profile Analysis (2026)
Guest Profile Summary for Ashville
- The typical guest profile for Airbnb in Ashville consists of primarily domestic travelers (96%), often arriving from nearby Charlotte, typically belonging to the Post-2000s (Gen Z/Alpha) group (50%), primarily speaking English or Spanish.
- Domestic travelers account for 96.3% of guests.
- Key international markets include United States (96.3%) and DC (1.2%).
- Top languages spoken are English (68.5%) followed by Spanish (14.4%).
- A significant demographic segment is the Post-2000s (Gen Z/Alpha) group, representing 50% of guests.
Recommendations for Hosts
- Target domestic marketing efforts towards travelers from Charlotte and Raleigh.
- Tailor amenities and listing descriptions to appeal to the dominant Post-2000s (Gen Z/Alpha) demographic (e.g., highlight fast WiFi, smart home features, local guides).
- Highlight unique local experiences or amenities relevant to the primary guest profile.
- Consider seasonal promotions aligned with peak travel times for key origin markets.
Nearby Short-Term Rental Market Comparison
How does the Ashville Airbnb market stack up against its neighbors? Compare key performance metrics like average monthly revenue, ADR, and occupancy rates in surrounding areas to understand the broader regional STR landscape.
| Market | Active Properties | Monthly Revenue | Daily Rate | Avg. Occupancy |
|---|---|---|---|---|
| Sevier County | 68 | $7,108 | $567.95 | 44% |
| Catawba | 16 | $6,093 | $582.49 | 38% |
| Union Mills | 15 | $4,938 | $442.76 | 41% |
| Sevierville | 6,269 | $4,747 | $370.20 | 46% |
| Six Mile | 57 | $4,396 | $449.78 | 42% |
| Gatlinburg | 3,565 | $4,385 | $353.70 | 45% |
| Commerce | 19 | $4,298 | $285.34 | 45% |
| Pigeon Forge | 2,938 | $4,158 | $337.10 | 45% |
| West Union | 30 | $4,126 | $564.92 | 32% |
| Sautee | 14 | $4,105 | $408.17 | 39% |