Indian Beach Airbnb Market Analysis 2026: Short Term Rental Data & Vacation Rental Statistics in North Carolina, United States
Is Airbnb profitable in Indian Beach in 2026? Explore comprehensive Airbnb analytics for Indian Beach, North Carolina, United States to uncover income potential. This 2026 STR market report for Indian Beach, based on AirROI data from February 2025 to January 2026, reveals key trends in the niche market of 21 active listings.
Whether you're considering an Airbnb investment in Indian Beach, optimizing your existing vacation rental, or exploring rental arbitrage opportunities, understanding the Indian Beach Airbnb data is crucial. Leveraging the low regulation environment is key to maximizing your short term rental income potential. Let's dive into the specifics.
Key Indian Beach Airbnb Performance Metrics Overview
Monthly Airbnb Revenue Variations & Income Potential in Indian Beach (2026)
Understanding the monthly revenue variations for Airbnb listings in Indian Beach is key to maximizing your short term rental income potential. Seasonality significantly impacts earnings. Our analysis, based on data from the past 12 months, shows that the peak revenue month for STRs in Indian Beach is typically June, while January often presents the lowest earnings, highlighting opportunities for strategic pricing adjustments during shoulder and low seasons. Explore the typical Airbnb income in Indian Beach across different performance tiers:
- Best-in-class properties (Top 10%) achieve $10,618+ monthly, often utilizing dynamic pricing and superior guest experiences.
- Strong performing properties (Top 25%) earn $5,262 or more, indicating effective management and desirable locations/amenities.
- Typical properties (Median) generate around $3,090 per month, representing the average market performance.
- Entry-level properties (Bottom 25%) see earnings around $1,583, often with potential for optimization.
Average Monthly Airbnb Earnings Trend in Indian Beach
Indian Beach Airbnb Occupancy Rate Trends (2026)
Maximize your bookings by understanding the Indian Beach STR occupancy trends. Seasonal demand shifts significantly influence how often properties are booked. Typically, Julysees the highest demand (peak season occupancy), while January experiences the lowest (low season). Effective strategies, like adjusting minimum stays or offering promotions, can boost occupancy during slower periods. Here's how different property tiers perform in Indian Beach:
- Best-in-class properties (Top 10%) achieve 60%+ occupancy, indicating high desirability and potentially optimized availability.
- Strong performing properties (Top 25%) maintain 44% or higher occupancy, suggesting good market fit and guest satisfaction.
- Typical properties (Median) have an occupancy rate around 29%.
- Entry-level properties (Bottom 25%) average 15% occupancy, potentially facing higher vacancy.
Average Monthly Occupancy Rate Trend in Indian Beach
Average Daily Rate (ADR) Airbnb Trends in Indian Beach (2026)
Effective short term rental pricing strategy in Indian Beach involves understanding monthly ADR fluctuations. The Average Daily Rate (ADR) for Airbnb in Indian Beach typically peaks in July and dips lowest during February. Leveraging Airbnb dynamic pricing tools or strategies based on this seasonality can significantly boost revenue. Here's a look at the typical nightly rates achieved:
- Best-in-class properties (Top 10%) command rates of $573+ per night, often due to premium features or locations.
- Strong performing properties (Top 25%) achieve nightly rates of $433 or more.
- Typical properties (Median) charge around $334 per night.
- Entry-level properties (Bottom 25%) earn around $279 per night.
Average Daily Rate (ADR) Trend by Month in Indian Beach
Get Live Indian Beach Market Intelligence 👇
Explore Real-time Analytics
Airbnb Seasonality Analysis & Trends in Indian Beach (2026)
Peak Season (June, July, August)
- Revenue averages $8,450 per month
- Occupancy rates average 52.0%
- Daily rates average $456
Shoulder Season
- Revenue averages $3,884 per month
- Occupancy maintains around 29.3%
- Daily rates hold near $381
Low Season (January, November, December)
- Revenue drops to average $2,040 per month
- Occupancy decreases to average 16.4%
- Daily rates adjust to average $375
Seasonality Insights for Indian Beach
- The Airbnb seasonality in Indian Beach shows highly seasonal trends requiring careful strategy. While the sections above show seasonal averages, it's also insightful to look at the extremes:
- During the high season, the absolute peak month showcases Indian Beach's highest earning potential, with monthly revenues capable of climbing to $9,548, occupancy reaching a high of 54.8%, and ADRs peaking at $461.
- Conversely, the slowest single month of the year, typically falling within the low season, marks the market's lowest point. In this month, revenue might dip to $1,294, occupancy could drop to 10.9%, and ADRs may adjust down to $346.
- Understanding both the seasonal averages and these monthly peaks and troughs in revenue, occupancy, and ADR is crucial for maximizing your Airbnb profit potential in Indian Beach.
Seasonal Strategies for Maximizing Profit
- Peak Season: Maximize revenue through premium pricing and potentially longer minimum stays. Ensure high availability.
- Low Season: Offer competitive pricing, special promotions (e.g., extended stay discounts), and flexible cancellation policies. Target off-season travelers like remote workers or budget-conscious guests.
- Shoulder Seasons: Implement dynamic pricing that balances peak and low rates. Target weekend travelers or specific events. Offer slightly more flexible terms than peak season.
- Regularly analyze your own performance against these Indian Beach seasonality benchmarks and adjust your pricing and availability strategy accordingly.
Best Areas for Airbnb Investment in Indian Beach (2026)
Exploring the top neighborhoods for short-term rentals in Indian Beach? This section highlights key areas, outlining why they are attractive for hosts and guests, along with notable local attractions. Consider these locations based on your target guest profile and investment strategy.
| Neighborhood / Area | Why Host Here? (Target Guests & Appeal) | Key Attractions & Landmarks |
|---|---|---|
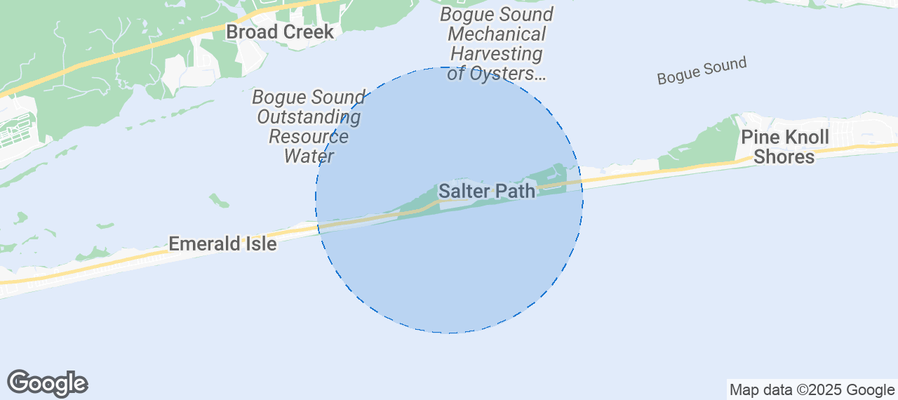
| Indian Beach | A serene coastal town offering beautiful beaches, a relaxing atmosphere, and proximity to Emerald Isle attractions. Ideal for families and couples seeking a getaway. | Beaches, Water sports, Bogue Banks, Fort Macon State Park, Crystal Coast |
| Emerald Isle | Known for its stunning beaches and family-friendly environment, Emerald Isle attracts vacationers looking for outdoor activities and relaxation. | Emerald Isle Woods Park, Bogue Inlet Fishing Pier, Salty Pirate Water Park, Local restaurants and shops |
| Atlantic Beach | A popular beach destination with a lively boardwalk atmosphere and numerous beach activities. Great for tourists looking for entertainment and outdoor fun. | Atlantic Beach Boardwalk, Fort Macon State Park, Carteret County Aquarium, Water sports opportunities |
| Cape Carteret | A quiet, residential area that provides easy access to the beautiful Crystal Coast beaches and outdoor adventures, perfect for nature lovers. | Star Hill Golf Club, Emerald Isle Woods Park, Bogue Sound |
| Morehead City | A charming waterfront town known for its nautical heritage, offering dining, shopping, and coastal activities. Attractive for visitors and locals alike. | Morehead City Downtown, Beaufort Historic Site, Carteret Community Theatre, Local seafood restaurants |
| Beaufort | Historic town with rich maritime history and picturesque waterfront views. A favorite for visitors interested in culture and outdoor activities. | Beaufort Historic Site, North Carolina Maritime Museum, Shackleford Banks, Water tours |
| Swansboro | A quaint, charming town with a vibrant arts community and beautiful waterfront. Ideal for tourists seeking a relaxed environment with unique shops. | Historic Swansboro, Waterloo Village, Swansboro Boat Ramp, Arts and crafts festivals |
| Pine Knoll Shores | A peaceful beach town known for its family-oriented activities and nature reserves. Attractive to families and nature enthusiasts. | North Carolina Aquarium at Pine Knoll Shores, Crystal Coast Country Club, Beaches and nature trails |
Understanding Airbnb License Requirements & STR Laws in Indian Beach (2026)
While Indian Beach, North Carolina, United States currently shows low STR regulations, specific Airbnb license requirements might still exist or change. Always verify the latest short term rental regulations and Airbnb license requirements directly with local government authorities for Indian Beach to ensure full compliance before hosting.
(Source: AirROI data, 2026, finding no licensed listings among those analyzed)
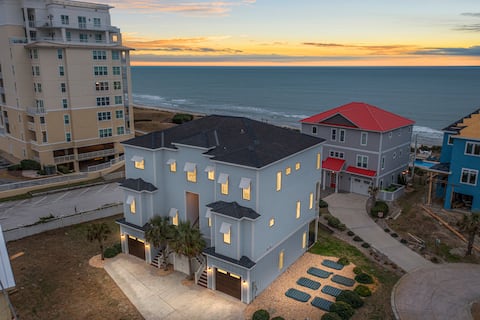
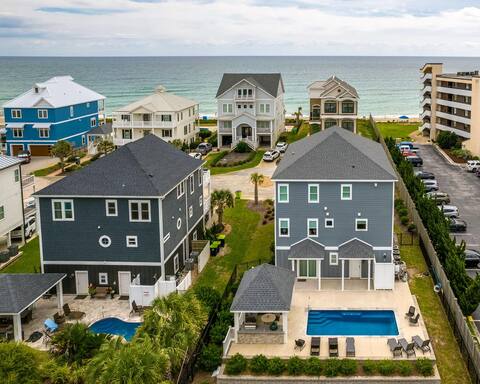
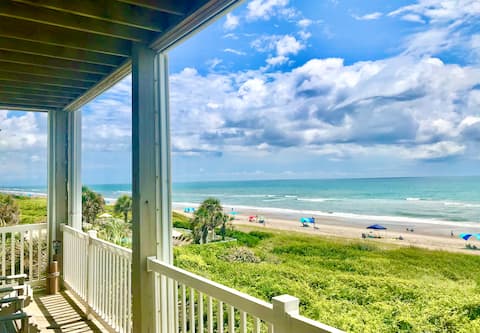
Top Performing Airbnb Properties in Indian Beach (2026)
Benchmark your potential! Explore examples of top-performing Airbnb properties in Indian Beachbased on Trailing Twelve Month (TTM) revenue. Analyze their characteristics, revenue, occupancy rate, and ADR to understand what drives success in this market.
The Ocean Pearl - A Waterfront Beach Retreat
Entire Place • 7 bedrooms
Three Buoys - Oceanview with Private Pool
Entire Place • 4 bedrooms
"Sea La Vie" Direct Oceanfront @ Ocean Club
Entire Place • 3 bedrooms
"Sea-rinity" Oceanfront retreat
Entire Place • 3 bedrooms
Oceanfront 3br summer winds heated pool w. linens
Entire Place • 3 bedrooms

Summer by the Sea-Oceanfront/Pool/sleeps 10/Hottub
Entire Place • 4 bedrooms
Note: Performance varies based on location, size, amenities, seasonality, and management quality. Data reflects the past 12 months.
Top Performing Airbnb Hosts in Indian Beach (2026)
Learn from the best! This table showcases top-performing Airbnb hosts in Indian Beach based on the number of properties managed and estimated total revenue over the past year. Analyze their scale and performance metrics.
| Host Name | Properties | Grossing Revenue | Stay Reviews | Avg Rating |
|---|---|---|---|---|
| Arianna | 1 | $185,721 | 21 | 4.90/5.0 |
| At Waves Edge Vacation Rentals | 2 | $126,225 | 11 | 4.60/5.0 |
| Abhishek | 2 | $80,914 | 57 | 4.97/5.0 |
| Josh | 1 | $70,683 | 50 | 4.86/5.0 |
| Elena | 1 | $48,078 | 26 | 5.00/5.0 |
| Stacy | 1 | $46,084 | 6 | 4.83/5.0 |
| Evolve | 1 | $38,164 | 29 | 4.83/5.0 |
| Katie | 1 | $38,161 | 51 | 4.94/5.0 |
| Tammy And Chris | 1 | $37,687 | 2 | Not Rated |
| Teresa | 1 | $36,964 | 7 | 4.86/5.0 |
Analyzing the strategies of top hosts, such as their property selection, pricing, and guest communication, can offer valuable lessons for optimizing your own Airbnb operations in Indian Beach.
Dive Deeper: Advanced Indian Beach STR Market Data (2026)
Ready to unlock more insights? AirROI provides access to advanced metrics and comprehensive Airbnb data for Indian Beach. Explore detailed analytics beyond this report to refine your investment strategy, optimize pricing, and maximize your vacation rental profits.
Explore Advanced MetricsIndian Beach Short-Term Rental Market Composition (2026): Property & Room Types
Room Type Distribution
Property Type Distribution
Market Composition Insights for Indian Beach
- The Indian Beach Airbnb market composition is heavily skewed towards Entire Home/Apt listings, which make up 100% of the 21 active rentals. This indicates strong guest preference for privacy and space.
- Looking at the property type distribution in Indian Beach, Apartment/Condo properties are the most common (90.5%), reflecting the local real estate landscape.
Indian Beach Airbnb Room Capacity Analysis (2026): Bedroom Distribution
Distribution of Listings by Number of Bedrooms
Room Capacity Insights for Indian Beach
- The dominant room capacity in Indian Beach is 3 bedrooms listings, making up 66.7% of the market. This suggests a strong demand for properties suitable for families or small groups.
- Together, 3 bedrooms and 2 bedrooms properties represent 85.7% of the active Airbnb listings in Indian Beach, indicating a high concentration in these sizes.
- A significant 81.0% of listings offer 3+ bedrooms, catering to larger groups and families seeking more space in Indian Beach.
Indian Beach Vacation Rental Guest Capacity Trends (2026)
Distribution of Listings by Guest Capacity
Guest Capacity Insights for Indian Beach
- The most common guest capacity trend in Indian Beach vacation rentals is listings accommodating 8+ guests (66.7%). This suggests the primary traveler segment is likely larger groups.
- Properties designed for 8+ guests and 6 guests dominate the Indian Beach STR market, accounting for 95.3% of listings.
- 95.3% of properties accommodate 6+ guests, serving the market segment for larger families or group travel in Indian Beach.
- On average, properties in Indian Beach are equipped to host 7.2 guests.
Indian Beach Airbnb Booking Patterns (2026): Available vs. Booked Days
Available Days Distribution
Booked Days Distribution
Booking Pattern Insights for Indian Beach
- The most common availability pattern in Indian Beach falls within the 271-366 days range, representing 57.1% of listings. This suggests many properties have significant open periods on their calendars.
- Approximately 90.4% of listings show high availability (181+ days open annually), indicating potential for increased bookings or specific owner usage patterns.
- For booked days, the 31-90 days range is most frequent in Indian Beach (38.1%), reflecting common guest stay durations or potential owner blocking patterns.
- A notable 9.5% of properties secure long booking periods (181+ days booked per year), highlighting successful long-term rental strategies or significant owner usage.
Indian Beach Airbnb Minimum Stay Requirements Analysis
Distribution of Listings by Minimum Night Requirement
2 Nights
4 listings
19% of total
4-6 Nights
1 listings
4.8% of total
30+ Nights
16 listings
76.2% of total
Key Insights
- The most prevalent minimum stay requirement in Indian Beach is 30+ Nights, adopted by 76.2% of listings. This highlights the market's preference for longer commitments.
- Very short stays (1-2 nights) are less common (19.0%), suggesting hosts prefer slightly longer bookings to optimize turnover.
- A significant segment (76.2%) caters to monthly stays (30+ nights) in Indian Beach, pointing to opportunities in the extended-stay market.
Recommendations
- Align with the market by considering a 30+ Nights minimum stay, as 76.2% of Indian Beach hosts use this setting.
- Explore offering discounts for stays of 30+ nights to attract the 76.2% of the market seeking extended stays.
- Adjust minimum nights based on seasonality – potentially shorter during low season and longer during peak demand periods in Indian Beach.
Indian Beach Airbnb Cancellation Policy Trends Analysis (2026)
Super Strict 60 Days
1 listings
4.8% of total
Firm
14 listings
66.7% of total
Strict
6 listings
28.6% of total
Cancellation Policy Insights for Indian Beach
- The prevailing Airbnb cancellation policy trend in Indian Beach is Firm, used by 66.7% of listings.
- A majority (95.3%) of hosts in Indian Beach utilize Firm or Strict policies, indicating a market where hosts prioritize booking security.
Recommendations for Hosts
- Consider adopting a Firm policy to align with the 66.7% market standard in Indian Beach.
- Regularly review your cancellation policy against competitors and market demand shifts in Indian Beach.
Indian Beach STR Booking Lead Time Analysis (2026)
Average Booking Lead Time by Month
Booking Lead Time Insights for Indian Beach
- The overall average booking lead time for vacation rentals in Indian Beach is 54 days.
- Guests book furthest in advance for stays during June (average 87 days), likely coinciding with peak travel demand or local events.
- The shortest booking windows occur for stays in February (average 20 days), indicating more last-minute travel plans during this time.
- Seasonally, Summer (76 days avg.) sees the longest lead times, while Winter (24 days avg.) has the shortest, reflecting typical travel planning cycles.
Recommendations for Hosts
- Use the overall average lead time (54 days) as a baseline for your pricing and availability strategy in Indian Beach.
- For June stays, consider implementing length-of-stay discounts or slightly higher rates for bookings made less than 87 days out to capitalize on advance planning.
- Target marketing efforts for the Summer season well in advance (at least 76 days) to capture early planners.
- Monitor your own booking lead times against these Indian Beach averages to identify opportunities for dynamic pricing adjustments.
Popular & Essential Airbnb Amenities in Indian Beach (2026)
Amenity Prevalence
Amenity Insights for Indian Beach
- Essential amenities in Indian Beach that guests expect include: Kitchen, Smoke alarm, Washer, Air conditioning, TV, Wifi, Fire extinguisher, Free parking on premises, Pool. Lacking these (any) could significantly impact bookings.
- Popular amenities like Coffee maker are common but not universal. Offering these can provide a competitive edge.
Recommendations for Hosts
- Ensure your listing includes all essential amenities for Indian Beach: Kitchen, Smoke alarm, Washer, Air conditioning, TV, Wifi, Fire extinguisher, Free parking on premises, Pool.
- Prioritize adding missing essentials: Fire extinguisher, Free parking on premises, Pool.
- Consider adding popular differentiators like Coffee maker to increase appeal.
- Highlight unique or less common amenities you offer (e.g., hot tub, dedicated workspace, EV charger) in your listing description and photos.
- Regularly check competitor amenities in Indian Beach to stay competitive.
Indian Beach Airbnb Guest Demographics & Profile Analysis (2026)
Guest Profile Summary for Indian Beach
- The typical guest profile for Airbnb in Indian Beach consists of primarily domestic travelers (99%), often arriving from nearby Raleigh, typically belonging to the Post-2000s (Gen Z/Alpha) group (50%), primarily speaking English or Spanish.
- Domestic travelers account for 98.7% of guests.
- Key international markets include United States (98.7%) and Germany (1.3%).
- Top languages spoken are English (66.7%) followed by Spanish (27.3%).
- A significant demographic segment is the Post-2000s (Gen Z/Alpha) group, representing 50% of guests.
Recommendations for Hosts
- Target domestic marketing efforts towards travelers from Raleigh and Charlotte.
- Tailor amenities and listing descriptions to appeal to the dominant Post-2000s (Gen Z/Alpha) demographic (e.g., highlight fast WiFi, smart home features, local guides).
- Highlight unique local experiences or amenities relevant to the primary guest profile.
- Consider seasonal promotions aligned with peak travel times for key origin markets.
Nearby Short-Term Rental Market Comparison
How does the Indian Beach Airbnb market stack up against its neighbors? Compare key performance metrics like average monthly revenue, ADR, and occupancy rates in surrounding areas to understand the broader regional STR landscape.
| Market | Active Properties | Monthly Revenue | Daily Rate | Avg. Occupancy |
|---|---|---|---|---|
| Wrightsville Beach | 497 | $4,620 | $531.11 | 39% |
| Salvo | 86 | $4,421 | $483.32 | 41% |
| Nags Head | 835 | $4,193 | $436.54 | 42% |
| Bald Head Island | 207 | $4,127 | $601.50 | 33% |
| Rodanthe | 150 | $4,053 | $422.32 | 39% |
| Kure Beach | 502 | $3,804 | $427.64 | 42% |
| Cedar Point | 30 | $3,725 | $310.88 | 49% |
| Emerald Isle | 510 | $3,693 | $392.93 | 42% |
| North Topsail Beach | 946 | $3,533 | $428.67 | 39% |
| Surf City | 737 | $3,518 | $389.38 | 39% |