Warrenton Airbnb Market Analysis 2025: Short Term Rental Data & Vacation Rental Statistics in North Carolina, United States
Is Airbnb profitable in Warrenton in 2025? Explore comprehensive Airbnb analytics for Warrenton, North Carolina, United States to uncover income potential. This 2025 STR market report for Warrenton, based on AirROI data from May 2024 to April 2025, reveals key trends in the niche market of 18 active listings.
Whether you're considering an Airbnb investment in Warrenton, optimizing your existing vacation rental, or exploring rental arbitrage opportunities, understanding the Warrenton Airbnb data is crucial. Leveraging the low regulation environment is key to maximizing your short term rental income potential. Let's dive into the specifics.
Key Warrenton Airbnb Performance Metrics Overview
Monthly Airbnb Revenue Variations & Income Potential in Warrenton (2025)
Understanding the monthly revenue variations for Airbnb listings in Warrenton is key to maximizing your short term rental income potential. Seasonality significantly impacts earnings. Our analysis, based on data from the past 12 months, shows that the peak revenue month for STRs in Warrenton is typically June, while December often presents the lowest earnings, highlighting opportunities for strategic pricing adjustments during shoulder and low seasons. Explore the typical Airbnb income in Warrenton across different performance tiers:
- Best-in-class properties (Top 10%) achieve $2,891+ monthly, often utilizing dynamic pricing and superior guest experiences.
- Strong performing properties (Top 25%) earn $1,953 or more, indicating effective management and desirable locations/amenities.
- Typical properties (Median) generate around $1,139 per month, representing the average market performance.
- Entry-level properties (Bottom 25%) see earnings around $681, often with potential for optimization.
Average Monthly Airbnb Earnings Trend in Warrenton
Warrenton Airbnb Occupancy Rate Trends (2025)
Maximize your bookings by understanding the Warrenton STR occupancy trends. Seasonal demand shifts significantly influence how often properties are booked. Typically, Julysees the highest demand (peak season occupancy), while January experiences the lowest (low season). Effective strategies, like adjusting minimum stays or offering promotions, can boost occupancy during slower periods. Here's how different property tiers perform in Warrenton:
- Best-in-class properties (Top 10%) achieve 66%+ occupancy, indicating high desirability and potentially optimized availability.
- Strong performing properties (Top 25%) maintain 47% or higher occupancy, suggesting good market fit and guest satisfaction.
- Typical properties (Median) have an occupancy rate around 28%.
- Entry-level properties (Bottom 25%) average 15% occupancy, potentially facing higher vacancy.
Average Monthly Occupancy Rate Trend in Warrenton
Average Daily Rate (ADR) Airbnb Trends in Warrenton (2025)
Effective short term rental pricing strategy in Warrenton involves understanding monthly ADR fluctuations. The Average Daily Rate (ADR) for Airbnb in Warrenton typically peaks in November and dips lowest during December. Leveraging Airbnb dynamic pricing tools or strategies based on this seasonality can significantly boost revenue. Here's a look at the typical nightly rates achieved:
- Best-in-class properties (Top 10%) command rates of $171+ per night, often due to premium features or locations.
- Strong performing properties (Top 25%) achieve nightly rates of $153 or more.
- Typical properties (Median) charge around $131 per night.
- Entry-level properties (Bottom 25%) earn around $99 per night.
Average Daily Rate (ADR) Trend by Month in Warrenton
Get Live Warrenton Market Intelligence 👇

Explore Real-time Analytics
Airbnb Seasonality Analysis & Trends in Warrenton (2025)
Peak Season (June, May, March)
- Revenue averages $1,881 per month
- Occupancy rates average 35.4%
- Daily rates average $162
Shoulder Season
- Revenue averages $1,527 per month
- Occupancy maintains around 35.3%
- Daily rates hold near $163
Low Season (January, November, December)
- Revenue drops to average $1,255 per month
- Occupancy decreases to average 27.2%
- Daily rates adjust to average $146
Seasonality Insights for Warrenton
- The Airbnb seasonality in Warrenton shows moderate seasonality with distinct peak and low periods. While the sections above show seasonal averages, it's also insightful to look at the extremes:
- During the high season, the absolute peak month showcases Warrenton's highest earning potential, with monthly revenues capable of climbing to $2,026, occupancy reaching a high of 42.8%, and ADRs peaking at $182.
- Conversely, the slowest single month of the year, typically falling within the low season, marks the market's lowest point. In this month, revenue might dip to $1,193, occupancy could drop to 16.8%, and ADRs may adjust down to $127.
- Understanding both the seasonal averages and these monthly peaks and troughs in revenue, occupancy, and ADR is crucial for maximizing your Airbnb profit potential in Warrenton.
Seasonal Strategies for Maximizing Profit
- Peak Season: Maximize revenue through premium pricing and potentially longer minimum stays. Ensure high availability.
- Low Season: Offer competitive pricing, special promotions (e.g., extended stay discounts), and flexible cancellation policies. Target off-season travelers like remote workers or budget-conscious guests.
- Shoulder Seasons: Implement dynamic pricing that balances peak and low rates. Target weekend travelers or specific events. Offer slightly more flexible terms than peak season.
- Regularly analyze your own performance against these Warrenton seasonality benchmarks and adjust your pricing and availability strategy accordingly.
Best Areas for Airbnb Investment in Warrenton (2025)
Exploring the top neighborhoods for short-term rentals in Warrenton? This section highlights key areas, outlining why they are attractive for hosts and guests, along with notable local attractions. Consider these locations based on your target guest profile and investment strategy.
| Neighborhood / Area | Why Host Here? (Target Guests & Appeal) | Key Attractions & Landmarks |
|---|---|---|
| Historic Downtown Warrenton | Charming area with 19th-century architecture, local shops, and restaurants. Attracts visitors interested in history and culture, making it ideal for Airbnb stays. | Warrenton Historic District, Warren County Courthouse, Cherry Hill, local boutiques and cafes |
| Lake Gaston | Beautiful lakefront area offering recreational activities such as boating and fishing. Popular among families and nature lovers looking for a tranquil getaway. | Lake Gaston, North Bend Park, countless fishing spots, water sports |
| Kerr Lake | Large reservoir with plenty of waterfront accommodations. Perfect for those looking for water-based activities and camping experiences. | Kerr Lake State Recreation Area, boat ramps and beaches, fishing and hiking opportunities |
| Warrenton's Antique District | Known for its antique shops and vintage finds. Attracts collectors and antique enthusiasts seeking unique items. | Antique shops, local art galleries, craft fairs, historic homes |
| Pine Grove | Lovely residential area surrounded by nature. Offers a peaceful environment for travelers looking for a relaxing stay. | nature trails, parks, community events |
| Warrenton's Farmers Market | Vibrant market held regularly featuring local produce and handmade crafts. Draws in visitors looking for a local experience. | fresh produce, handcrafted goods, live music |
| Mariah's site | Historical site with natural beauty. Ideal for those interested in local history and outdoor activities. | historical markers, scenic views, hiking trails |
| West Warrenton | Growing area with modern conveniences and close to schools and parks. Perfect for families visiting the area. | community parks, local eateries, children's activities |
Understanding Airbnb License Requirements & STR Laws in Warrenton (2025)
While Warrenton, North Carolina, United States currently shows low STR regulations, specific Airbnb license requirements might still exist or change. Always verify the latest short term rental regulations and Airbnb license requirements directly with local government authorities for Warrenton to ensure full compliance before hosting.
(Source: AirROI data, 2025, finding no licensed listings among those analyzed)
Top Performing Airbnb Properties in Warrenton (2025)
Benchmark your potential! Explore examples of top-performing Airbnb properties in Warrentonbased on Trailing Twelve Month (TTM) revenue. Analyze their characteristics, revenue, occupancy rate, and ADR to understand what drives success in this market.
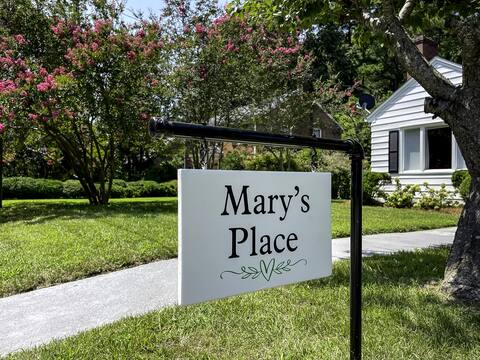
Mary's Place ❤ Bright 3BR with deck/private yard
Entire Place • 3 bedrooms
Historic Warrenton Loft Villa
Entire Place • 2 bedrooms

The Peete House and Garden- Entire House
Entire Place • 5 bedrooms
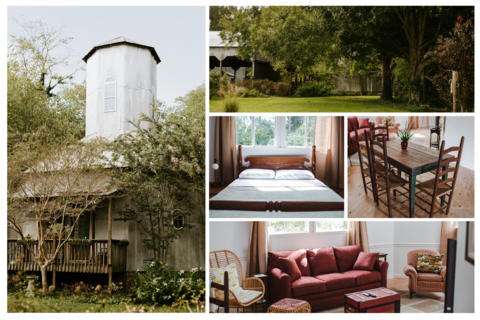
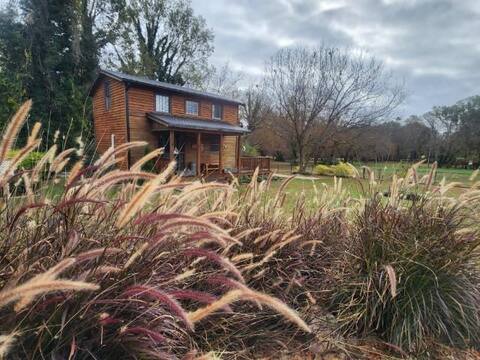
The Seed House: Octagonal Barn, Dog-Friendly!
Entire Place • 2 bedrooms
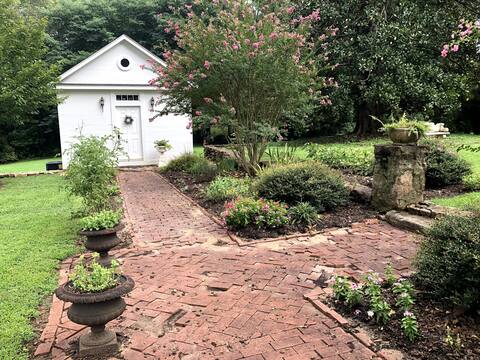
Tucker Cottage Guest House
Entire Place • 1 bedroom

Adorable Garden Loft - Downtown Warrenton
Entire Place • 1 bedroom
Note: Performance varies based on location, size, amenities, seasonality, and management quality. Data reflects the past 12 months.
Top Performing Airbnb Hosts in Warrenton (2025)
Learn from the best! This table showcases top-performing Airbnb hosts in Warrenton based on the number of properties managed and estimated total revenue over the past year. Analyze their scale and performance metrics.
| Host Name | Properties | Grossing Revenue | Stay Reviews | Avg Rating |
|---|---|---|---|---|
| Michael | 2 | $35,356 | 257 | 4.98/5.0 |
| Scott | 1 | $30,844 | 81 | 5.00/5.0 |
| Michael | 3 | $30,757 | 467 | 4.90/5.0 |
| Evelyn Baez | 1 | $27,395 | 84 | 5.00/5.0 |
| Trish | 3 | $25,212 | 264 | 4.91/5.0 |
| Scott | 1 | $22,507 | 172 | 4.98/5.0 |
| Victoria | 1 | $15,851 | 471 | 4.91/5.0 |
| Monica | 1 | $15,612 | 22 | 4.86/5.0 |
| Host #96227619 | 1 | $8,282 | 9 | 5.00/5.0 |
| Host #62926961 | 1 | $5,899 | 0 | 0.00/5.0 |
Analyzing the strategies of top hosts, such as their property selection, pricing, and guest communication, can offer valuable lessons for optimizing your own Airbnb operations in Warrenton.
Dive Deeper: Advanced Warrenton STR Market Data (2025)
Ready to unlock more insights? AirROI provides access to advanced metrics and comprehensive Airbnb data for Warrenton. Explore detailed analytics beyond this report to refine your investment strategy, optimize pricing, and maximize your vacation rental profits.
Explore Advanced MetricsWarrenton Short-Term Rental Market Composition (2025): Property & Room Types
Room Type Distribution
Property Type Distribution
Market Composition Insights for Warrenton
- The Warrenton Airbnb market composition is heavily skewed towards Entire Home/Apt listings, which make up 77.8% of the 18 active rentals. This indicates strong guest preference for privacy and space.
- Looking at the property type distribution in Warrenton, House properties are the most common (44.4%), reflecting the local real estate landscape.
- Houses represent a significant 44.4% portion, catering likely to families or larger groups.
- The presence of 27.8% Hotel/Boutique listings indicates integration with traditional hospitality.
Warrenton Airbnb Room Capacity Analysis (2025): Bedroom Distribution
Distribution of Listings by Number of Bedrooms
Room Capacity Insights for Warrenton
- The dominant room capacity in Warrenton is 1 bedroom listings, making up 44.4% of the market. This suggests a strong demand for properties suitable for couples or solo travelers.
- Together, 1 bedroom and 2 bedrooms properties represent 66.6% of the active Airbnb listings in Warrenton, indicating a high concentration in these sizes.
Warrenton Vacation Rental Guest Capacity Trends (2025)
Distribution of Listings by Guest Capacity
Guest Capacity Insights for Warrenton
- The most common guest capacity trend in Warrenton vacation rentals is listings accommodating 2 guests (44.4%). This suggests the primary traveler segment is likely couples or solo travelers.
- Properties designed for 2 guests and 4 guests dominate the Warrenton STR market, accounting for 61.1% of listings.
- A significant 44.4% of listings cater specifically to 1-2 guests, highlighting strong demand from couples and solo travelers in Warrenton.
- 16.7% of properties accommodate 6+ guests, serving the market segment for larger families or group travel in Warrenton.
- On average, properties in Warrenton are equipped to host 3.4 guests.
Warrenton Airbnb Booking Patterns (2025): Available vs. Booked Days
Available Days Distribution
Booked Days Distribution
Booking Pattern Insights for Warrenton
- The most common availability pattern in Warrenton falls within the 271-366 days range, representing 61.1% of listings. This suggests many properties have significant open periods on their calendars.
- Approximately 83.3% of listings show high availability (181+ days open annually), indicating potential for increased bookings or specific owner usage patterns.
- For booked days, the 31-90 days range is most frequent in Warrenton (38.9%), reflecting common guest stay durations or potential owner blocking patterns.
- A notable 16.7% of properties secure long booking periods (181+ days booked per year), highlighting successful long-term rental strategies or significant owner usage.
Warrenton Airbnb Minimum Stay Requirements Analysis
Distribution of Listings by Minimum Night Requirement
1 Night
8 listings
57.1% of total
2 Nights
6 listings
42.9% of total
Key Insights
- The most prevalent minimum stay requirement in Warrenton is 1 Night, adopted by 57.1% of listings. This highlights the market's preference for shorter, flexible bookings.
- A strong majority (100.0%) of the Warrenton Airbnb data shows acceptance of very short stays (1-2 nights), indicating a dynamic, high-turnover market.
Recommendations
- Align with the market by considering a 1 Night minimum stay, as 57.1% of Warrenton hosts use this setting.
- Adjust minimum nights based on seasonality – potentially shorter during low season and longer during peak demand periods in Warrenton.
Warrenton Airbnb Cancellation Policy Trends Analysis (2025)
Flexible
5 listings
31.3% of total
Moderate
4 listings
25% of total
Firm
4 listings
25% of total
Strict
3 listings
18.8% of total
Cancellation Policy Insights for Warrenton
- The prevailing Airbnb cancellation policy trend in Warrenton is Flexible, used by 31.3% of listings.
- There's a relatively balanced mix between guest-friendly (56.3%) and stricter (43.8%) policies, offering choices for different guest needs.
Recommendations for Hosts
- Consider adopting a Flexible policy to align with the 31.3% market standard in Warrenton.
- Regularly review your cancellation policy against competitors and market demand shifts in Warrenton.
Warrenton STR Booking Lead Time Analysis (2025)
Average Booking Lead Time by Month
Booking Lead Time Insights for Warrenton
- The overall average booking lead time for vacation rentals in Warrenton is 46 days.
- Guests book furthest in advance for stays during June (average 71 days), likely coinciding with peak travel demand or local events.
- The shortest booking windows occur for stays in October (average 20 days), indicating more last-minute travel plans during this time.
- Seasonally, Spring (51 days avg.) sees the longest lead times, while Winter (26 days avg.) has the shortest, reflecting typical travel planning cycles.
Recommendations for Hosts
- Use the overall average lead time (46 days) as a baseline for your pricing and availability strategy in Warrenton.
- For June stays, consider implementing length-of-stay discounts or slightly higher rates for bookings made less than 71 days out to capitalize on advance planning.
- Target marketing efforts for the Spring season well in advance (at least 51 days) to capture early planners.
- Monitor your own booking lead times against these Warrenton averages to identify opportunities for dynamic pricing adjustments.
Popular & Essential Airbnb Amenities in Warrenton (2025)
Amenity Prevalence
Amenity Insights for Warrenton
- Essential amenities in Warrenton that guests expect include: Heating, Hair dryer, Air conditioning, Smoke alarm, Hot water, Hangers, TV, Essentials. Lacking these (any) could significantly impact bookings.
- Popular amenities like Shampoo, Free parking on premises are common but not universal. Offering these can provide a competitive edge.
Recommendations for Hosts
- Ensure your listing includes all essential amenities for Warrenton: Heating, Hair dryer, Air conditioning, Smoke alarm, Hot water, Hangers, TV, Essentials.
- Consider adding popular differentiators like Shampoo or Free parking on premises to increase appeal.
- Highlight unique or less common amenities you offer (e.g., hot tub, dedicated workspace, EV charger) in your listing description and photos.
- Regularly check competitor amenities in Warrenton to stay competitive.
Warrenton Airbnb Guest Demographics & Profile Analysis (2025)
Guest Profile Summary for Warrenton
- The typical guest profile for Airbnb in Warrenton consists of primarily domestic travelers (96%), often arriving from nearby Wilmington, typically belonging to the Post-2000s (Gen Z/Alpha) group (50%), primarily speaking English or Spanish.
- Domestic travelers account for 96.1% of guests.
- Key international markets include United States (96.1%) and DC (2.4%).
- Top languages spoken are English (75.4%) followed by Spanish (10.7%).
- A significant demographic segment is the Post-2000s (Gen Z/Alpha) group, representing 50% of guests.
Recommendations for Hosts
- Target domestic marketing efforts towards travelers from Wilmington and New York.
- Tailor amenities and listing descriptions to appeal to the dominant Post-2000s (Gen Z/Alpha) demographic (e.g., highlight fast WiFi, smart home features, local guides).
- Highlight unique local experiences or amenities relevant to the primary guest profile.
- Consider seasonal promotions aligned with peak travel times for key origin markets.
Nearby Short-Term Rental Market Comparison
How does the Warrenton Airbnb market stack up against its neighbors? Compare key performance metrics like average monthly revenue, ADR, and occupancy rates in surrounding areas to understand the broader regional STR landscape.
| Market | Active Properties | Monthly Revenue | Daily Rate | Avg. Occupancy |
|---|---|---|---|---|
| Whispering Pines | 18 | $7,711 | $1102.15 | 37% |
| Penhook | 18 | $5,807 | $570.97 | 39% |
| Littleton | 100 | $5,004 | $441.14 | 44% |
| Nellysford | 63 | $4,756 | $381.95 | 37% |
| Macon | 37 | $4,612 | $482.77 | 37% |
| Wintergreen Resort | 46 | $4,513 | $335.61 | 43% |
| Goodview | 23 | $4,512 | $360.70 | 53% |
| Rockbridge Baths | 11 | $4,428 | $289.25 | 45% |
| Afton | 137 | $4,401 | $332.65 | 40% |
| Henrico | 70 | $4,290 | $423.29 | 40% |