Woodstock Airbnb Market Analysis 2025: Short Term Rental Data & Vacation Rental Statistics in Northeastern Connecticut Planning Region, United States
Is Airbnb profitable in Woodstock in 2025? Explore comprehensive Airbnb analytics for Woodstock, Northeastern Connecticut Planning Region, United States to uncover income potential. This 2025 STR market report for Woodstock, based on AirROI data from May 2024 to April 2025, reveals key trends in the niche market of 17 active listings.
Whether you're considering an Airbnb investment in Woodstock, optimizing your existing vacation rental, or exploring rental arbitrage opportunities, understanding the Woodstock Airbnb data is crucial. Leveraging the low regulation environment is key to maximizing your short term rental income potential. Let's dive into the specifics.
Key Woodstock Airbnb Performance Metrics Overview
Monthly Airbnb Revenue Variations & Income Potential in Woodstock (2025)
Understanding the monthly revenue variations for Airbnb listings in Woodstock is key to maximizing your short term rental income potential. Seasonality significantly impacts earnings. Our analysis, based on data from the past 12 months, shows that the peak revenue month for STRs in Woodstock is typically July, while January often presents the lowest earnings, highlighting opportunities for strategic pricing adjustments during shoulder and low seasons. Explore the typical Airbnb income in Woodstock across different performance tiers:
- Best-in-class properties (Top 10%) achieve $8,539+ monthly, often utilizing dynamic pricing and superior guest experiences.
- Strong performing properties (Top 25%) earn $5,093 or more, indicating effective management and desirable locations/amenities.
- Typical properties (Median) generate around $2,525 per month, representing the average market performance.
- Entry-level properties (Bottom 25%) see earnings around $1,548, often with potential for optimization.
Average Monthly Airbnb Earnings Trend in Woodstock
Woodstock Airbnb Occupancy Rate Trends (2025)
Maximize your bookings by understanding the Woodstock STR occupancy trends. Seasonal demand shifts significantly influence how often properties are booked. Typically, Augustsees the highest demand (peak season occupancy), while January experiences the lowest (low season). Effective strategies, like adjusting minimum stays or offering promotions, can boost occupancy during slower periods. Here's how different property tiers perform in Woodstock:
- Best-in-class properties (Top 10%) achieve 67%+ occupancy, indicating high desirability and potentially optimized availability.
- Strong performing properties (Top 25%) maintain 54% or higher occupancy, suggesting good market fit and guest satisfaction.
- Typical properties (Median) have an occupancy rate around 38%.
- Entry-level properties (Bottom 25%) average 21% occupancy, potentially facing higher vacancy.
Average Monthly Occupancy Rate Trend in Woodstock
Average Daily Rate (ADR) Airbnb Trends in Woodstock (2025)
Effective short term rental pricing strategy in Woodstock involves understanding monthly ADR fluctuations. The Average Daily Rate (ADR) for Airbnb in Woodstock typically peaks in December and dips lowest during November. Leveraging Airbnb dynamic pricing tools or strategies based on this seasonality can significantly boost revenue. Here's a look at the typical nightly rates achieved:
- Best-in-class properties (Top 10%) command rates of $571+ per night, often due to premium features or locations.
- Strong performing properties (Top 25%) achieve nightly rates of $384 or more.
- Typical properties (Median) charge around $228 per night.
- Entry-level properties (Bottom 25%) earn around $132 per night.
Average Daily Rate (ADR) Trend by Month in Woodstock
Get Live Woodstock Market Intelligence 👇

Explore Real-time Analytics
Airbnb Seasonality Analysis & Trends in Woodstock (2025)
Peak Season (July, August, September)
- Revenue averages $6,521 per month
- Occupancy rates average 61.4%
- Daily rates average $328
Shoulder Season
- Revenue averages $3,269 per month
- Occupancy maintains around 35.7%
- Daily rates hold near $325
Low Season (January, February, March)
- Revenue drops to average $2,070 per month
- Occupancy decreases to average 24.7%
- Daily rates adjust to average $336
Seasonality Insights for Woodstock
- The Airbnb seasonality in Woodstock shows highly seasonal trends requiring careful strategy. While the sections above show seasonal averages, it's also insightful to look at the extremes:
- During the high season, the absolute peak month showcases Woodstock's highest earning potential, with monthly revenues capable of climbing to $7,730, occupancy reaching a high of 66.8%, and ADRs peaking at $353.
- Conversely, the slowest single month of the year, typically falling within the low season, marks the market's lowest point. In this month, revenue might dip to $1,896, occupancy could drop to 20.0%, and ADRs may adjust down to $306.
- Understanding both the seasonal averages and these monthly peaks and troughs in revenue, occupancy, and ADR is crucial for maximizing your Airbnb profit potential in Woodstock.
Seasonal Strategies for Maximizing Profit
- Peak Season: Maximize revenue through premium pricing and potentially longer minimum stays. Ensure high availability.
- Low Season: Offer competitive pricing, special promotions (e.g., extended stay discounts), and flexible cancellation policies. Target off-season travelers like remote workers or budget-conscious guests.
- Shoulder Seasons: Implement dynamic pricing that balances peak and low rates. Target weekend travelers or specific events. Offer slightly more flexible terms than peak season.
- Regularly analyze your own performance against these Woodstock seasonality benchmarks and adjust your pricing and availability strategy accordingly.
Best Areas for Airbnb Investment in Woodstock (2025)
Exploring the top neighborhoods for short-term rentals in Woodstock? This section highlights key areas, outlining why they are attractive for hosts and guests, along with notable local attractions. Consider these locations based on your target guest profile and investment strategy.
| Neighborhood / Area | Why Host Here? (Target Guests & Appeal) | Key Attractions & Landmarks |
|---|---|---|
| Woodstock Village | Charming New England village with quaint shops, local cafes, and beautiful scenery. Popular for its close-knit community feel and seasonal events. | Woodstock Historical Society, Roseland Cottage, Woods Stock Art Gallery, Nature Trail at the Pomfret School, Local Farmers Market |
| Laurel Pond | Scenic area known for its beautiful lake and outdoor activities. Great for nature lovers and families looking for a peaceful retreat. | Laurel Pond, Hiking Trails, Fishing Spots, Picnic Areas, Wildlife Viewing |
| Mashamoquet Brook State Park | A natural area offering hiking, camping, and wildlife observation. Attracts outdoor enthusiasts looking for an immersive nature experience. | Hiking Trails, Camping Grounds, Picnic Areas, Laurel Hill, Wildlife Watching |
| Pomfret | Nearby community with rich history and beautiful landscapes. Offers a quieter atmosphere with close proximity to charming local attractions. | Pomfret Historical Society, Local Art Galleries, Pomfret School, Nature Trails, Farmers Markets |
| Eastford | Rural community that provides a serene setting for relaxation. Popular among visitors looking for tranquility away from city life. | Eastford Town Green, Hiking Trails, Wildlife Resevoir, Local Historic Sites |
| Putnam | Vibrant town with a growing arts scene and various festivals year-round. Attracts visitors for its cultural events and dining options. | The Bradley Playhouse, Putnam Arts Council, Main Street Shopping District, Local Restaurants, Seasonal Festivals |
| Killingly | Close-knit community offering historical attractions and local eateries. Good for visitors interested in exploring local culture. | Old Killingly Cemetery, Killingly Historical Society, Local Farms, Natural Parks |
| Pomfret Center | Scenic area known for its rural character and historical sites. Appeals to guests looking for a rural retreat with local charm. | Pomfret Center Historic District, Nature Trails, Farmers Markets, Local Events |
Understanding Airbnb License Requirements & STR Laws in Woodstock (2025)
While Woodstock, Northeastern Connecticut Planning Region, United States currently shows low STR regulations, specific Airbnb license requirements might still exist or change. Always verify the latest short term rental regulations and Airbnb license requirements directly with local government authorities for Woodstock to ensure full compliance before hosting.
(Source: AirROI data, 2025, finding no licensed listings among those analyzed)
Top Performing Airbnb Properties in Woodstock (2025)
Benchmark your potential! Explore examples of top-performing Airbnb properties in Woodstockbased on Trailing Twelve Month (TTM) revenue. Analyze their characteristics, revenue, occupancy rate, and ADR to understand what drives success in this market.
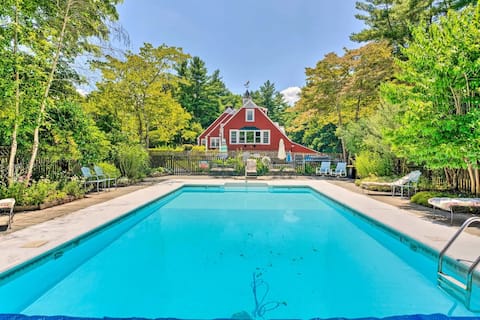
Waterfront, Pool, Lake,Resort, Fast Wi-Fi,Firepits
Entire Place • 6 bedrooms
Lakeside Paradise on 5 Acres— HotTub + Kayaks
Entire Place • 4 bedrooms

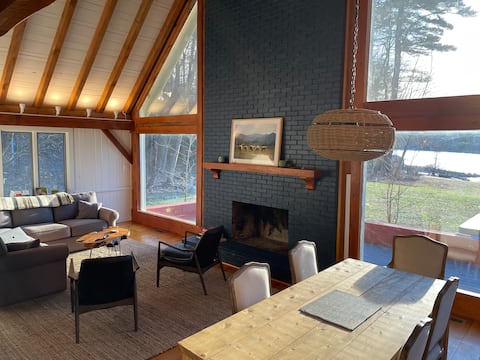
Mid-Century Modern Lakefront Cabin
Entire Place • 3 bedrooms
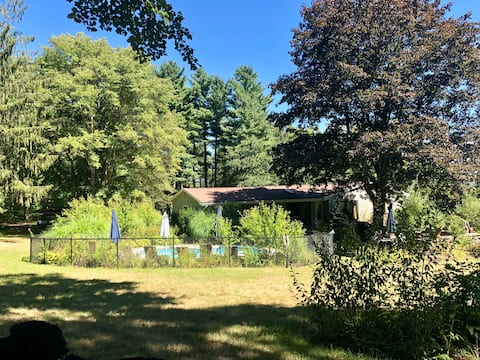
Secluded 2 Acre Lake Front Home!
Entire Place • 4 bedrooms

Lakefront Cottage Complete with Kayaks!
Entire Place • 5 bedrooms
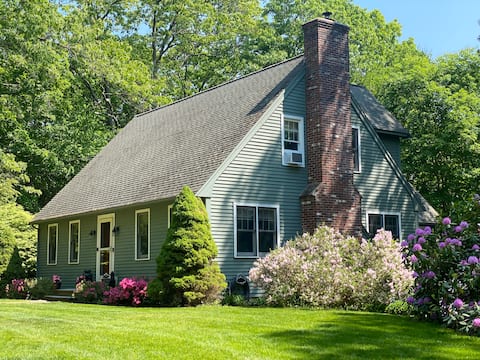
Cedar Ridge: House or House+Apartment
Entire Place • 4 bedrooms
Note: Performance varies based on location, size, amenities, seasonality, and management quality. Data reflects the past 12 months.
Top Performing Airbnb Hosts in Woodstock (2025)
Learn from the best! This table showcases top-performing Airbnb hosts in Woodstock based on the number of properties managed and estimated total revenue over the past year. Analyze their scale and performance metrics.
| Host Name | Properties | Grossing Revenue | Stay Reviews | Avg Rating |
|---|---|---|---|---|
| Heather | 2 | $102,203 | 125 | 4.89/5.0 |
| Claire | 1 | $96,791 | 68 | 4.88/5.0 |
| Jacob | 1 | $96,727 | 159 | 4.90/5.0 |
| Erin | 1 | $81,933 | 36 | 4.97/5.0 |
| Lachonta | 1 | $54,130 | 46 | 4.80/5.0 |
| Arno | 1 | $41,002 | 233 | 4.94/5.0 |
| Phyllis | 1 | $27,035 | 386 | 4.93/5.0 |
| Nicole | 1 | $25,389 | 37 | 4.92/5.0 |
| Sandeep | 1 | $21,847 | 25 | 4.88/5.0 |
| Ashley | 1 | $21,576 | 37 | 4.84/5.0 |
Analyzing the strategies of top hosts, such as their property selection, pricing, and guest communication, can offer valuable lessons for optimizing your own Airbnb operations in Woodstock.
Dive Deeper: Advanced Woodstock STR Market Data (2025)
Ready to unlock more insights? AirROI provides access to advanced metrics and comprehensive Airbnb data for Woodstock. Explore detailed analytics beyond this report to refine your investment strategy, optimize pricing, and maximize your vacation rental profits.
Explore Advanced MetricsWoodstock Short-Term Rental Market Composition (2025): Property & Room Types
Room Type Distribution
Property Type Distribution
Market Composition Insights for Woodstock
- The Woodstock Airbnb market composition is heavily skewed towards Entire Home/Apt listings, which make up 88.2% of the 17 active rentals. This indicates strong guest preference for privacy and space.
- Looking at the property type distribution in Woodstock, House properties are the most common (64.7%), reflecting the local real estate landscape.
- Houses represent a significant 64.7% portion, catering likely to families or larger groups.
- The presence of 5.9% Hotel/Boutique listings indicates integration with traditional hospitality.
Woodstock Airbnb Room Capacity Analysis (2025): Bedroom Distribution
Distribution of Listings by Number of Bedrooms
Room Capacity Insights for Woodstock
- The dominant room capacity in Woodstock is 1 bedroom listings, making up 35.3% of the market. This suggests a strong demand for properties suitable for couples or solo travelers.
- Together, 1 bedroom and 4 bedrooms properties represent 52.9% of the active Airbnb listings in Woodstock, indicating a high concentration in these sizes.
- A significant 47.0% of listings offer 3+ bedrooms, catering to larger groups and families seeking more space in Woodstock.
Woodstock Vacation Rental Guest Capacity Trends (2025)
Distribution of Listings by Guest Capacity
Guest Capacity Insights for Woodstock
- The most common guest capacity trend in Woodstock vacation rentals is listings accommodating 8+ guests (29.4%). This suggests the primary traveler segment is likely larger groups.
- Properties designed for 8+ guests and 4 guests dominate the Woodstock STR market, accounting for 52.9% of listings.
- 41.2% of properties accommodate 6+ guests, serving the market segment for larger families or group travel in Woodstock.
- On average, properties in Woodstock are equipped to host 4.9 guests.
Woodstock Airbnb Booking Patterns (2025): Available vs. Booked Days
Available Days Distribution
Booked Days Distribution
Booking Pattern Insights for Woodstock
- The most common availability pattern in Woodstock falls within the 181-270 days range, representing 64.7% of listings. This suggests many properties have significant open periods on their calendars.
- Approximately 88.2% of listings show high availability (181+ days open annually), indicating potential for increased bookings or specific owner usage patterns.
- For booked days, the 91-180 days range is most frequent in Woodstock (70.6%), reflecting common guest stay durations or potential owner blocking patterns.
- A notable 11.8% of properties secure long booking periods (181+ days booked per year), highlighting successful long-term rental strategies or significant owner usage.
Woodstock Airbnb Minimum Stay Requirements Analysis
Distribution of Listings by Minimum Night Requirement
1 Night
4 listings
23.5% of total
2 Nights
9 listings
52.9% of total
3 Nights
2 listings
11.8% of total
4-6 Nights
1 listings
5.9% of total
30+ Nights
1 listings
5.9% of total
Key Insights
- The most prevalent minimum stay requirement in Woodstock is 2 Nights, adopted by 52.9% of listings. This highlights the market's preference for shorter, flexible bookings.
- A strong majority (76.4%) of the Woodstock Airbnb data shows acceptance of very short stays (1-2 nights), indicating a dynamic, high-turnover market.
Recommendations
- Align with the market by considering a 2 Nights minimum stay, as 52.9% of Woodstock hosts use this setting.
- If feasible, allowing 1-night stays, especially midweek or during low season, could capture last-minute bookings, as only 23.5% currently do.
- Explore offering discounts for stays of 30+ nights to attract the 5.9% of the market seeking extended stays.
- Adjust minimum nights based on seasonality – potentially shorter during low season and longer during peak demand periods in Woodstock.
Woodstock Airbnb Cancellation Policy Trends Analysis (2025)
Moderate
9 listings
52.9% of total
Firm
3 listings
17.6% of total
Strict
5 listings
29.4% of total
Cancellation Policy Insights for Woodstock
- The prevailing Airbnb cancellation policy trend in Woodstock is Moderate, used by 52.9% of listings.
- There's a relatively balanced mix between guest-friendly (52.9%) and stricter (47.0%) policies, offering choices for different guest needs.
Recommendations for Hosts
- Consider adopting a Moderate policy to align with the 52.9% market standard in Woodstock.
- Regularly review your cancellation policy against competitors and market demand shifts in Woodstock.
Woodstock STR Booking Lead Time Analysis (2025)
Average Booking Lead Time by Month
Booking Lead Time Insights for Woodstock
- The overall average booking lead time for vacation rentals in Woodstock is 54 days.
- Guests book furthest in advance for stays during June (average 83 days), likely coinciding with peak travel demand or local events.
- The shortest booking windows occur for stays in January (average 12 days), indicating more last-minute travel plans during this time.
- Seasonally, Summer (68 days avg.) sees the longest lead times, while Winter (28 days avg.) has the shortest, reflecting typical travel planning cycles.
Recommendations for Hosts
- Use the overall average lead time (54 days) as a baseline for your pricing and availability strategy in Woodstock.
- For June stays, consider implementing length-of-stay discounts or slightly higher rates for bookings made less than 83 days out to capitalize on advance planning.
- During January, focus on last-minute booking availability and promotions, as guests book with very short notice (12 days avg.).
- Target marketing efforts for the Summer season well in advance (at least 68 days) to capture early planners.
- Monitor your own booking lead times against these Woodstock averages to identify opportunities for dynamic pricing adjustments.
Popular & Essential Airbnb Amenities in Woodstock (2025)
Amenity Prevalence
Amenity Insights for Woodstock
- Essential amenities in Woodstock that guests expect include: Essentials, Free parking on premises, Wifi, Heating. Lacking these (any) could significantly impact bookings.
- Popular amenities like Smoke alarm, Coffee maker, Microwave are common but not universal. Offering these can provide a competitive edge.
Recommendations for Hosts
- Ensure your listing includes all essential amenities for Woodstock: Essentials, Free parking on premises, Wifi, Heating.
- Consider adding popular differentiators like Smoke alarm or Coffee maker to increase appeal.
- Highlight unique or less common amenities you offer (e.g., hot tub, dedicated workspace, EV charger) in your listing description and photos.
- Regularly check competitor amenities in Woodstock to stay competitive.
Woodstock Airbnb Guest Demographics & Profile Analysis (2025)
Guest Profile Summary for Woodstock
- The typical guest profile for Airbnb in Woodstock consists of primarily domestic travelers (93%), often arriving from nearby New York, typically belonging to the Post-2000s (Gen Z/Alpha) group (50%), primarily speaking English or Spanish.
- Domestic travelers account for 93.3% of guests.
- Key international markets include United States (93.3%) and United Kingdom (1.6%).
- Top languages spoken are English (72.6%) followed by Spanish (7.4%).
- A significant demographic segment is the Post-2000s (Gen Z/Alpha) group, representing 50% of guests.
Recommendations for Hosts
- Target domestic marketing efforts towards travelers from New York and Boston.
- Tailor amenities and listing descriptions to appeal to the dominant Post-2000s (Gen Z/Alpha) demographic (e.g., highlight fast WiFi, smart home features, local guides).
- Highlight unique local experiences or amenities relevant to the primary guest profile.
- Consider seasonal promotions aligned with peak travel times for key origin markets.
Nearby Short-Term Rental Market Comparison
How does the Woodstock Airbnb market stack up against its neighbors? Compare key performance metrics like average monthly revenue, ADR, and occupancy rates in surrounding areas to understand the broader regional STR landscape.
| Market | Active Properties | Monthly Revenue | Daily Rate | Avg. Occupancy |
|---|---|---|---|---|
| Town of East Hampton | 1,428 | $5,386 | $951.85 | 37% |
| Milford | 11 | $5,260 | $511.04 | 59% |
| Town of Southampton | 1,321 | $5,194 | $942.93 | 35% |
| Town/Village of Harrison | 10 | $5,127 | $598.98 | 53% |
| Town of Stuyvesant | 11 | $5,110 | $519.35 | 40% |
| Town of Pound Ridge | 19 | $5,080 | $535.21 | 46% |
| Brookfield | 12 | $5,041 | $522.01 | 51% |
| Town of Pawling | 15 | $5,032 | $387.08 | 53% |
| Middletown | 387 | $4,932 | $547.91 | 45% |
| Town of Putnam Valley | 49 | $4,845 | $400.39 | 47% |