Winchester Airbnb Market Analysis 2025: Short Term Rental Data & Vacation Rental Statistics in Northwest Hills Planning Region, United States
Is Airbnb profitable in Winchester in 2025? Explore comprehensive Airbnb analytics for Winchester, Northwest Hills Planning Region, United States to uncover income potential. This 2025 STR market report for Winchester, based on AirROI data from October 2024 to September 2025, reveals key trends in the niche market of 18 active listings.
Whether you're considering an Airbnb investment in Winchester, optimizing your existing vacation rental, or exploring rental arbitrage opportunities, understanding the Winchester Airbnb data is crucial. Leveraging the low regulation environment is key to maximizing your short term rental income potential. Let's dive into the specifics.
Key Winchester Airbnb Performance Metrics Overview
Monthly Airbnb Revenue Variations & Income Potential in Winchester (2025)
Understanding the monthly revenue variations for Airbnb listings in Winchester is key to maximizing your short term rental income potential. Seasonality significantly impacts earnings. Our analysis, based on data from the past 12 months, shows that the peak revenue month for STRs in Winchester is typically July, while March often presents the lowest earnings, highlighting opportunities for strategic pricing adjustments during shoulder and low seasons. Explore the typical Airbnb income in Winchester across different performance tiers:
- Best-in-class properties (Top 10%) achieve $6,414+ monthly, often utilizing dynamic pricing and superior guest experiences.
- Strong performing properties (Top 25%) earn $3,626 or more, indicating effective management and desirable locations/amenities.
- Typical properties (Median) generate around $2,203 per month, representing the average market performance.
- Entry-level properties (Bottom 25%) see earnings around $1,404, often with potential for optimization.
Average Monthly Airbnb Earnings Trend in Winchester
Winchester Airbnb Occupancy Rate Trends (2025)
Maximize your bookings by understanding the Winchester STR occupancy trends. Seasonal demand shifts significantly influence how often properties are booked. Typically, Julysees the highest demand (peak season occupancy), while April experiences the lowest (low season). Effective strategies, like adjusting minimum stays or offering promotions, can boost occupancy during slower periods. Here's how different property tiers perform in Winchester:
- Best-in-class properties (Top 10%) achieve 75%+ occupancy, indicating high desirability and potentially optimized availability.
- Strong performing properties (Top 25%) maintain 62% or higher occupancy, suggesting good market fit and guest satisfaction.
- Typical properties (Median) have an occupancy rate around 41%.
- Entry-level properties (Bottom 25%) average 27% occupancy, potentially facing higher vacancy.
Average Monthly Occupancy Rate Trend in Winchester
Average Daily Rate (ADR) Airbnb Trends in Winchester (2025)
Effective short term rental pricing strategy in Winchester involves understanding monthly ADR fluctuations. The Average Daily Rate (ADR) for Airbnb in Winchester typically peaks in July and dips lowest during March. Leveraging Airbnb dynamic pricing tools or strategies based on this seasonality can significantly boost revenue. Here's a look at the typical nightly rates achieved:
- Best-in-class properties (Top 10%) command rates of $1,423+ per night, often due to premium features or locations.
- Strong performing properties (Top 25%) achieve nightly rates of $281 or more.
- Typical properties (Median) charge around $169 per night.
- Entry-level properties (Bottom 25%) earn around $127 per night.
Average Daily Rate (ADR) Trend by Month in Winchester
Get Live Winchester Market Intelligence 👇
Explore Real-time Analytics
Airbnb Seasonality Analysis & Trends in Winchester (2025)
Peak Season (July, August, June)
- Revenue averages $6,097 per month
- Occupancy rates average 54.5%
- Daily rates average $363
Shoulder Season
- Revenue averages $3,061 per month
- Occupancy maintains around 42.6%
- Daily rates hold near $322
Low Season (January, March, April)
- Revenue drops to average $1,809 per month
- Occupancy decreases to average 34.9%
- Daily rates adjust to average $308
Seasonality Insights for Winchester
- The Airbnb seasonality in Winchester shows highly seasonal trends requiring careful strategy. While the sections above show seasonal averages, it's also insightful to look at the extremes:
- During the high season, the absolute peak month showcases Winchester's highest earning potential, with monthly revenues capable of climbing to $7,157, occupancy reaching a high of 59.8%, and ADRs peaking at $365.
- Conversely, the slowest single month of the year, typically falling within the low season, marks the market's lowest point. In this month, revenue might dip to $1,532, occupancy could drop to 32.2%, and ADRs may adjust down to $303.
- Understanding both the seasonal averages and these monthly peaks and troughs in revenue, occupancy, and ADR is crucial for maximizing your Airbnb profit potential in Winchester.
Seasonal Strategies for Maximizing Profit
- Peak Season: Maximize revenue through premium pricing and potentially longer minimum stays. Ensure high availability.
- Low Season: Offer competitive pricing, special promotions (e.g., extended stay discounts), and flexible cancellation policies. Target off-season travelers like remote workers or budget-conscious guests.
- Shoulder Seasons: Implement dynamic pricing that balances peak and low rates. Target weekend travelers or specific events. Offer slightly more flexible terms than peak season.
- Regularly analyze your own performance against these Winchester seasonality benchmarks and adjust your pricing and availability strategy accordingly.
Best Areas for Airbnb Investment in Winchester (2025)
Exploring the top neighborhoods for short-term rentals in Winchester? This section highlights key areas, outlining why they are attractive for hosts and guests, along with notable local attractions. Consider these locations based on your target guest profile and investment strategy.
| Neighborhood / Area | Why Host Here? (Target Guests & Appeal) | Key Attractions & Landmarks |
|---|---|---|
| Downtown Winchester | The vibrant downtown area is home to historic sites, shops, and restaurants, making it a popular choice for tourists looking to explore the local culture and history. | Old Town Winchester, Winchester History Museum, Abrams Delight, Museum of the Shenandoah Valley, Patsy Cline Historic House, Apple Blossom Mall |
| Winchester Historic District | This area showcases the city's rich history with beautiful architecture and is close to many historical attractions, attracting those interested in history and culture. | George Washington's Office Museum, Handley Library, Shenandoah Valley Discovery Museum, Old Court House Civil War Museum, Stonewall Jackson's Headquarters |
| Shawneeland | A serene, nature-filled neighborhood on the outskirts of Winchester, ideal for those looking for a retreat while still being close to the city. | Shawneeland Lake, Hiking trails, Parks and picnic areas, Nature conservation area |
| Berkeley | A suburban neighborhood offering a blend of residential comfort and convenience, making it ideal for families and long-term guests. | Local parks, Close to shopping, Community events, Family-friendly neighborhoods |
| Old Town | Known for its charming shops and restaurants, Old Town provides a delightful experience for visitors looking to enjoy local cuisine and entertainment. | Local dining experiences, Art galleries, Seasonal festivals, Live music venues |
| Cedar Creek | This area offers beautiful rural landscapes and outdoor activities, great for guests looking to escape the city life. | Cedar Creek and Belle Grove National Historical Park, Outdoor recreation opportunities, Scenic drives |
| Square Corner | A small community close to Winchester that offers a local feel and easy access to the city, suitable for short and long-term rentals. | Family-owned businesses, Close-knit community events, Access to local amenities |
| Meadow Branch | A growing neighborhood that appeals to both locals and visitors with its modern amenities and proximity to essential services. | Shopping centers, Local parks, Community features |
Understanding Airbnb License Requirements & STR Laws in Winchester (2025)
While Winchester, Northwest Hills Planning Region, United States currently shows low STR regulations, specific Airbnb license requirements might still exist or change. Always verify the latest short term rental regulations and Airbnb license requirements directly with local government authorities for Winchester to ensure full compliance before hosting.
(Source: AirROI data, 2025, finding no licensed listings among those analyzed)
Top Performing Airbnb Properties in Winchester (2025)
Benchmark your potential! Explore examples of top-performing Airbnb properties in Winchesterbased on Trailing Twelve Month (TTM) revenue. Analyze their characteristics, revenue, occupancy rate, and ADR to understand what drives success in this market.
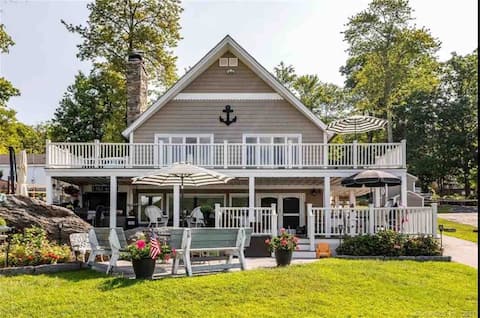
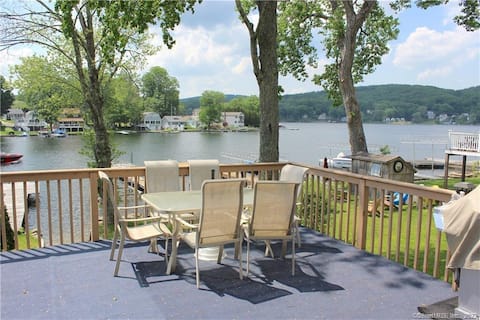
Luxury Highland Lake Waterfront
Entire Place • 7 bedrooms

Newly renovated lakefront home!
Entire Place • 4 bedrooms
Winsted /Winchester House wifi high speed internet
Entire Place • 4 bedrooms
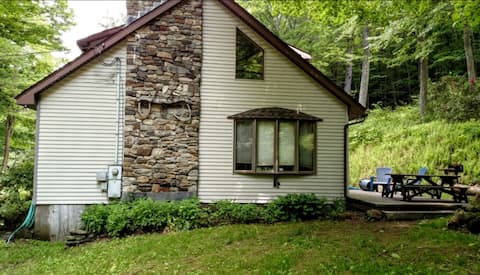
Renovated lake house, just steps to the water.
Entire Place • 3 bedrooms
Waterfront Cottage at Highland Lake w/dock
Entire Place • 2 bedrooms
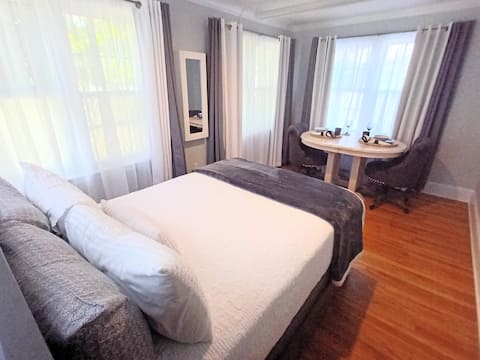
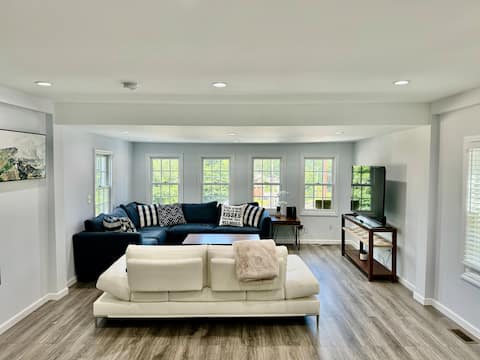
Haven at Highland lake
Entire Place • 1 bedroom
Note: Performance varies based on location, size, amenities, seasonality, and management quality. Data reflects the past 12 months.
Top Performing Airbnb Hosts in Winchester (2025)
Learn from the best! This table showcases top-performing Airbnb hosts in Winchester based on the number of properties managed and estimated total revenue over the past year. Analyze their scale and performance metrics.
| Host Name | Properties | Grossing Revenue | Stay Reviews | Avg Rating |
|---|---|---|---|---|
| Beth | 1 | $183,376 | 28 | 5.00/5.0 |
| Jessica | 1 | $77,812 | 31 | 4.97/5.0 |
| Jeanne | 3 | $76,613 | 107 | 4.92/5.0 |
| Kristina | 1 | $42,209 | 31 | 4.87/5.0 |
| Tian | 1 | $36,379 | 43 | 4.79/5.0 |
| Melissa | 1 | $25,203 | 122 | 4.89/5.0 |
| Meredith | 1 | $24,016 | 50 | 4.92/5.0 |
| Cheryl | 1 | $22,835 | 184 | 4.97/5.0 |
| Dianne | 1 | $21,330 | 6 | 5.00/5.0 |
| John | 1 | $19,787 | 397 | 4.91/5.0 |
Analyzing the strategies of top hosts, such as their property selection, pricing, and guest communication, can offer valuable lessons for optimizing your own Airbnb operations in Winchester.
Dive Deeper: Advanced Winchester STR Market Data (2025)
Ready to unlock more insights? AirROI provides access to advanced metrics and comprehensive Airbnb data for Winchester. Explore detailed analytics beyond this report to refine your investment strategy, optimize pricing, and maximize your vacation rental profits.
Explore Advanced MetricsWinchester Short-Term Rental Market Composition (2025): Property & Room Types
Room Type Distribution
Property Type Distribution
Market Composition Insights for Winchester
- The Winchester Airbnb market composition is heavily skewed towards Entire Home/Apt listings, which make up 100% of the 18 active rentals. This indicates strong guest preference for privacy and space.
- Looking at the property type distribution in Winchester, House properties are the most common (55.6%), reflecting the local real estate landscape.
- Houses represent a significant 55.6% portion, catering likely to families or larger groups.
Winchester Airbnb Room Capacity Analysis (2025): Bedroom Distribution
Distribution of Listings by Number of Bedrooms
Room Capacity Insights for Winchester
- The dominant room capacity in Winchester is 2 bedrooms listings, making up 33.3% of the market. This suggests a strong demand for properties suitable for couples or solo travelers.
- Together, 2 bedrooms and 1 bedroom properties represent 55.5% of the active Airbnb listings in Winchester, indicating a high concentration in these sizes.
- A significant 44.5% of listings offer 3+ bedrooms, catering to larger groups and families seeking more space in Winchester.
Winchester Vacation Rental Guest Capacity Trends (2025)
Distribution of Listings by Guest Capacity
Guest Capacity Insights for Winchester
- The most common guest capacity trend in Winchester vacation rentals is listings accommodating 8+ guests (33.3%). This suggests the primary traveler segment is likely larger groups.
- Properties designed for 8+ guests and 6 guests dominate the Winchester STR market, accounting for 61.1% of listings.
- 61.1% of properties accommodate 6+ guests, serving the market segment for larger families or group travel in Winchester.
- On average, properties in Winchester are equipped to host 5.7 guests.
Winchester Airbnb Booking Patterns (2025): Available vs. Booked Days
Available Days Distribution
Booked Days Distribution
Booking Pattern Insights for Winchester
- The most common availability pattern in Winchester falls within the 181-270 days range, representing 61.1% of listings. This suggests many properties have significant open periods on their calendars.
- Approximately 88.9% of listings show high availability (181+ days open annually), indicating potential for increased bookings or specific owner usage patterns.
- For booked days, the 91-180 days range is most frequent in Winchester (61.1%), reflecting common guest stay durations or potential owner blocking patterns.
- A notable 11.2% of properties secure long booking periods (181+ days booked per year), highlighting successful long-term rental strategies or significant owner usage.
Winchester Airbnb Minimum Stay Requirements Analysis
Distribution of Listings by Minimum Night Requirement
1 Night
5 listings
27.8% of total
2 Nights
3 listings
16.7% of total
3 Nights
1 listings
5.6% of total
4-6 Nights
2 listings
11.1% of total
30+ Nights
7 listings
38.9% of total
Key Insights
- The most prevalent minimum stay requirement in Winchester is 30+ Nights, adopted by 38.9% of listings. This highlights the market's preference for longer commitments.
- A significant segment (38.9%) caters to monthly stays (30+ nights) in Winchester, pointing to opportunities in the extended-stay market.
Recommendations
- Align with the market by considering a 30+ Nights minimum stay, as 38.9% of Winchester hosts use this setting.
- If feasible, allowing 1-night stays, especially midweek or during low season, could capture last-minute bookings, as only 27.8% currently do.
- Explore offering discounts for stays of 30+ nights to attract the 38.9% of the market seeking extended stays.
- Adjust minimum nights based on seasonality – potentially shorter during low season and longer during peak demand periods in Winchester.
Winchester Airbnb Cancellation Policy Trends Analysis (2025)
Flexible
3 listings
17.6% of total
Moderate
6 listings
35.3% of total
Firm
6 listings
35.3% of total
Strict
2 listings
11.8% of total
Cancellation Policy Insights for Winchester
- The prevailing Airbnb cancellation policy trend in Winchester is Moderate, used by 35.3% of listings.
- There's a relatively balanced mix between guest-friendly (52.9%) and stricter (47.1%) policies, offering choices for different guest needs.
Recommendations for Hosts
- Consider adopting a Moderate policy to align with the 35.3% market standard in Winchester.
- Using a Strict policy might deter some guests, as only 11.8% of listings use it. Evaluate if potential revenue protection outweighs possible lower booking rates.
- Regularly review your cancellation policy against competitors and market demand shifts in Winchester.
Winchester STR Booking Lead Time Analysis (2025)
Average Booking Lead Time by Month
Booking Lead Time Insights for Winchester
- The overall average booking lead time for vacation rentals in Winchester is 52 days.
- Guests book furthest in advance for stays during July (average 72 days), likely coinciding with peak travel demand or local events.
- The shortest booking windows occur for stays in January (average 21 days), indicating more last-minute travel plans during this time.
- Seasonally, Summer (71 days avg.) sees the longest lead times, while Winter (29 days avg.) has the shortest, reflecting typical travel planning cycles.
Recommendations for Hosts
- Use the overall average lead time (52 days) as a baseline for your pricing and availability strategy in Winchester.
- For July stays, consider implementing length-of-stay discounts or slightly higher rates for bookings made less than 72 days out to capitalize on advance planning.
- Target marketing efforts for the Summer season well in advance (at least 71 days) to capture early planners.
- Monitor your own booking lead times against these Winchester averages to identify opportunities for dynamic pricing adjustments.
Popular & Essential Airbnb Amenities in Winchester (2025)
Amenity Prevalence
Amenity Insights for Winchester
- Essential amenities in Winchester that guests expect include: Smoke alarm, Hot water, Heating, Wifi, Free parking on premises. Lacking these (any) could significantly impact bookings.
- Popular amenities like Essentials, Carbon monoxide alarm, Coffee maker are common but not universal. Offering these can provide a competitive edge.
Recommendations for Hosts
- Ensure your listing includes all essential amenities for Winchester: Smoke alarm, Hot water, Heating, Wifi, Free parking on premises.
- Consider adding popular differentiators like Essentials or Carbon monoxide alarm to increase appeal.
- Highlight unique or less common amenities you offer (e.g., hot tub, dedicated workspace, EV charger) in your listing description and photos.
- Regularly check competitor amenities in Winchester to stay competitive.
Winchester Airbnb Guest Demographics & Profile Analysis (2025)
Guest Profile Summary for Winchester
- The typical guest profile for Airbnb in Winchester consists of primarily domestic travelers (93%), often arriving from nearby New York, typically belonging to the Post-2000s (Gen Z/Alpha) group (50%), primarily speaking English or Spanish.
- Domestic travelers account for 92.9% of guests.
- Key international markets include United States (92.9%) and DC (2.8%).
- Top languages spoken are English (77.4%) followed by Spanish (8.7%).
- A significant demographic segment is the Post-2000s (Gen Z/Alpha) group, representing 50% of guests.
Recommendations for Hosts
- Target domestic marketing efforts towards travelers from New York and Washington.
- Tailor amenities and listing descriptions to appeal to the dominant Post-2000s (Gen Z/Alpha) demographic (e.g., highlight fast WiFi, smart home features, local guides).
- Highlight unique local experiences or amenities relevant to the primary guest profile.
- Consider seasonal promotions aligned with peak travel times for key origin markets.
Nearby Short-Term Rental Market Comparison
How does the Winchester Airbnb market stack up against its neighbors? Compare key performance metrics like average monthly revenue, ADR, and occupancy rates in surrounding areas to understand the broader regional STR landscape.
| Market | Active Properties | Monthly Revenue | Daily Rate | Avg. Occupancy |
|---|---|---|---|---|
| Town of Ancram | 22 | $5,916 | $517.34 | 39% |
| Frankford Township | 12 | $5,803 | $571.00 | 44% |
| Spring Lake Heights | 17 | $5,495 | $699.58 | 41% |
| Town of East Hampton | 1,382 | $5,429 | $982.56 | 33% |
| Town of Kingston | 13 | $5,231 | $438.70 | 46% |
| Town of Southampton | 1,254 | $5,227 | $984.78 | 32% |
| Town of Pound Ridge | 18 | $5,204 | $574.35 | 44% |
| Monmouth Beach | 13 | $5,203 | $660.27 | 40% |
| Town of Stillwater | 57 | $5,076 | $562.89 | 41% |
| Town of Pleasant Valley | 31 | $5,051 | $509.89 | 40% |