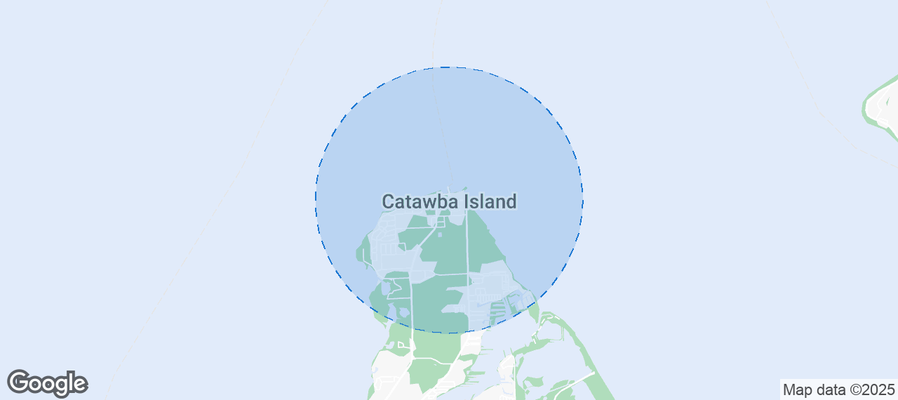
Catawba Island Township Airbnb Market Analysis 2025: Short Term Rental Data & Vacation Rental Statistics in Ohio, United States
Is Airbnb profitable in Catawba Island Township in 2025? Explore comprehensive Airbnb analytics for Catawba Island Township, Ohio, United States to uncover income potential. This 2025 STR market report for Catawba Island Township, based on AirROI data from September 2024 to August 2025, reveals key trends in the niche market of 18 active listings.
Whether you're considering an Airbnb investment in Catawba Island Township, optimizing your existing vacation rental, or exploring rental arbitrage opportunities, understanding the Catawba Island Township Airbnb data is crucial. Leveraging the low regulation environment is key to maximizing your short term rental income potential. Let's dive into the specifics.
Key Catawba Island Township Airbnb Performance Metrics Overview
Monthly Airbnb Revenue Variations & Income Potential in Catawba Island Township (2025)
Understanding the monthly revenue variations for Airbnb listings in Catawba Island Township is key to maximizing your short term rental income potential. Seasonality significantly impacts earnings. Our analysis, based on data from the past 12 months, shows that the peak revenue month for STRs in Catawba Island Township is typically July, while December often presents the lowest earnings, highlighting opportunities for strategic pricing adjustments during shoulder and low seasons. Explore the typical Airbnb income in Catawba Island Township across different performance tiers:
- Best-in-class properties (Top 10%) achieve $5,836+ monthly, often utilizing dynamic pricing and superior guest experiences.
- Strong performing properties (Top 25%) earn $4,367 or more, indicating effective management and desirable locations/amenities.
- Typical properties (Median) generate around $3,097 per month, representing the average market performance.
- Entry-level properties (Bottom 25%) see earnings around $2,047, often with potential for optimization.
Average Monthly Airbnb Earnings Trend in Catawba Island Township
Catawba Island Township Airbnb Occupancy Rate Trends (2025)
Maximize your bookings by understanding the Catawba Island Township STR occupancy trends. Seasonal demand shifts significantly influence how often properties are booked. Typically, Julysees the highest demand (peak season occupancy), while December experiences the lowest (low season). Effective strategies, like adjusting minimum stays or offering promotions, can boost occupancy during slower periods. Here's how different property tiers perform in Catawba Island Township:
- Best-in-class properties (Top 10%) achieve 68%+ occupancy, indicating high desirability and potentially optimized availability.
- Strong performing properties (Top 25%) maintain 51% or higher occupancy, suggesting good market fit and guest satisfaction.
- Typical properties (Median) have an occupancy rate around 36%.
- Entry-level properties (Bottom 25%) average 25% occupancy, potentially facing higher vacancy.
Average Monthly Occupancy Rate Trend in Catawba Island Township
Average Daily Rate (ADR) Airbnb Trends in Catawba Island Township (2025)
Effective short term rental pricing strategy in Catawba Island Township involves understanding monthly ADR fluctuations. The Average Daily Rate (ADR) for Airbnb in Catawba Island Township typically peaks in July and dips lowest during March. Leveraging Airbnb dynamic pricing tools or strategies based on this seasonality can significantly boost revenue. Here's a look at the typical nightly rates achieved:
- Best-in-class properties (Top 10%) command rates of $435+ per night, often due to premium features or locations.
- Strong performing properties (Top 25%) achieve nightly rates of $387 or more.
- Typical properties (Median) charge around $285 per night.
- Entry-level properties (Bottom 25%) earn around $227 per night.
Average Daily Rate (ADR) Trend by Month in Catawba Island Township
Get Live Catawba Island Township Market Intelligence 👇
Explore Real-time Analytics
Airbnb Seasonality Analysis & Trends in Catawba Island Township (2025)
Peak Season (July, June, May)
- Revenue averages $5,914 per month
- Occupancy rates average 59.6%
- Daily rates average $388
Shoulder Season
- Revenue averages $3,200 per month
- Occupancy maintains around 38.2%
- Daily rates hold near $362
Low Season (January, February, December)
- Revenue drops to average $1,092 per month
- Occupancy decreases to average 17.5%
- Daily rates adjust to average $350
Seasonality Insights for Catawba Island Township
- The Airbnb seasonality in Catawba Island Township shows highly seasonal trends requiring careful strategy. While the sections above show seasonal averages, it's also insightful to look at the extremes:
- During the high season, the absolute peak month showcases Catawba Island Township's highest earning potential, with monthly revenues capable of climbing to $7,370, occupancy reaching a high of 69.9%, and ADRs peaking at $398.
- Conversely, the slowest single month of the year, typically falling within the low season, marks the market's lowest point. In this month, revenue might dip to $682, occupancy could drop to 8.9%, and ADRs may adjust down to $347.
- Understanding both the seasonal averages and these monthly peaks and troughs in revenue, occupancy, and ADR is crucial for maximizing your Airbnb profit potential in Catawba Island Township.
Seasonal Strategies for Maximizing Profit
- Peak Season: Maximize revenue through premium pricing and potentially longer minimum stays. Ensure high availability.
- Low Season: Offer competitive pricing, special promotions (e.g., extended stay discounts), and flexible cancellation policies. Target off-season travelers like remote workers or budget-conscious guests.
- Shoulder Seasons: Implement dynamic pricing that balances peak and low rates. Target weekend travelers or specific events. Offer slightly more flexible terms than peak season.
- Regularly analyze your own performance against these Catawba Island Township seasonality benchmarks and adjust your pricing and availability strategy accordingly.
Best Areas for Airbnb Investment in Catawba Island Township (2025)
Exploring the top neighborhoods for short-term rentals in Catawba Island Township? This section highlights key areas, outlining why they are attractive for hosts and guests, along with notable local attractions. Consider these locations based on your target guest profile and investment strategy.
| Neighborhood / Area | Why Host Here? (Target Guests & Appeal) | Key Attractions & Landmarks |
|---|---|---|
| Lake Erie Shores | Beautiful waterfront area ideal for tourists seeking relaxation by the beach and recreational activities. It's popular for fishing, boating, and enjoying scenic sunsets. | Catawba Island State Park, Catawba Point Park, Lakeside Chautauqua, Cedar Point Amusement Park, Marblehead Lighthouse |
| Port Clinton | Charming lakeside town known for its fishing and boating opportunities. It's a gateway for visitors to the nearby Cedar Point amusement park, making it an attractive location for families. | Port Clinton Lighthouse, African Safari Wildlife Park, Lake Erie Islands, Fishing Charters, Jet Ski Rentals |
| Put-in-Bay | Famous for its relaxing island atmosphere and various activities including wine tasting and historical tours. A popular weekend getaway for those looking to enjoy island life. | Perry's Victory and International Peace Memorial, Put-in-Bay Winery, South Bass Island State Park, The Butterfly House, Put-in-Bay Chocolate Museum |
| Cedar Point Beach | Renowned for its amusement park, Cedar Point Beach attracts thrill-seekers and families alike. The beach area offers a fun, entertainment-filled experience during the summer months. | Cedar Point Amusement Park, Cedar Point Beach, Soak City Waterpark, Hotel Breakers, Great Lake Erie views |
| Marblehead | Historic village with picturesque views and a quiet, quaint atmosphere. Perfect for guests looking for a peaceful retreat while still having access to local attractions. | Marblehead Lighthouse, Marblehead Peninsula, Lake Erie Boat Tours, Historic sites, Scenic views |
| Sandusky | Home to Cedar Point and a hub for various water activities. Sandusky offers a mix of excitement and relaxation, catering to a wide range of tourists. | Cedar Point Amusement Park, Sandusky Maritime Museum, Kalahari Waterpark, Sandusky Bay, Great Lakes Historical Society |
| Kelleys Island | A serene island escape known for its natural beauty and outdoor activities. Ideal for nature lovers and those looking to unwind away from the hustle and bustle. | Kelleys Island State Park, Butterfly House, Glacial Grooves Geological Preserve, Kelleys Island Wine Company, St. Michael's Catholic Church |
| Lakeside Chautauqua | A quaint community known for its cultural events and recreational opportunities on Lake Erie. Offers a mix of relaxation and engaging community activities for all ages. | Lakeside Chautauqua Auditorium, Lakeside Park, Community events, Biking trails, Arts and crafts shows |
Understanding Airbnb License Requirements & STR Laws in Catawba Island Township (2025)
While Catawba Island Township, Ohio, United States currently shows low STR regulations, specific Airbnb license requirements might still exist or change. Always verify the latest short term rental regulations and Airbnb license requirements directly with local government authorities for Catawba Island Township to ensure full compliance before hosting.
(Source: AirROI data, 2025, finding no licensed listings among those analyzed)
Top Performing Airbnb Properties in Catawba Island Township (2025)
Benchmark your potential! Explore examples of top-performing Airbnb properties in Catawba Island Townshipbased on Trailing Twelve Month (TTM) revenue. Analyze their characteristics, revenue, occupancy rate, and ADR to understand what drives success in this market.

The Catawba Fish House next to Herb's Bait
Entire Place • 4 bedrooms

Catawba Island - Walk to Ferry
Entire Place • 4 bedrooms

2BR Cottage Suite Catawba; Lake, pool, hot tub
Entire Place • 2 bedrooms

Sand Road Sunset Lakeview Cottage
Entire Place • 2 bedrooms

Catawba Island Log Home getaway!
Entire Place • 3 bedrooms

Catawba Island (Lake Erie) Marina House
Entire Place • 3 bedrooms
Note: Performance varies based on location, size, amenities, seasonality, and management quality. Data reflects the past 12 months.
Top Performing Airbnb Hosts in Catawba Island Township (2025)
Learn from the best! This table showcases top-performing Airbnb hosts in Catawba Island Township based on the number of properties managed and estimated total revenue over the past year. Analyze their scale and performance metrics.
| Host Name | Properties | Grossing Revenue | Stay Reviews | Avg Rating |
|---|---|---|---|---|
| Karen | 3 | $102,647 | 26 | 5.00/5.0 |
| Patricia | 1 | $52,891 | 58 | 4.91/5.0 |
| Amanda | 1 | $46,834 | 131 | 4.95/5.0 |
| Rebecca | 1 | $39,214 | 64 | 4.95/5.0 |
| Carol | 1 | $37,732 | 10 | 4.80/5.0 |
| Brian | 1 | $35,864 | 100 | 4.94/5.0 |
| Belinda | 1 | $35,697 | 32 | 4.91/5.0 |
| Ann-Marie | 1 | $26,083 | 29 | 4.90/5.0 |
| Elizabeth & Mike | 1 | $24,807 | 22 | 4.86/5.0 |
| Bonnie | 1 | $17,541 | 139 | 4.84/5.0 |
Analyzing the strategies of top hosts, such as their property selection, pricing, and guest communication, can offer valuable lessons for optimizing your own Airbnb operations in Catawba Island Township.
Dive Deeper: Advanced Catawba Island Township STR Market Data (2025)
Ready to unlock more insights? AirROI provides access to advanced metrics and comprehensive Airbnb data for Catawba Island Township. Explore detailed analytics beyond this report to refine your investment strategy, optimize pricing, and maximize your vacation rental profits.
Explore Advanced MetricsCatawba Island Township Short-Term Rental Market Composition (2025): Property & Room Types
Room Type Distribution
Property Type Distribution
Market Composition Insights for Catawba Island Township
- The Catawba Island Township Airbnb market composition is heavily skewed towards Entire Home/Apt listings, which make up 83.3% of the 18 active rentals. This indicates strong guest preference for privacy and space.
- Looking at the property type distribution in Catawba Island Township, House properties are the most common (72.2%), reflecting the local real estate landscape.
- Houses represent a significant 72.2% portion, catering likely to families or larger groups.
Catawba Island Township Airbnb Room Capacity Analysis (2025): Bedroom Distribution
Distribution of Listings by Number of Bedrooms
Room Capacity Insights for Catawba Island Township
- The dominant room capacity in Catawba Island Township is 2 bedrooms listings, making up 50% of the market. This suggests a strong demand for properties suitable for couples or solo travelers.
- Together, 2 bedrooms and 3 bedrooms properties represent 66.7% of the active Airbnb listings in Catawba Island Township, indicating a high concentration in these sizes.
- A significant 33.4% of listings offer 3+ bedrooms, catering to larger groups and families seeking more space in Catawba Island Township.
Catawba Island Township Vacation Rental Guest Capacity Trends (2025)
Distribution of Listings by Guest Capacity
Guest Capacity Insights for Catawba Island Township
- The most common guest capacity trend in Catawba Island Township vacation rentals is listings accommodating 6 guests (44.4%). This suggests the primary traveler segment is likely larger groups.
- Properties designed for 6 guests and 8+ guests dominate the Catawba Island Township STR market, accounting for 66.6% of listings.
- 66.6% of properties accommodate 6+ guests, serving the market segment for larger families or group travel in Catawba Island Township.
- On average, properties in Catawba Island Township are equipped to host 5.4 guests.
Catawba Island Township Airbnb Booking Patterns (2025): Available vs. Booked Days
Available Days Distribution
Booked Days Distribution
Booking Pattern Insights for Catawba Island Township
- The most common availability pattern in Catawba Island Township falls within the 271-366 days range, representing 50% of listings. This suggests many properties have significant open periods on their calendars.
- Approximately 94.4% of listings show high availability (181+ days open annually), indicating potential for increased bookings or specific owner usage patterns.
- For booked days, the 91-180 days range is most frequent in Catawba Island Township (50%), reflecting common guest stay durations or potential owner blocking patterns.
- A notable 5.6% of properties secure long booking periods (181+ days booked per year), highlighting successful long-term rental strategies or significant owner usage.
Catawba Island Township Airbnb Minimum Stay Requirements Analysis
Distribution of Listings by Minimum Night Requirement
1 Night
2 listings
11.1% of total
2 Nights
6 listings
33.3% of total
3 Nights
3 listings
16.7% of total
4-6 Nights
1 listings
5.6% of total
30+ Nights
6 listings
33.3% of total
Key Insights
- The most prevalent minimum stay requirement in Catawba Island Township is 2 Nights, adopted by 33.3% of listings. This highlights the market's preference for shorter, flexible bookings.
- A significant segment (33.3%) caters to monthly stays (30+ nights) in Catawba Island Township, pointing to opportunities in the extended-stay market.
Recommendations
- Align with the market by considering a 2 Nights minimum stay, as 33.3% of Catawba Island Township hosts use this setting.
- If feasible, allowing 1-night stays, especially midweek or during low season, could capture last-minute bookings, as only 11.1% currently do.
- A 2-night minimum appears standard (33.3%). Consider this for weekends or peak periods.
- Explore offering discounts for stays of 30+ nights to attract the 33.3% of the market seeking extended stays.
- Adjust minimum nights based on seasonality – potentially shorter during low season and longer during peak demand periods in Catawba Island Township.
Catawba Island Township Airbnb Cancellation Policy Trends Analysis (2025)
Flexible
3 listings
16.7% of total
Moderate
1 listings
5.6% of total
Firm
6 listings
33.3% of total
Strict
8 listings
44.4% of total
Cancellation Policy Insights for Catawba Island Township
- The prevailing Airbnb cancellation policy trend in Catawba Island Township is Strict, used by 44.4% of listings.
- A majority (77.7%) of hosts in Catawba Island Township utilize Firm or Strict policies, indicating a market where hosts prioritize booking security.
Recommendations for Hosts
- Consider adopting a Strict policy to align with the 44.4% market standard in Catawba Island Township.
- With 44.4% using Strict terms, this is a viable option in Catawba Island Township, particularly for high-value properties or during peak demand periods.
- Regularly review your cancellation policy against competitors and market demand shifts in Catawba Island Township.
Catawba Island Township STR Booking Lead Time Analysis (2025)
Average Booking Lead Time by Month
Booking Lead Time Insights for Catawba Island Township
- The overall average booking lead time for vacation rentals in Catawba Island Township is 120 days.
- Guests book furthest in advance for stays during June (average 129 days), likely coinciding with peak travel demand or local events.
- The shortest booking windows occur for stays in January (average 10 days), indicating more last-minute travel plans during this time.
- Seasonally, Summer (110 days avg.) sees the longest lead times, while Winter (38 days avg.) has the shortest, reflecting typical travel planning cycles.
Recommendations for Hosts
- Use the overall average lead time (120 days) as a baseline for your pricing and availability strategy in Catawba Island Township.
- During January, focus on last-minute booking availability and promotions, as guests book with very short notice (10 days avg.).
- Target marketing efforts for the Summer season well in advance (at least 110 days) to capture early planners.
- Monitor your own booking lead times against these Catawba Island Township averages to identify opportunities for dynamic pricing adjustments.
Popular & Essential Airbnb Amenities in Catawba Island Township (2025)
Amenity Prevalence
Amenity Insights for Catawba Island Township
- Essential amenities in Catawba Island Township that guests expect include: Smoke alarm, Coffee maker, Refrigerator, TV, Free parking on premises. Lacking these (any) could significantly impact bookings.
- Popular amenities like Dishes and silverware, Wifi, Fire extinguisher are common but not universal. Offering these can provide a competitive edge.
- Warning: Wifi is not universally provided but is considered essential globally. Ensure reliable Wifi is offered.
Recommendations for Hosts
- Ensure your listing includes all essential amenities for Catawba Island Township: Smoke alarm, Coffee maker, Refrigerator, TV, Free parking on premises.
- Consider adding popular differentiators like Dishes and silverware or Wifi to increase appeal.
- Highlight unique or less common amenities you offer (e.g., hot tub, dedicated workspace, EV charger) in your listing description and photos.
- Regularly check competitor amenities in Catawba Island Township to stay competitive.
Catawba Island Township Airbnb Guest Demographics & Profile Analysis (2025)
Guest Profile Summary for Catawba Island Township
- The typical guest profile for Airbnb in Catawba Island Township consists of primarily domestic travelers (98%), often arriving from nearby Columbus, typically belonging to the Post-2000s (Gen Z/Alpha) group (50%), primarily speaking English or Arabic.
- Domestic travelers account for 98.1% of guests.
- Key international markets include United States (98.1%) and Canada (1.9%).
- Top languages spoken are English (85.7%) followed by Arabic (3.6%).
- A significant demographic segment is the Post-2000s (Gen Z/Alpha) group, representing 50% of guests.
Recommendations for Hosts
- Target domestic marketing efforts towards travelers from Columbus and Hamilton.
- Tailor amenities and listing descriptions to appeal to the dominant Post-2000s (Gen Z/Alpha) demographic (e.g., highlight fast WiFi, smart home features, local guides).
- Highlight unique local experiences or amenities relevant to the primary guest profile.
- Consider seasonal promotions aligned with peak travel times for key origin markets.
Nearby Short-Term Rental Market Comparison
How does the Catawba Island Township Airbnb market stack up against its neighbors? Compare key performance metrics like average monthly revenue, ADR, and occupancy rates in surrounding areas to understand the broader regional STR landscape.
| Market | Active Properties | Monthly Revenue | Daily Rate | Avg. Occupancy |
|---|---|---|---|---|
| Huron Township | 16 | $4,605 | $462.68 | 39% |
| Scio Township | 23 | $4,485 | $685.92 | 43% |
| Berlin Township | 12 | $4,451 | $370.38 | 42% |
| Peninsula | 16 | $4,286 | $314.57 | 52% |
| Chagrin Falls | 17 | $4,177 | $268.34 | 52% |
| Mentor-on-the-Lake | 10 | $4,139 | $266.47 | 56% |
| Ann Arbor | 512 | $3,990 | $432.70 | 45% |
| Erie Township | 10 | $3,609 | $221.22 | 51% |
| Huron | 124 | $3,515 | $353.69 | 40% |
| Clinton Township | 15 | $3,469 | $241.79 | 52% |