Dover Township Airbnb Market Analysis 2025: Short Term Rental Data & Vacation Rental Statistics in Ohio, United States
Is Airbnb profitable in Dover Township in 2025? Explore comprehensive Airbnb analytics for Dover Township, Ohio, United States to uncover income potential. This 2025 STR market report for Dover Township, based on AirROI data from October 2024 to September 2025, reveals key trends in the niche market of 18 active listings.
Whether you're considering an Airbnb investment in Dover Township, optimizing your existing vacation rental, or exploring rental arbitrage opportunities, understanding the Dover Township Airbnb data is crucial. Leveraging the low regulation environment is key to maximizing your short term rental income potential. Let's dive into the specifics.
Key Dover Township Airbnb Performance Metrics Overview
Monthly Airbnb Revenue Variations & Income Potential in Dover Township (2025)
Understanding the monthly revenue variations for Airbnb listings in Dover Township is key to maximizing your short term rental income potential. Seasonality significantly impacts earnings. Our analysis, based on data from the past 12 months, shows that the peak revenue month for STRs in Dover Township is typically October, while April often presents the lowest earnings, highlighting opportunities for strategic pricing adjustments during shoulder and low seasons. Explore the typical Airbnb income in Dover Township across different performance tiers:
- Best-in-class properties (Top 10%) achieve $4,278+ monthly, often utilizing dynamic pricing and superior guest experiences.
- Strong performing properties (Top 25%) earn $3,111 or more, indicating effective management and desirable locations/amenities.
- Typical properties (Median) generate around $1,982 per month, representing the average market performance.
- Entry-level properties (Bottom 25%) see earnings around $1,106, often with potential for optimization.
Average Monthly Airbnb Earnings Trend in Dover Township
Dover Township Airbnb Occupancy Rate Trends (2025)
Maximize your bookings by understanding the Dover Township STR occupancy trends. Seasonal demand shifts significantly influence how often properties are booked. Typically, Octobersees the highest demand (peak season occupancy), while February experiences the lowest (low season). Effective strategies, like adjusting minimum stays or offering promotions, can boost occupancy during slower periods. Here's how different property tiers perform in Dover Township:
- Best-in-class properties (Top 10%) achieve 74%+ occupancy, indicating high desirability and potentially optimized availability.
- Strong performing properties (Top 25%) maintain 57% or higher occupancy, suggesting good market fit and guest satisfaction.
- Typical properties (Median) have an occupancy rate around 34%.
- Entry-level properties (Bottom 25%) average 20% occupancy, potentially facing higher vacancy.
Average Monthly Occupancy Rate Trend in Dover Township
Average Daily Rate (ADR) Airbnb Trends in Dover Township (2025)
Effective short term rental pricing strategy in Dover Township involves understanding monthly ADR fluctuations. The Average Daily Rate (ADR) for Airbnb in Dover Township typically peaks in June and dips lowest during February. Leveraging Airbnb dynamic pricing tools or strategies based on this seasonality can significantly boost revenue. Here's a look at the typical nightly rates achieved:
- Best-in-class properties (Top 10%) command rates of $301+ per night, often due to premium features or locations.
- Strong performing properties (Top 25%) achieve nightly rates of $202 or more.
- Typical properties (Median) charge around $161 per night.
- Entry-level properties (Bottom 25%) earn around $117 per night.
Average Daily Rate (ADR) Trend by Month in Dover Township
Get Live Dover Township Market Intelligence 👇

Explore Real-time Analytics
Airbnb Seasonality Analysis & Trends in Dover Township (2025)
Peak Season (October, December, November)
- Revenue averages $2,713 per month
- Occupancy rates average 49.6%
- Daily rates average $166
Shoulder Season
- Revenue averages $2,322 per month
- Occupancy maintains around 39.8%
- Daily rates hold near $184
Low Season (February, April, September)
- Revenue drops to average $1,695 per month
- Occupancy decreases to average 33.4%
- Daily rates adjust to average $175
Seasonality Insights for Dover Township
- The Airbnb seasonality in Dover Township shows moderate seasonality with distinct peak and low periods. While the sections above show seasonal averages, it's also insightful to look at the extremes:
- During the high season, the absolute peak month showcases Dover Township's highest earning potential, with monthly revenues capable of climbing to $2,888, occupancy reaching a high of 54.6%, and ADRs peaking at $199.
- Conversely, the slowest single month of the year, typically falling within the low season, marks the market's lowest point. In this month, revenue might dip to $1,469, occupancy could drop to 31.3%, and ADRs may adjust down to $164.
- Understanding both the seasonal averages and these monthly peaks and troughs in revenue, occupancy, and ADR is crucial for maximizing your Airbnb profit potential in Dover Township.
Seasonal Strategies for Maximizing Profit
- Peak Season: Maximize revenue through premium pricing and potentially longer minimum stays. Ensure high availability.
- Low Season: Offer competitive pricing, special promotions (e.g., extended stay discounts), and flexible cancellation policies. Target off-season travelers like remote workers or budget-conscious guests.
- Shoulder Seasons: Implement dynamic pricing that balances peak and low rates. Target weekend travelers or specific events. Offer slightly more flexible terms than peak season.
- Regularly analyze your own performance against these Dover Township seasonality benchmarks and adjust your pricing and availability strategy accordingly.
Best Areas for Airbnb Investment in Dover Township (2025)
Exploring the top neighborhoods for short-term rentals in Dover Township? This section highlights key areas, outlining why they are attractive for hosts and guests, along with notable local attractions. Consider these locations based on your target guest profile and investment strategy.
| Neighborhood / Area | Why Host Here? (Target Guests & Appeal) | Key Attractions & Landmarks |
|---|---|---|
| Lake Erie Shoreline | Popular for its beautiful views and water activities, attracting visitors year-round for fishing, boating, and lakeside relaxation. | Lake Erie Beach, Bayside Park, Fishing Charters, Marinas, Waterfront Dining |
| Dover Historic District | Rich in history and picturesque architecture, ideal for visitors interested in exploring local heritage and cultural sites. | Dover Historical Society, Local Museums, Historic Buildings, Nearby Parks, Art Galleries |
| Tuscarawas River | Offers recreational activities such as kayaking and fishing, and has scenic walking trails perfect for nature enthusiasts and families. | River Walk, Kayak Rentals, Fishing Spots, Picnic Areas, Nature Trails |
| Nearby Amish Country | Known for its unique cultural experience and artisan markets, appealing to those seeking a getaway into Ohio's vibrant rural lifestyle. | Amish Farms, Local Crafts, Farmers Markets, Culinary Experiences, Quaint Bed and Breakfasts |
| Local Wineries | Attracts wine lovers and tourists interested in vineyard tours and tastings, with a growing wine tourism here. | Local Vineyards, Wine Tastings, Winery Tours, Brewery Visits, Gourmet Restaurant Experiences |
| Dover City Park | A family-friendly environment with plenty of green space and recreational facilities, making it perfect for families visiting the area. | Playgrounds, Picnic Areas, Sports Facilities, Walking Trails, Community Events |
| Pro Football Hall of Fame (nearby in Canton) | A major attraction for sports fans, drawing visitors from all over the country, especially during football season and Hall of Fame induction ceremonies. | Hall of Fame Museum, Football Exhibits, Nearby Restaurants, Sports Bars, Event Activities |
| New Philadelphia Historic Uptown Area | Adjacent to Dover, this area is known for its charming downtown with shops, dining, and events, providing additional attractions for visitors staying in Dover. | Shopping District, Cultural Events, Local Restaurants, Historic Sites, Art Walks |
Understanding Airbnb License Requirements & STR Laws in Dover Township (2025)
While Dover Township, Ohio, United States currently shows low STR regulations, specific Airbnb license requirements might still exist or change. Always verify the latest short term rental regulations and Airbnb license requirements directly with local government authorities for Dover Township to ensure full compliance before hosting.
(Source: AirROI data, 2025, finding no licensed listings among those analyzed)
Top Performing Airbnb Properties in Dover Township (2025)
Benchmark your potential! Explore examples of top-performing Airbnb properties in Dover Townshipbased on Trailing Twelve Month (TTM) revenue. Analyze their characteristics, revenue, occupancy rate, and ADR to understand what drives success in this market.
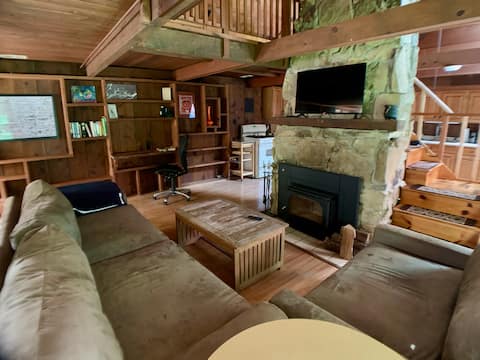
Dove Cottage Forest Retreat
Entire Place • 2 bedrooms
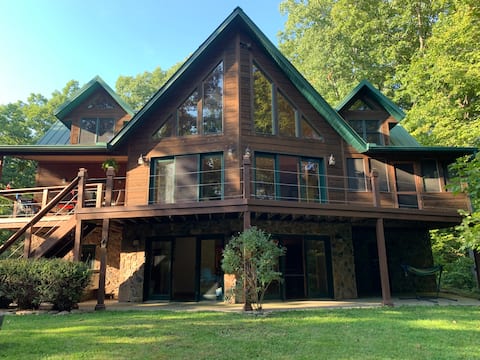
Nature Retreat for Outdoor Enthusiasts
Entire Place • 3 bedrooms
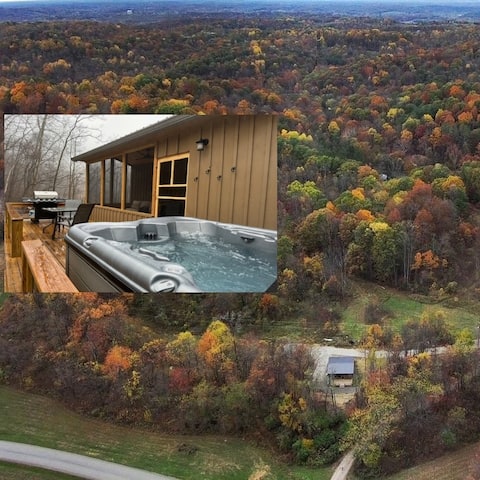
Athens 2bd cabin/hot tub, OU/Mt Nebo, HockingHills
Entire Place • 2 bedrooms

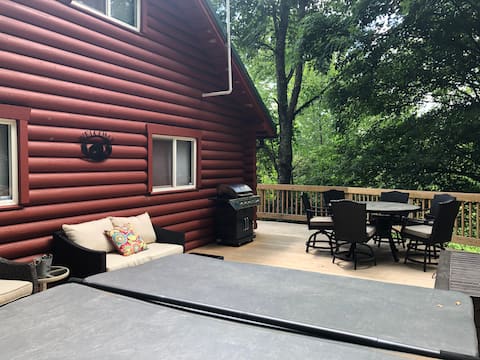
College Hill Cottage
Entire Place • 3 bedrooms
Rustic Cabin near Athens on 80 acres.
Entire Place • 4 bedrooms

Patty's Palace Container Home
Entire Place • 1 bedroom
Note: Performance varies based on location, size, amenities, seasonality, and management quality. Data reflects the past 12 months.
Top Performing Airbnb Hosts in Dover Township (2025)
Learn from the best! This table showcases top-performing Airbnb hosts in Dover Township based on the number of properties managed and estimated total revenue over the past year. Analyze their scale and performance metrics.
| Host Name | Properties | Grossing Revenue | Stay Reviews | Avg Rating |
|---|---|---|---|---|
| Bob | 1 | $68,670 | 68 | 5.00/5.0 |
| David | 2 | $48,569 | 424 | 4.92/5.0 |
| Janine | 1 | $43,669 | 84 | 4.99/5.0 |
| Sarah | 1 | $38,257 | 77 | 4.97/5.0 |
| Dianne | 1 | $31,980 | 258 | 4.94/5.0 |
| John | 1 | $29,092 | 144 | 4.94/5.0 |
| Laura | 1 | $28,737 | 96 | 4.97/5.0 |
| Rupak | 1 | $27,172 | 19 | 4.95/5.0 |
| Allison | 2 | $21,512 | 103 | 4.97/5.0 |
| Jason | 1 | $20,581 | 29 | 4.83/5.0 |
Analyzing the strategies of top hosts, such as their property selection, pricing, and guest communication, can offer valuable lessons for optimizing your own Airbnb operations in Dover Township.
Dive Deeper: Advanced Dover Township STR Market Data (2025)
Ready to unlock more insights? AirROI provides access to advanced metrics and comprehensive Airbnb data for Dover Township. Explore detailed analytics beyond this report to refine your investment strategy, optimize pricing, and maximize your vacation rental profits.
Explore Advanced MetricsDover Township Short-Term Rental Market Composition (2025): Property & Room Types
Room Type Distribution
Property Type Distribution
Market Composition Insights for Dover Township
- The Dover Township Airbnb market composition is heavily skewed towards Entire Home/Apt listings, which make up 100% of the 18 active rentals. This indicates strong guest preference for privacy and space.
- Looking at the property type distribution in Dover Township, Outdoor/Unique properties are the most common (44.4%), reflecting the local real estate landscape.
- Houses represent a significant 33.3% portion, catering likely to families or larger groups.
- The presence of 5.6% Hotel/Boutique listings indicates integration with traditional hospitality.
Dover Township Airbnb Room Capacity Analysis (2025): Bedroom Distribution
Distribution of Listings by Number of Bedrooms
Room Capacity Insights for Dover Township
- The dominant room capacity in Dover Township is 1 bedroom listings, making up 27.8% of the market. This suggests a strong demand for properties suitable for couples or solo travelers.
- Together, 1 bedroom and 2 bedrooms properties represent 55.6% of the active Airbnb listings in Dover Township, indicating a high concentration in these sizes.
- A significant 33.4% of listings offer 3+ bedrooms, catering to larger groups and families seeking more space in Dover Township.
Dover Township Vacation Rental Guest Capacity Trends (2025)
Distribution of Listings by Guest Capacity
Guest Capacity Insights for Dover Township
- The most common guest capacity trend in Dover Township vacation rentals is listings accommodating 6 guests (33.3%). This suggests the primary traveler segment is likely larger groups.
- Properties designed for 6 guests and 2 guests dominate the Dover Township STR market, accounting for 66.6% of listings.
- 44.5% of properties accommodate 6+ guests, serving the market segment for larger families or group travel in Dover Township.
- On average, properties in Dover Township are equipped to host 4.4 guests.
Dover Township Airbnb Booking Patterns (2025): Available vs. Booked Days
Available Days Distribution
Booked Days Distribution
Booking Pattern Insights for Dover Township
- The most common availability pattern in Dover Township falls within the 271-366 days range, representing 44.4% of listings. This suggests many properties have significant open periods on their calendars.
- Approximately 72.2% of listings show high availability (181+ days open annually), indicating potential for increased bookings or specific owner usage patterns.
- For booked days, the 31-90 days range is most frequent in Dover Township (33.3%), reflecting common guest stay durations or potential owner blocking patterns.
- A notable 27.8% of properties secure long booking periods (181+ days booked per year), highlighting successful long-term rental strategies or significant owner usage.
Dover Township Airbnb Minimum Stay Requirements Analysis
Distribution of Listings by Minimum Night Requirement
1 Night
2 listings
11.1% of total
2 Nights
9 listings
50% of total
30+ Nights
7 listings
38.9% of total
Key Insights
- The most prevalent minimum stay requirement in Dover Township is 2 Nights, adopted by 50% of listings. This highlights the market's preference for shorter, flexible bookings.
- A strong majority (61.1%) of the Dover Township Airbnb data shows acceptance of very short stays (1-2 nights), indicating a dynamic, high-turnover market.
- A significant segment (38.9%) caters to monthly stays (30+ nights) in Dover Township, pointing to opportunities in the extended-stay market.
Recommendations
- Align with the market by considering a 2 Nights minimum stay, as 50% of Dover Township hosts use this setting.
- If feasible, allowing 1-night stays, especially midweek or during low season, could capture last-minute bookings, as only 11.1% currently do.
- A 2-night minimum appears standard (50%). Consider this for weekends or peak periods.
- Explore offering discounts for stays of 30+ nights to attract the 38.9% of the market seeking extended stays.
- Adjust minimum nights based on seasonality – potentially shorter during low season and longer during peak demand periods in Dover Township.
Dover Township Airbnb Cancellation Policy Trends Analysis (2025)
Flexible
3 listings
16.7% of total
Moderate
6 listings
33.3% of total
Firm
8 listings
44.4% of total
Strict
1 listings
5.6% of total
Cancellation Policy Insights for Dover Township
- The prevailing Airbnb cancellation policy trend in Dover Township is Firm, used by 44.4% of listings.
- There's a relatively balanced mix between guest-friendly (50.0%) and stricter (50.0%) policies, offering choices for different guest needs.
- Strict cancellation policies are quite rare (5.6%), potentially making listings with this policy less competitive unless justified by high demand or property type.
Recommendations for Hosts
- Consider adopting a Firm policy to align with the 44.4% market standard in Dover Township.
- Using a Strict policy might deter some guests, as only 5.6% of listings use it. Evaluate if potential revenue protection outweighs possible lower booking rates.
- Regularly review your cancellation policy against competitors and market demand shifts in Dover Township.
Dover Township STR Booking Lead Time Analysis (2025)
Average Booking Lead Time by Month
Booking Lead Time Insights for Dover Township
- The overall average booking lead time for vacation rentals in Dover Township is 52 days.
- Guests book furthest in advance for stays during April (average 104 days), likely coinciding with peak travel demand or local events.
- The shortest booking windows occur for stays in March (average 22 days), indicating more last-minute travel plans during this time.
- Seasonally, Spring (65 days avg.) sees the longest lead times, while Winter (38 days avg.) has the shortest, reflecting typical travel planning cycles.
Recommendations for Hosts
- Use the overall average lead time (52 days) as a baseline for your pricing and availability strategy in Dover Township.
- For April stays, consider implementing length-of-stay discounts or slightly higher rates for bookings made less than 104 days out to capitalize on advance planning.
- Target marketing efforts for the Spring season well in advance (at least 65 days) to capture early planners.
- Monitor your own booking lead times against these Dover Township averages to identify opportunities for dynamic pricing adjustments.
Popular & Essential Airbnb Amenities in Dover Township (2025)
Amenity Prevalence
Amenity Insights for Dover Township
- Essential amenities in Dover Township that guests expect include: Heating, Free parking on premises, Smoke alarm. Lacking these (any) could significantly impact bookings.
- Popular amenities like Coffee maker, Hot water, Air conditioning are common but not universal. Offering these can provide a competitive edge.
Recommendations for Hosts
- Ensure your listing includes all essential amenities for Dover Township: Heating, Free parking on premises, Smoke alarm.
- Consider adding popular differentiators like Coffee maker or Hot water to increase appeal.
- Highlight unique or less common amenities you offer (e.g., hot tub, dedicated workspace, EV charger) in your listing description and photos.
- Regularly check competitor amenities in Dover Township to stay competitive.
Dover Township Airbnb Guest Demographics & Profile Analysis (2025)
Guest Profile Summary for Dover Township
- The typical guest profile for Airbnb in Dover Township consists of primarily domestic travelers (99%), often arriving from nearby Columbus, typically belonging to the Post-2000s (Gen Z/Alpha) group (50%), primarily speaking English or Spanish.
- Domestic travelers account for 99.1% of guests.
- Key international markets include United States (99.1%) and DC (0.9%).
- Top languages spoken are English (83.3%) followed by Spanish (5.9%).
- A significant demographic segment is the Post-2000s (Gen Z/Alpha) group, representing 50% of guests.
Recommendations for Hosts
- Target domestic marketing efforts towards travelers from Columbus and Cleveland.
- Tailor amenities and listing descriptions to appeal to the dominant Post-2000s (Gen Z/Alpha) demographic (e.g., highlight fast WiFi, smart home features, local guides).
- Highlight unique local experiences or amenities relevant to the primary guest profile.
- Consider seasonal promotions aligned with peak travel times for key origin markets.
Nearby Short-Term Rental Market Comparison
How does the Dover Township Airbnb market stack up against its neighbors? Compare key performance metrics like average monthly revenue, ADR, and occupancy rates in surrounding areas to understand the broader regional STR landscape.
| Market | Active Properties | Monthly Revenue | Daily Rate | Avg. Occupancy |
|---|---|---|---|---|
| Creola | 13 | $5,917 | $402.53 | 52% |
| Sugar Grove | 16 | $5,687 | $472.16 | 43% |
| Rockbridge | 214 | $5,122 | $403.12 | 47% |
| New Plymouth | 13 | $4,933 | $543.55 | 36% |
| Logan | 655 | $4,857 | $381.15 | 45% |
| Berne Township | 16 | $4,645 | $466.34 | 34% |
| South Bloomingville | 119 | $4,596 | $301.59 | 50% |
| Berlin Township | 12 | $4,580 | $371.66 | 42% |
| Swan Township | 112 | $4,563 | $334.00 | 49% |
| Laurelville | 138 | $4,349 | $340.95 | 44% |