Erie Township Airbnb Market Analysis 2026: Short Term Rental Data & Vacation Rental Statistics in Ohio, United States
Is Airbnb profitable in Erie Township in 2026? Explore comprehensive Airbnb analytics for Erie Township, Ohio, United States to uncover income potential. This 2026 STR market report for Erie Township, based on AirROI data from February 2025 to January 2026, reveals key trends in the niche market of 22 active listings.
Whether you're considering an Airbnb investment in Erie Township, optimizing your existing vacation rental, or exploring rental arbitrage opportunities, understanding the Erie Township Airbnb data is crucial. Leveraging the low regulation environment is key to maximizing your short term rental income potential. Let's dive into the specifics.
Key Erie Township Airbnb Performance Metrics Overview
Monthly Airbnb Revenue Variations & Income Potential in Erie Township (2026)
Understanding the monthly revenue variations for Airbnb listings in Erie Township is key to maximizing your short term rental income potential. Seasonality significantly impacts earnings. Our analysis, based on data from the past 12 months, shows that the peak revenue month for STRs in Erie Township is typically July, while February often presents the lowest earnings, highlighting opportunities for strategic pricing adjustments during shoulder and low seasons. Explore the typical Airbnb income in Erie Township across different performance tiers:
- Best-in-class properties (Top 10%) achieve $5,684+ monthly, often utilizing dynamic pricing and superior guest experiences.
- Strong performing properties (Top 25%) earn $4,528 or more, indicating effective management and desirable locations/amenities.
- Typical properties (Median) generate around $2,976 per month, representing the average market performance.
- Entry-level properties (Bottom 25%) see earnings around $1,733, often with potential for optimization.
Average Monthly Airbnb Earnings Trend in Erie Township
Erie Township Airbnb Occupancy Rate Trends (2026)
Maximize your bookings by understanding the Erie Township STR occupancy trends. Seasonal demand shifts significantly influence how often properties are booked. Typically, Julysees the highest demand (peak season occupancy), while December experiences the lowest (low season). Effective strategies, like adjusting minimum stays or offering promotions, can boost occupancy during slower periods. Here's how different property tiers perform in Erie Township:
- Best-in-class properties (Top 10%) achieve 76%+ occupancy, indicating high desirability and potentially optimized availability.
- Strong performing properties (Top 25%) maintain 57% or higher occupancy, suggesting good market fit and guest satisfaction.
- Typical properties (Median) have an occupancy rate around 42%.
- Entry-level properties (Bottom 25%) average 29% occupancy, potentially facing higher vacancy.
Average Monthly Occupancy Rate Trend in Erie Township
Average Daily Rate (ADR) Airbnb Trends in Erie Township (2026)
Effective short term rental pricing strategy in Erie Township involves understanding monthly ADR fluctuations. The Average Daily Rate (ADR) for Airbnb in Erie Township typically peaks in July and dips lowest during February. Leveraging Airbnb dynamic pricing tools or strategies based on this seasonality can significantly boost revenue. Here's a look at the typical nightly rates achieved:
- Best-in-class properties (Top 10%) command rates of $388+ per night, often due to premium features or locations.
- Strong performing properties (Top 25%) achieve nightly rates of $293 or more.
- Typical properties (Median) charge around $236 per night.
- Entry-level properties (Bottom 25%) earn around $173 per night.
Average Daily Rate (ADR) Trend by Month in Erie Township
Get Live Erie Township Market Intelligence 👇

Explore Real-time Analytics
Airbnb Seasonality Analysis & Trends in Erie Township (2026)
Peak Season (July, June, August)
- Revenue averages $5,683 per month
- Occupancy rates average 64.0%
- Daily rates average $282
Shoulder Season
- Revenue averages $2,965 per month
- Occupancy maintains around 42.9%
- Daily rates hold near $240
Low Season (February, March, December)
- Revenue drops to average $1,580 per month
- Occupancy decreases to average 28.4%
- Daily rates adjust to average $215
Seasonality Insights for Erie Township
- The Airbnb seasonality in Erie Township shows highly seasonal trends requiring careful strategy. While the sections above show seasonal averages, it's also insightful to look at the extremes:
- During the high season, the absolute peak month showcases Erie Township's highest earning potential, with monthly revenues capable of climbing to $6,859, occupancy reaching a high of 72.7%, and ADRs peaking at $285.
- Conversely, the slowest single month of the year, typically falling within the low season, marks the market's lowest point. In this month, revenue might dip to $1,418, occupancy could drop to 25.5%, and ADRs may adjust down to $194.
- Understanding both the seasonal averages and these monthly peaks and troughs in revenue, occupancy, and ADR is crucial for maximizing your Airbnb profit potential in Erie Township.
Seasonal Strategies for Maximizing Profit
- Peak Season: Maximize revenue through premium pricing and potentially longer minimum stays. Ensure high availability.
- Low Season: Offer competitive pricing, special promotions (e.g., extended stay discounts), and flexible cancellation policies. Target off-season travelers like remote workers or budget-conscious guests.
- Shoulder Seasons: Implement dynamic pricing that balances peak and low rates. Target weekend travelers or specific events. Offer slightly more flexible terms than peak season.
- Regularly analyze your own performance against these Erie Township seasonality benchmarks and adjust your pricing and availability strategy accordingly.
Best Areas for Airbnb Investment in Erie Township (2026)
Exploring the top neighborhoods for short-term rentals in Erie Township? This section highlights key areas, outlining why they are attractive for hosts and guests, along with notable local attractions. Consider these locations based on your target guest profile and investment strategy.
| Neighborhood / Area | Why Host Here? (Target Guests & Appeal) | Key Attractions & Landmarks |
|---|---|---|
| Lake Erie Shoreline | A picturesque area that offers beautiful waterfront views and opportunities for water sports and fishing. This location attracts families and tourists looking for a serene escape. | Lake Erie, Geneva State Park, Ashtabula Harbor, State Park Marina, Local wineries |
| Conneaut Lake | Known for its scenic beauty and recreational activities, Conneaut Lake is a charming destination that draws visitors for its lake activities and family-friendly environment. | Conneaut Lake Park, Swimming and boating, Picnic areas, Hiking trails |
| Erie Maritime Museum | This area provides insights into Erie’s rich maritime history and attracts history buffs and those interested in the culture of the Great Lakes. | Erie Maritime Museum, Tall Ships Challenge, Presque Isle Lighthouse, Port Erie Plastics |
| Presque Isle State Park | An outdoor paradise, this area is perfect for tourists who love nature, hiking, and beach activities right on the shores of Lake Erie. | Presque Isle State Park, Beaches, Hiking trails, Biking paths, Bird watching |
| Downtown Erie | The bustling center of Erie offers shopping, dining, and entertainment, attracting urban visitors and business professionals. | Erie Art Museum, Playhouse Square, Local shops, Restaurants and bars, Cultural events |
| Edinboro | Home to Edinboro University, this quaint town draws students and young travelers looking for affordable lodging options close to campus. | Edinboro University, Edinboro Lake, Local art galleries, Annual festivals |
| Harborcreek | A suburban area close to Erie, offering a quieter retreat while still being accessible to city amenities, ideal for families. | Harborcreek Park, Local farms, Community events |
| Flagship City | This area encompasses many attractions and historical sites, making it a convenient base for tourists exploring Erie County. | Erie County Historical Society, Local breweries, Bike trails, Family-friendly activities |
Understanding Airbnb License Requirements & STR Laws in Erie Township (2026)
While Erie Township, Ohio, United States currently shows low STR regulations, specific Airbnb license requirements might still exist or change. Always verify the latest short term rental regulations and Airbnb license requirements directly with local government authorities for Erie Township to ensure full compliance before hosting.
(Source: AirROI data, 2026, finding no licensed listings among those analyzed)
Top Performing Airbnb Properties in Erie Township (2026)
Benchmark your potential! Explore examples of top-performing Airbnb properties in Erie Townshipbased on Trailing Twelve Month (TTM) revenue. Analyze their characteristics, revenue, occupancy rate, and ADR to understand what drives success in this market.
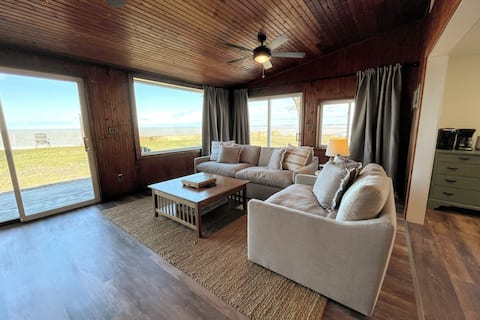
LAKEFRONT COTTAGE! Hot Tub, Spacious Backyard
Entire Place • 3 bedrooms

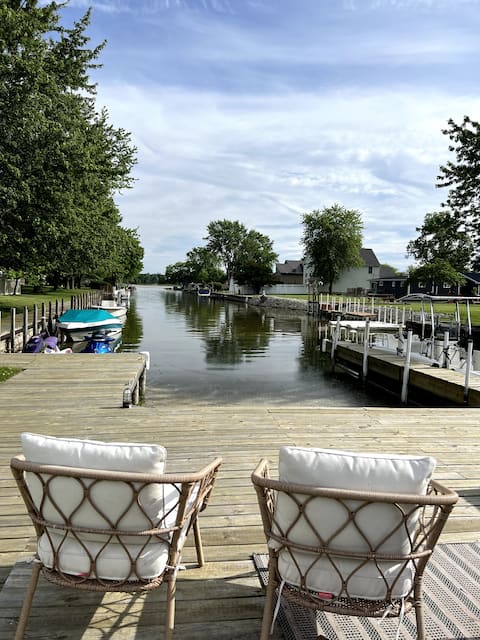
Lakefront Home - Watch the Sunset on the Lake!
Entire Place • 2 bedrooms
Hot Tub, Lake Access, & Dock: Port Clinton Retreat
Entire Place • 3 bedrooms
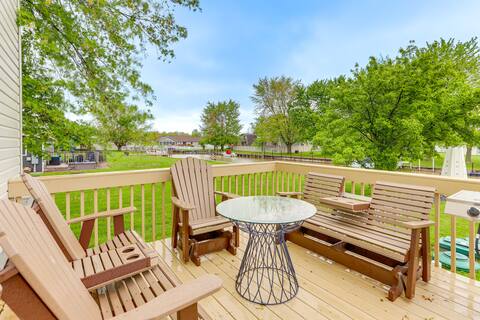
Canal Retreat fishing, Cedar Point, Islands, dock
Entire Place • 3 bedrooms

Welcoming Port Clinton Vacation Rental!
Entire Place • 3 bedrooms

5 Mi to Lake: Port Clinton Home w/ Gazebo & Grill!
Entire Place • 3 bedrooms
Note: Performance varies based on location, size, amenities, seasonality, and management quality. Data reflects the past 12 months.
Top Performing Airbnb Hosts in Erie Township (2026)
Learn from the best! This table showcases top-performing Airbnb hosts in Erie Township based on the number of properties managed and estimated total revenue over the past year. Analyze their scale and performance metrics.
| Host Name | Properties | Grossing Revenue | Stay Reviews | Avg Rating |
|---|---|---|---|---|
| Kelsey & Austin | 3 | $166,592 | 1120 | 4.84/5.0 |
| Evolve | 4 | $154,846 | 164 | 4.83/5.0 |
| Evolve | 2 | $78,295 | 72 | 4.89/5.0 |
| Alana | 1 | $52,007 | 75 | 4.99/5.0 |
| Tammy | 2 | $47,316 | 52 | 4.42/5.0 |
| Patricia | 1 | $40,697 | 129 | 4.88/5.0 |
| Lori | 1 | $35,987 | 88 | 4.94/5.0 |
| Raven | 1 | $30,444 | 65 | 4.63/5.0 |
| Branson | 1 | $28,445 | 29 | 4.86/5.0 |
| Jen | 1 | $21,628 | 43 | 4.93/5.0 |
Analyzing the strategies of top hosts, such as their property selection, pricing, and guest communication, can offer valuable lessons for optimizing your own Airbnb operations in Erie Township.
Dive Deeper: Advanced Erie Township STR Market Data (2026)
Ready to unlock more insights? AirROI provides access to advanced metrics and comprehensive Airbnb data for Erie Township. Explore detailed analytics beyond this report to refine your investment strategy, optimize pricing, and maximize your vacation rental profits.
Explore Advanced MetricsErie Township Short-Term Rental Market Composition (2026): Property & Room Types
Room Type Distribution
Property Type Distribution
Market Composition Insights for Erie Township
- The Erie Township Airbnb market composition is heavily skewed towards Entire Home/Apt listings, which make up 100% of the 22 active rentals. This indicates strong guest preference for privacy and space.
- Looking at the property type distribution in Erie Township, House properties are the most common (90.9%), reflecting the local real estate landscape.
- Houses represent a significant 90.9% portion, catering likely to families or larger groups.
Erie Township Airbnb Room Capacity Analysis (2026): Bedroom Distribution
Distribution of Listings by Number of Bedrooms
Room Capacity Insights for Erie Township
- The dominant room capacity in Erie Township is 3 bedrooms listings, making up 54.5% of the market. This suggests a strong demand for properties suitable for families or small groups.
- Together, 3 bedrooms and 2 bedrooms properties represent 86.3% of the active Airbnb listings in Erie Township, indicating a high concentration in these sizes.
- A significant 63.6% of listings offer 3+ bedrooms, catering to larger groups and families seeking more space in Erie Township.
Erie Township Vacation Rental Guest Capacity Trends (2026)
Distribution of Listings by Guest Capacity
Guest Capacity Insights for Erie Township
- The most common guest capacity trend in Erie Township vacation rentals is listings accommodating 8+ guests (50%). This suggests the primary traveler segment is likely larger groups.
- Properties designed for 8+ guests and 6 guests dominate the Erie Township STR market, accounting for 81.8% of listings.
- 86.3% of properties accommodate 6+ guests, serving the market segment for larger families or group travel in Erie Township.
- On average, properties in Erie Township are equipped to host 6.8 guests.
Erie Township Airbnb Booking Patterns (2026): Available vs. Booked Days
Available Days Distribution
Booked Days Distribution
Booking Pattern Insights for Erie Township
- The most common availability pattern in Erie Township falls within the 181-270 days range, representing 59.1% of listings. This suggests many properties have significant open periods on their calendars.
- Approximately 86.4% of listings show high availability (181+ days open annually), indicating potential for increased bookings or specific owner usage patterns.
- For booked days, the 91-180 days range is most frequent in Erie Township (63.6%), reflecting common guest stay durations or potential owner blocking patterns.
- A notable 13.6% of properties secure long booking periods (181+ days booked per year), highlighting successful long-term rental strategies or significant owner usage.
Erie Township Airbnb Minimum Stay Requirements Analysis
Distribution of Listings by Minimum Night Requirement
1 Night
4 listings
18.2% of total
2 Nights
15 listings
68.2% of total
30+ Nights
3 listings
13.6% of total
Key Insights
- The most prevalent minimum stay requirement in Erie Township is 2 Nights, adopted by 68.2% of listings. This highlights the market's preference for shorter, flexible bookings.
- A strong majority (86.4%) of the Erie Township Airbnb data shows acceptance of very short stays (1-2 nights), indicating a dynamic, high-turnover market.
- A significant segment (13.6%) caters to monthly stays (30+ nights) in Erie Township, pointing to opportunities in the extended-stay market.
Recommendations
- Align with the market by considering a 2 Nights minimum stay, as 68.2% of Erie Township hosts use this setting.
- If feasible, allowing 1-night stays, especially midweek or during low season, could capture last-minute bookings, as only 18.2% currently do.
- A 2-night minimum appears standard (68.2%). Consider this for weekends or peak periods.
- Explore offering discounts for stays of 30+ nights to attract the 13.6% of the market seeking extended stays.
- Adjust minimum nights based on seasonality – potentially shorter during low season and longer during peak demand periods in Erie Township.
Erie Township Airbnb Cancellation Policy Trends Analysis (2026)
Flexible
3 listings
13.6% of total
Moderate
7 listings
31.8% of total
Firm
4 listings
18.2% of total
Strict
8 listings
36.4% of total
Cancellation Policy Insights for Erie Township
- The prevailing Airbnb cancellation policy trend in Erie Township is Strict, used by 36.4% of listings.
- A majority (54.6%) of hosts in Erie Township utilize Firm or Strict policies, indicating a market where hosts prioritize booking security.
Recommendations for Hosts
- Consider adopting a Strict policy to align with the 36.4% market standard in Erie Township.
- With 36.4% using Strict terms, this is a viable option in Erie Township, particularly for high-value properties or during peak demand periods.
- Regularly review your cancellation policy against competitors and market demand shifts in Erie Township.
Erie Township STR Booking Lead Time Analysis (2026)
Average Booking Lead Time by Month
Booking Lead Time Insights for Erie Township
- The overall average booking lead time for vacation rentals in Erie Township is 80 days.
- Guests book furthest in advance for stays during June (average 107 days), likely coinciding with peak travel demand or local events.
- The shortest booking windows occur for stays in January (average 23 days), indicating more last-minute travel plans during this time.
- Seasonally, Summer (92 days avg.) sees the longest lead times, while Winter (34 days avg.) has the shortest, reflecting typical travel planning cycles.
Recommendations for Hosts
- Use the overall average lead time (80 days) as a baseline for your pricing and availability strategy in Erie Township.
- For June stays, consider implementing length-of-stay discounts or slightly higher rates for bookings made less than 107 days out to capitalize on advance planning.
- Target marketing efforts for the Summer season well in advance (at least 92 days) to capture early planners.
- Monitor your own booking lead times against these Erie Township averages to identify opportunities for dynamic pricing adjustments.
Popular & Essential Airbnb Amenities in Erie Township (2026)
Amenity Prevalence
Amenity Insights for Erie Township
- Essential amenities in Erie Township that guests expect include: Hot water, Free parking on premises, Kitchen, Air conditioning, Essentials, Wifi, Coffee maker, TV, Smoke alarm. Lacking these (any) could significantly impact bookings.
- Popular amenities like Dishes and silverware are common but not universal. Offering these can provide a competitive edge.
Recommendations for Hosts
- Ensure your listing includes all essential amenities for Erie Township: Hot water, Free parking on premises, Kitchen, Air conditioning, Essentials, Wifi, Coffee maker, TV, Smoke alarm.
- Prioritize adding missing essentials: Essentials, Wifi, Coffee maker, TV, Smoke alarm.
- Consider adding popular differentiators like Dishes and silverware to increase appeal.
- Highlight unique or less common amenities you offer (e.g., hot tub, dedicated workspace, EV charger) in your listing description and photos.
- Regularly check competitor amenities in Erie Township to stay competitive.
Erie Township Airbnb Guest Demographics & Profile Analysis (2026)
Guest Profile Summary for Erie Township
- The typical guest profile for Airbnb in Erie Township consists of primarily domestic travelers (98%), often arriving from nearby Columbus, typically belonging to the Post-2000s (Gen Z/Alpha) group (50%), primarily speaking English or Spanish.
- Domestic travelers account for 98.2% of guests.
- Key international markets include United States (98.2%) and Canada (0.9%).
- Top languages spoken are English (90.7%) followed by Spanish (5.8%).
- A significant demographic segment is the Post-2000s (Gen Z/Alpha) group, representing 50% of guests.
Recommendations for Hosts
- Target domestic marketing efforts towards travelers from Columbus and Cleveland.
- Tailor amenities and listing descriptions to appeal to the dominant Post-2000s (Gen Z/Alpha) demographic (e.g., highlight fast WiFi, smart home features, local guides).
- Highlight unique local experiences or amenities relevant to the primary guest profile.
- Consider seasonal promotions aligned with peak travel times for key origin markets.
Nearby Short-Term Rental Market Comparison
How does the Erie Township Airbnb market stack up against its neighbors? Compare key performance metrics like average monthly revenue, ADR, and occupancy rates in surrounding areas to understand the broader regional STR landscape.
| Market | Active Properties | Monthly Revenue | Daily Rate | Avg. Occupancy |
|---|---|---|---|---|
| Scio Township | 18 | $5,101 | $764.17 | 43% |
| Huron Township | 17 | $5,053 | $484.21 | 40% |
| Berlin Township | 11 | $5,023 | $386.97 | 46% |
| Marblehead | 12 | $4,522 | $595.67 | 39% |
| Grass Lake Charter Township | 14 | $4,410 | $365.88 | 45% |
| Ann Arbor | 487 | $4,080 | $443.76 | 43% |
| Erie Township | 10 | $3,857 | $246.01 | 51% |
| Huron | 127 | $3,854 | $378.44 | 41% |
| Norvell Township | 12 | $3,830 | $321.76 | 49% |
| Genoa Township | 12 | $3,790 | $344.44 | 43% |