Trimble Township Airbnb Market Analysis 2026: Short Term Rental Data & Vacation Rental Statistics in Ohio, United States
Is Airbnb profitable in Trimble Township in 2026? Explore comprehensive Airbnb analytics for Trimble Township, Ohio, United States to uncover income potential. This 2026 STR market report for Trimble Township, based on AirROI data from February 2025 to January 2026, reveals key trends in the niche market of 28 active listings.
Whether you're considering an Airbnb investment in Trimble Township, optimizing your existing vacation rental, or exploring rental arbitrage opportunities, understanding the Trimble Township Airbnb data is crucial. Leveraging the low regulation environment is key to maximizing your short term rental income potential. Let's dive into the specifics.
Key Trimble Township Airbnb Performance Metrics Overview
Monthly Airbnb Revenue Variations & Income Potential in Trimble Township (2026)
Understanding the monthly revenue variations for Airbnb listings in Trimble Township is key to maximizing your short term rental income potential. Seasonality significantly impacts earnings. Our analysis, based on data from the past 12 months, shows that the peak revenue month for STRs in Trimble Township is typically July, while February often presents the lowest earnings, highlighting opportunities for strategic pricing adjustments during shoulder and low seasons. Explore the typical Airbnb income in Trimble Township across different performance tiers:
- Best-in-class properties (Top 10%) achieve $6,446+ monthly, often utilizing dynamic pricing and superior guest experiences.
- Strong performing properties (Top 25%) earn $4,663 or more, indicating effective management and desirable locations/amenities.
- Typical properties (Median) generate around $2,610 per month, representing the average market performance.
- Entry-level properties (Bottom 25%) see earnings around $1,514, often with potential for optimization.
Average Monthly Airbnb Earnings Trend in Trimble Township
Trimble Township Airbnb Occupancy Rate Trends (2026)
Maximize your bookings by understanding the Trimble Township STR occupancy trends. Seasonal demand shifts significantly influence how often properties are booked. Typically, Julysees the highest demand (peak season occupancy), while January experiences the lowest (low season). Effective strategies, like adjusting minimum stays or offering promotions, can boost occupancy during slower periods. Here's how different property tiers perform in Trimble Township:
- Best-in-class properties (Top 10%) achieve 74%+ occupancy, indicating high desirability and potentially optimized availability.
- Strong performing properties (Top 25%) maintain 60% or higher occupancy, suggesting good market fit and guest satisfaction.
- Typical properties (Median) have an occupancy rate around 41%.
- Entry-level properties (Bottom 25%) average 24% occupancy, potentially facing higher vacancy.
Average Monthly Occupancy Rate Trend in Trimble Township
Average Daily Rate (ADR) Airbnb Trends in Trimble Township (2026)
Effective short term rental pricing strategy in Trimble Township involves understanding monthly ADR fluctuations. The Average Daily Rate (ADR) for Airbnb in Trimble Township typically peaks in June and dips lowest during February. Leveraging Airbnb dynamic pricing tools or strategies based on this seasonality can significantly boost revenue. Here's a look at the typical nightly rates achieved:
- Best-in-class properties (Top 10%) command rates of $401+ per night, often due to premium features or locations.
- Strong performing properties (Top 25%) achieve nightly rates of $252 or more.
- Typical properties (Median) charge around $203 per night.
- Entry-level properties (Bottom 25%) earn around $165 per night.
Average Daily Rate (ADR) Trend by Month in Trimble Township
Get Live Trimble Township Market Intelligence 👇

Explore Real-time Analytics
Airbnb Seasonality Analysis & Trends in Trimble Township (2026)
Peak Season (July, June, August)
- Revenue averages $4,548 per month
- Occupancy rates average 48.7%
- Daily rates average $284
Shoulder Season
- Revenue averages $3,237 per month
- Occupancy maintains around 42.3%
- Daily rates hold near $233
Low Season (January, February, April)
- Revenue drops to average $2,297 per month
- Occupancy decreases to average 35.5%
- Daily rates adjust to average $210
Seasonality Insights for Trimble Township
- The Airbnb seasonality in Trimble Township shows highly seasonal trends requiring careful strategy. While the sections above show seasonal averages, it's also insightful to look at the extremes:
- During the high season, the absolute peak month showcases Trimble Township's highest earning potential, with monthly revenues capable of climbing to $5,100, occupancy reaching a high of 51.7%, and ADRs peaking at $293.
- Conversely, the slowest single month of the year, typically falling within the low season, marks the market's lowest point. In this month, revenue might dip to $1,994, occupancy could drop to 32.4%, and ADRs may adjust down to $196.
- Understanding both the seasonal averages and these monthly peaks and troughs in revenue, occupancy, and ADR is crucial for maximizing your Airbnb profit potential in Trimble Township.
Seasonal Strategies for Maximizing Profit
- Peak Season: Maximize revenue through premium pricing and potentially longer minimum stays. Ensure high availability.
- Low Season: Offer competitive pricing, special promotions (e.g., extended stay discounts), and flexible cancellation policies. Target off-season travelers like remote workers or budget-conscious guests.
- Shoulder Seasons: Implement dynamic pricing that balances peak and low rates. Target weekend travelers or specific events. Offer slightly more flexible terms than peak season.
- Regularly analyze your own performance against these Trimble Township seasonality benchmarks and adjust your pricing and availability strategy accordingly.
Best Areas for Airbnb Investment in Trimble Township (2026)
Exploring the top neighborhoods for short-term rentals in Trimble Township? This section highlights key areas, outlining why they are attractive for hosts and guests, along with notable local attractions. Consider these locations based on your target guest profile and investment strategy.
| Neighborhood / Area | Why Host Here? (Target Guests & Appeal) | Key Attractions & Landmarks |
|---|---|---|
| Cincinnati | A vibrant city with rich history and culture, offering various attractions that draw in both business travelers and tourists. With its burgeoning food scene and proximity to attractions, it's a prime location for Airbnb. | Cincinnati Zoo & Botanical Garden, Fountain Square, Findlay Market, Cincinnati Art Museum, Krohn Conservatory |
| Dayton | Known for its aviation history and innovation, Dayton attracts tourists interested in museums and parks. A growing interest in short-term rentals is making it an ideal location for hosting. | National Museum of the U.S. Air Force, Carillon Historical Park, Oregon District, Dayton Dragons, Five Rivers MetroParks |
| Yellow Springs | A charming village known for its arts and eclectic community, Yellow Springs is popular among visitors looking for a unique getaway, outdoor activities, and a vibrant cultural scene. | Glen Helen Nature Preserve, Yellow Springs Brewing Company, Little Miami Scenic Trail, Antioch College, The Yellow Springs Art Council |
| Hocking Hills | Famous for its stunning natural scenery and outdoor activities, Hocking Hills is a top destination for nature lovers, making it a great area for investing in vacation rentals. | Hocking Hills State Park, Old Man's Cave, Cedar Falls, Rock Bridge, Ash Cave |
| Cleveland | A major city on Lake Erie known for its cultural institutions, Cleveland attracts both leisure and business travelers, making it a strong candidate for Airbnb listings. | Rock and Roll Hall of Fame, Cleveland Museum of Art, West Side Market, Cleveland Botanical Garden, Lake Erie |
| Columbus | The state capital and a growing hub for technology and education, Columbus has a diverse population and offers various activities and attractions for visitors. | Columbus Zoo and Aquarium, COSI Science Center, Franklin Park Conservatory, German Village, Ohio State University |
| Chillicothe | Rich in history and known as Ohio's first capital, Chillicothe offers unique historical attractions and is an appealing spot for those wanting a quieter stay. | Hopewell Culture National Historical Park, Adena Mansion and Gardens, Chillicothe Yellow Breeches, Pump House Center for the Arts, Yoctangee Park |
| Marietta | Located along the Ohio River, Marietta is a historic town with charming architecture and outdoor activities, attracting visitors looking for a scenic retreat. | Parkersburg Bridge, Marietta College, Ohio River Museum, Historic Harmar Village, Mound Cemetery |
Understanding Airbnb License Requirements & STR Laws in Trimble Township (2026)
While Trimble Township, Ohio, United States currently shows low STR regulations, specific Airbnb license requirements might still exist or change. Always verify the latest short term rental regulations and Airbnb license requirements directly with local government authorities for Trimble Township to ensure full compliance before hosting.
(Source: AirROI data, 2026, finding no licensed listings among those analyzed)
Top Performing Airbnb Properties in Trimble Township (2026)
Benchmark your potential! Explore examples of top-performing Airbnb properties in Trimble Townshipbased on Trailing Twelve Month (TTM) revenue. Analyze their characteristics, revenue, occupancy rate, and ADR to understand what drives success in this market.
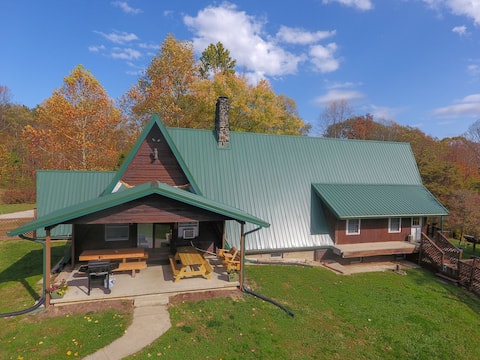
Luxury Lodge | Hocking Hills Pool, Hot Tub & Lake
Entire Place • 5 bedrooms

Lux Cabin: Theater, Games, Firepit & Hot Tub
Entire Place • 4 bedrooms

Luxury Cabin Hocking Hills with Pool & Hot Tub!
Entire Place • 4 bedrooms

Pet Friendly Luxury Log Cabin | near Hocking Hills
Entire Place • 5 bedrooms

Hidden Gem-Log Cabin on 56 Acres
Entire Place • 2 bedrooms

Lodge near Hocking Hills w/ Pool, Hot Tub & views
Entire Place • 3 bedrooms
Note: Performance varies based on location, size, amenities, seasonality, and management quality. Data reflects the past 12 months.
Top Performing Airbnb Hosts in Trimble Township (2026)
Learn from the best! This table showcases top-performing Airbnb hosts in Trimble Township based on the number of properties managed and estimated total revenue over the past year. Analyze their scale and performance metrics.
| Host Name | Properties | Grossing Revenue | Stay Reviews | Avg Rating |
|---|---|---|---|---|
| 1st Choice Cabin Rentals | 9 | $429,370 | 640 | 4.61/5.0 |
| Ashley And Clint | 1 | $91,314 | 93 | 4.97/5.0 |
| Trisha | 2 | $84,516 | 187 | 4.80/5.0 |
| Scott | 1 | $67,580 | 74 | 4.97/5.0 |
| Nicholas | 1 | $50,609 | 106 | 4.98/5.0 |
| Hope | 1 | $35,932 | 47 | 4.98/5.0 |
| Josh | 1 | $34,737 | 70 | 4.86/5.0 |
| Kevin | 1 | $32,722 | 30 | 5.00/5.0 |
| Luke | 2 | $31,023 | 163 | 4.64/5.0 |
| Dave | 1 | $29,980 | 106 | 4.95/5.0 |
Analyzing the strategies of top hosts, such as their property selection, pricing, and guest communication, can offer valuable lessons for optimizing your own Airbnb operations in Trimble Township.
Dive Deeper: Advanced Trimble Township STR Market Data (2026)
Ready to unlock more insights? AirROI provides access to advanced metrics and comprehensive Airbnb data for Trimble Township. Explore detailed analytics beyond this report to refine your investment strategy, optimize pricing, and maximize your vacation rental profits.
Explore Advanced MetricsTrimble Township Short-Term Rental Market Composition (2026): Property & Room Types
Room Type Distribution
Property Type Distribution
Market Composition Insights for Trimble Township
- The Trimble Township Airbnb market composition is heavily skewed towards Entire Home/Apt listings, which make up 100% of the 28 active rentals. This indicates strong guest preference for privacy and space.
- Looking at the property type distribution in Trimble Township, Outdoor/Unique properties are the most common (67.9%), reflecting the local real estate landscape.
- Houses represent a significant 32.1% portion, catering likely to families or larger groups.
Trimble Township Airbnb Room Capacity Analysis (2026): Bedroom Distribution
Distribution of Listings by Number of Bedrooms
Room Capacity Insights for Trimble Township
- The dominant room capacity in Trimble Township is 2 bedrooms listings, making up 39.3% of the market. This suggests a strong demand for properties suitable for couples or solo travelers.
- Together, 2 bedrooms and 3 bedrooms properties represent 60.7% of the active Airbnb listings in Trimble Township, indicating a high concentration in these sizes.
- A significant 46.4% of listings offer 3+ bedrooms, catering to larger groups and families seeking more space in Trimble Township.
Trimble Township Vacation Rental Guest Capacity Trends (2026)
Distribution of Listings by Guest Capacity
Guest Capacity Insights for Trimble Township
- The most common guest capacity trend in Trimble Township vacation rentals is listings accommodating 8+ guests (39.3%). This suggests the primary traveler segment is likely larger groups.
- Properties designed for 8+ guests and 6 guests dominate the Trimble Township STR market, accounting for 71.4% of listings.
- 75.0% of properties accommodate 6+ guests, serving the market segment for larger families or group travel in Trimble Township.
- On average, properties in Trimble Township are equipped to host 6.2 guests.
Trimble Township Airbnb Booking Patterns (2026): Available vs. Booked Days
Available Days Distribution
Booked Days Distribution
Booking Pattern Insights for Trimble Township
- The most common availability pattern in Trimble Township falls within the 271-366 days range, representing 35.7% of listings. This suggests many properties have significant open periods on their calendars.
- Approximately 67.8% of listings show high availability (181+ days open annually), indicating potential for increased bookings or specific owner usage patterns.
- For booked days, the 91-180 days range is most frequent in Trimble Township (32.1%), reflecting common guest stay durations or potential owner blocking patterns.
- A notable 32.2% of properties secure long booking periods (181+ days booked per year), highlighting successful long-term rental strategies or significant owner usage.
Trimble Township Airbnb Minimum Stay Requirements Analysis
Distribution of Listings by Minimum Night Requirement
1 Night
3 listings
10.7% of total
2 Nights
19 listings
67.9% of total
30+ Nights
6 listings
21.4% of total
Key Insights
- The most prevalent minimum stay requirement in Trimble Township is 2 Nights, adopted by 67.9% of listings. This highlights the market's preference for shorter, flexible bookings.
- A strong majority (78.6%) of the Trimble Township Airbnb data shows acceptance of very short stays (1-2 nights), indicating a dynamic, high-turnover market.
- A significant segment (21.4%) caters to monthly stays (30+ nights) in Trimble Township, pointing to opportunities in the extended-stay market.
Recommendations
- Align with the market by considering a 2 Nights minimum stay, as 67.9% of Trimble Township hosts use this setting.
- If feasible, allowing 1-night stays, especially midweek or during low season, could capture last-minute bookings, as only 10.7% currently do.
- A 2-night minimum appears standard (67.9%). Consider this for weekends or peak periods.
- Explore offering discounts for stays of 30+ nights to attract the 21.4% of the market seeking extended stays.
- Adjust minimum nights based on seasonality – potentially shorter during low season and longer during peak demand periods in Trimble Township.
Trimble Township Airbnb Cancellation Policy Trends Analysis (2026)
Super Strict 60 Days
2 listings
7.1% of total
Moderate
5 listings
17.9% of total
Firm
19 listings
67.9% of total
Strict
2 listings
7.1% of total
Cancellation Policy Insights for Trimble Township
- The prevailing Airbnb cancellation policy trend in Trimble Township is Firm, used by 67.9% of listings.
- A majority (75.0%) of hosts in Trimble Township utilize Firm or Strict policies, indicating a market where hosts prioritize booking security.
- Strict cancellation policies are quite rare (7.1%), potentially making listings with this policy less competitive unless justified by high demand or property type.
Recommendations for Hosts
- Consider adopting a Firm policy to align with the 67.9% market standard in Trimble Township.
- Using a Strict policy might deter some guests, as only 7.1% of listings use it. Evaluate if potential revenue protection outweighs possible lower booking rates.
- Regularly review your cancellation policy against competitors and market demand shifts in Trimble Township.
Trimble Township STR Booking Lead Time Analysis (2026)
Average Booking Lead Time by Month
Booking Lead Time Insights for Trimble Township
- The overall average booking lead time for vacation rentals in Trimble Township is 52 days.
- Guests book furthest in advance for stays during November (average 87 days), likely coinciding with peak travel demand or local events.
- The shortest booking windows occur for stays in February (average 25 days), indicating more last-minute travel plans during this time.
- Seasonally, Fall (71 days avg.) sees the longest lead times, while Winter (34 days avg.) has the shortest, reflecting typical travel planning cycles.
Recommendations for Hosts
- Use the overall average lead time (52 days) as a baseline for your pricing and availability strategy in Trimble Township.
- For November stays, consider implementing length-of-stay discounts or slightly higher rates for bookings made less than 87 days out to capitalize on advance planning.
- Target marketing efforts for the Fall season well in advance (at least 71 days) to capture early planners.
- Monitor your own booking lead times against these Trimble Township averages to identify opportunities for dynamic pricing adjustments.
Popular & Essential Airbnb Amenities in Trimble Township (2026)
Amenity Prevalence
No amenities with partial availability (less than 100%) were found to display in the chart. All essential amenities might be present in all listings. Check insights below.
Amenity Insights for Trimble Township
- Essential amenities in Trimble Township that guests expect include: TV, Air conditioning, Smoke alarm, Bed linens, Kitchen, Dishes and silverware, Heating, Coffee maker, Free parking on premises, Cooking basics. Lacking these (any) could significantly impact bookings.
Recommendations for Hosts
- Ensure your listing includes all essential amenities for Trimble Township: TV, Air conditioning, Smoke alarm, Bed linens, Kitchen, Dishes and silverware, Heating, Coffee maker, Free parking on premises, Cooking basics.
- Highlight unique or less common amenities you offer (e.g., hot tub, dedicated workspace, EV charger) in your listing description and photos.
- Regularly check competitor amenities in Trimble Township to stay competitive.
Trimble Township Airbnb Guest Demographics & Profile Analysis (2026)
Guest Profile Summary for Trimble Township
- The typical guest profile for Airbnb in Trimble Township consists of primarily domestic travelers (99%), often arriving from nearby Columbus, typically belonging to the Post-2000s (Gen Z/Alpha) group (50%), primarily speaking English or Spanish.
- Domestic travelers account for 99.0% of guests.
- Key international markets include United States (99%) and DC (0.5%).
- Top languages spoken are English (86.4%) followed by Spanish (7.4%).
- A significant demographic segment is the Post-2000s (Gen Z/Alpha) group, representing 50% of guests.
Recommendations for Hosts
- Target domestic marketing efforts towards travelers from Columbus and Cincinnati.
- Tailor amenities and listing descriptions to appeal to the dominant Post-2000s (Gen Z/Alpha) demographic (e.g., highlight fast WiFi, smart home features, local guides).
- Highlight unique local experiences or amenities relevant to the primary guest profile.
- Consider seasonal promotions aligned with peak travel times for key origin markets.
Nearby Short-Term Rental Market Comparison
How does the Trimble Township Airbnb market stack up against its neighbors? Compare key performance metrics like average monthly revenue, ADR, and occupancy rates in surrounding areas to understand the broader regional STR landscape.
| Market | Active Properties | Monthly Revenue | Daily Rate | Avg. Occupancy |
|---|---|---|---|---|
| Sugar Grove | 16 | $6,172 | $489.99 | 43% |
| Creola | 18 | $5,899 | $403.00 | 53% |
| Hocking County | 11 | $5,712 | $508.21 | 49% |
| Rockbridge | 229 | $5,257 | $400.48 | 46% |
| Berlin Township | 11 | $5,023 | $386.97 | 46% |
| Logan | 688 | $4,907 | $388.67 | 45% |
| Berne Township | 15 | $4,897 | $490.66 | 37% |
| Swan Township | 111 | $4,727 | $334.40 | 49% |
| South Bloomingville | 129 | $4,565 | $312.34 | 48% |
| Laurelville | 145 | $4,519 | $348.68 | 45% |