Urbana Airbnb Market Analysis 2026: Short Term Rental Data & Vacation Rental Statistics in Ohio, United States
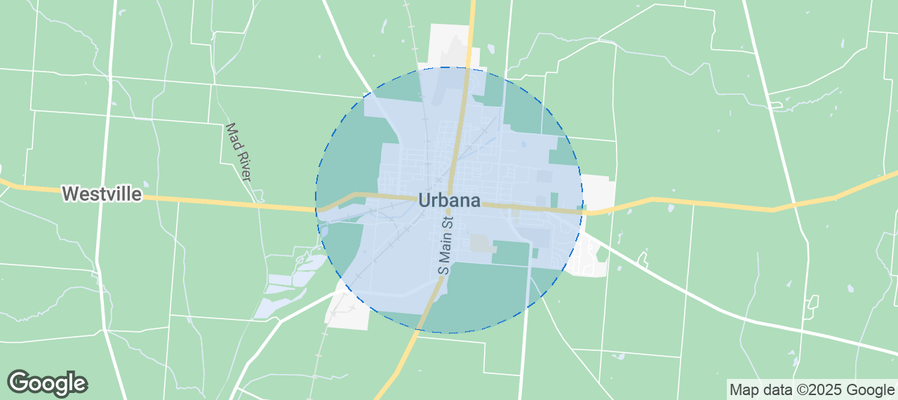
Is Airbnb profitable in Urbana in 2026? Explore comprehensive Airbnb analytics for Urbana, Ohio, United States to uncover income potential. This 2026 STR market report for Urbana, based on AirROI data from February 2025 to January 2026, reveals key trends in the niche market of 21 active listings.
Whether you're considering an Airbnb investment in Urbana, optimizing your existing vacation rental, or exploring rental arbitrage opportunities, understanding the Urbana Airbnb data is crucial. Leveraging the low regulation environment is key to maximizing your short term rental income potential. Let's dive into the specifics.
Key Urbana Airbnb Performance Metrics Overview
Monthly Airbnb Revenue Variations & Income Potential in Urbana (2026)
Understanding the monthly revenue variations for Airbnb listings in Urbana is key to maximizing your short term rental income potential. Seasonality significantly impacts earnings. Our analysis, based on data from the past 12 months, shows that the peak revenue month for STRs in Urbana is typically June, while January often presents the lowest earnings, highlighting opportunities for strategic pricing adjustments during shoulder and low seasons. Explore the typical Airbnb income in Urbana across different performance tiers:
- Best-in-class properties (Top 10%) achieve $3,801+ monthly, often utilizing dynamic pricing and superior guest experiences.
- Strong performing properties (Top 25%) earn $2,640 or more, indicating effective management and desirable locations/amenities.
- Typical properties (Median) generate around $1,816 per month, representing the average market performance.
- Entry-level properties (Bottom 25%) see earnings around $834, often with potential for optimization.
Average Monthly Airbnb Earnings Trend in Urbana
Urbana Airbnb Occupancy Rate Trends (2026)
Maximize your bookings by understanding the Urbana STR occupancy trends. Seasonal demand shifts significantly influence how often properties are booked. Typically, Junesees the highest demand (peak season occupancy), while January experiences the lowest (low season). Effective strategies, like adjusting minimum stays or offering promotions, can boost occupancy during slower periods. Here's how different property tiers perform in Urbana:
- Best-in-class properties (Top 10%) achieve 87%+ occupancy, indicating high desirability and potentially optimized availability.
- Strong performing properties (Top 25%) maintain 66% or higher occupancy, suggesting good market fit and guest satisfaction.
- Typical properties (Median) have an occupancy rate around 42%.
- Entry-level properties (Bottom 25%) average 23% occupancy, potentially facing higher vacancy.
Average Monthly Occupancy Rate Trend in Urbana
Average Daily Rate (ADR) Airbnb Trends in Urbana (2026)
Effective short term rental pricing strategy in Urbana involves understanding monthly ADR fluctuations. The Average Daily Rate (ADR) for Airbnb in Urbana typically peaks in July and dips lowest during March. Leveraging Airbnb dynamic pricing tools or strategies based on this seasonality can significantly boost revenue. Here's a look at the typical nightly rates achieved:
- Best-in-class properties (Top 10%) command rates of $180+ per night, often due to premium features or locations.
- Strong performing properties (Top 25%) achieve nightly rates of $150 or more.
- Typical properties (Median) charge around $121 per night.
- Entry-level properties (Bottom 25%) earn around $109 per night.
Average Daily Rate (ADR) Trend by Month in Urbana
Get Live Urbana Market Intelligence 👇
Explore Real-time Analytics
Airbnb Seasonality Analysis & Trends in Urbana (2026)
Peak Season (June, October, July)
- Revenue averages $2,516 per month
- Occupancy rates average 53.6%
- Daily rates average $142
Shoulder Season
- Revenue averages $1,963 per month
- Occupancy maintains around 46.3%
- Daily rates hold near $135
Low Season (January, February, December)
- Revenue drops to average $1,314 per month
- Occupancy decreases to average 33.0%
- Daily rates adjust to average $132
Seasonality Insights for Urbana
- The Airbnb seasonality in Urbana shows highly seasonal trends requiring careful strategy. While the sections above show seasonal averages, it's also insightful to look at the extremes:
- During the high season, the absolute peak month showcases Urbana's highest earning potential, with monthly revenues capable of climbing to $2,680, occupancy reaching a high of 56.7%, and ADRs peaking at $144.
- Conversely, the slowest single month of the year, typically falling within the low season, marks the market's lowest point. In this month, revenue might dip to $973, occupancy could drop to 24.8%, and ADRs may adjust down to $128.
- Understanding both the seasonal averages and these monthly peaks and troughs in revenue, occupancy, and ADR is crucial for maximizing your Airbnb profit potential in Urbana.
Seasonal Strategies for Maximizing Profit
- Peak Season: Maximize revenue through premium pricing and potentially longer minimum stays. Ensure high availability.
- Low Season: Offer competitive pricing, special promotions (e.g., extended stay discounts), and flexible cancellation policies. Target off-season travelers like remote workers or budget-conscious guests.
- Shoulder Seasons: Implement dynamic pricing that balances peak and low rates. Target weekend travelers or specific events. Offer slightly more flexible terms than peak season.
- Regularly analyze your own performance against these Urbana seasonality benchmarks and adjust your pricing and availability strategy accordingly.
Best Areas for Airbnb Investment in Urbana (2026)
Exploring the top neighborhoods for short-term rentals in Urbana? This section highlights key areas, outlining why they are attractive for hosts and guests, along with notable local attractions. Consider these locations based on your target guest profile and investment strategy.
| Neighborhood / Area | Why Host Here? (Target Guests & Appeal) | Key Attractions & Landmarks |
|---|---|---|
| Downtown Urbana | The heart of Urbana, offering a blend of historical charm and modern amenities. This area is becoming popular for both tourists and business travelers alike, with various dining and shopping options available. | Urbana Landmark Company, The Historic Courthouse, Urbana University, Veterans Park, Urbana Public Library |
| Urbana University area | Close to the university, this location attracts students, families visiting students, and university staff. It offers convenient access to campus events and nearby eateries. | Urbana University Campus, Student events, Cafes and bistros, Local parks |
| East Main Street | A main thoroughfare in Urbana that features a variety of local businesses and eateries. It is easily accessible and offers a more suburban feel. | Local shops, Family-friendly restaurants, Urbana Antique Mall, Nearby parks |
| Urbana's Historic District | Rich in history and character, this district is popular among visitors looking for charm and unique accommodations. The historic homes and architecture are a draw for history enthusiasts. | Historic homes, Local history museum, Walking tours, Ornately designed gardens |
| Urbana Park | A peaceful neighborhood with plenty of green spaces. It's ideal for families and nature lovers looking for a serene getaway while still being close to city conveniences. | Urbana Park, Playgrounds, Walking trails, Nature observation |
| North Urbana | This area offers access to larger homes and family-friendly environments, making it a potential favorite for family gatherings and longer stays. | Residential areas, Local parks, Shopping centers, Community events |
| South Urbana | Known for its quiet streets and suburban feel, South Urbana is attractive for those looking for a peaceful retreat while still close to Urbana’s amenities. | Community parks, Family-friendly neighborhoods, Shopping options, Cafes |
| Urbana Arts and Culture District | A vibrant area dedicated to the arts, it attracts visitors interested in cultural experiences such as local art exhibits and performances. | Art galleries, Community theater, Local music events, Art festivals |
Understanding Airbnb License Requirements & STR Laws in Urbana (2026)
While Urbana, Ohio, United States currently shows low STR regulations, specific Airbnb license requirements might still exist or change. Always verify the latest short term rental regulations and Airbnb license requirements directly with local government authorities for Urbana to ensure full compliance before hosting.
(Source: AirROI data, 2026, finding no licensed listings among those analyzed)
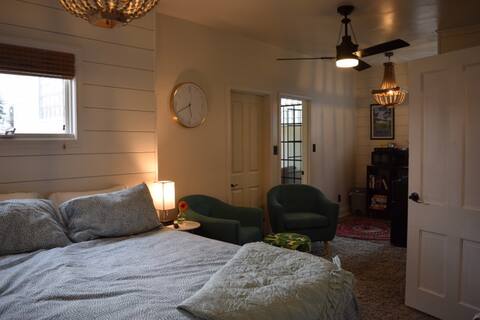
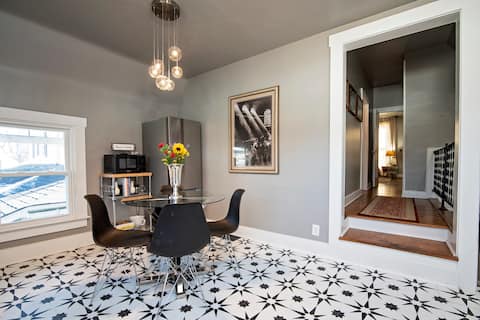
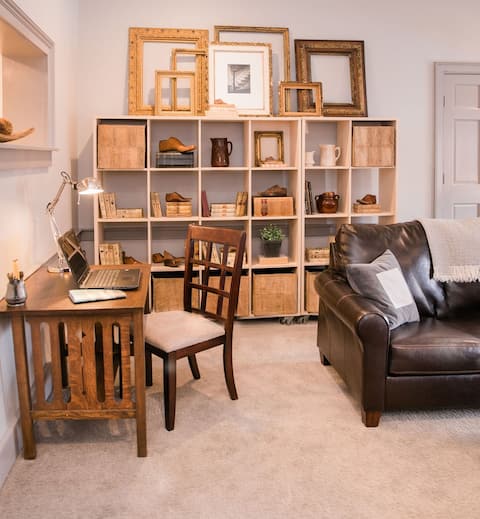
Top Performing Airbnb Properties in Urbana (2026)
Benchmark your potential! Explore examples of top-performing Airbnb properties in Urbanabased on Trailing Twelve Month (TTM) revenue. Analyze their characteristics, revenue, occupancy rate, and ADR to understand what drives success in this market.

The Woodland Hideaway
Entire Place • 4 bedrooms

Charming Historic Ward Estate: 5 BDR, 5 fireplaces
Entire Place • 5 bedrooms

The Cabin at Maple View - Accepting Reservations
Entire Place • 1 bedroom
Scioto Bungalow
Entire Place • 1 bedroom
Lily's Casula
Entire Place • 2 bedrooms
Kenton Suite - Walk to Downtown Dining & Boutique
Entire Place • 1 bedroom
Note: Performance varies based on location, size, amenities, seasonality, and management quality. Data reflects the past 12 months.
Top Performing Airbnb Hosts in Urbana (2026)
Learn from the best! This table showcases top-performing Airbnb hosts in Urbana based on the number of properties managed and estimated total revenue over the past year. Analyze their scale and performance metrics.
| Host Name | Properties | Grossing Revenue | Stay Reviews | Avg Rating |
|---|---|---|---|---|
| Lee Ann | 3 | $61,681 | 398 | 4.93/5.0 |
| Scott | 1 | $50,992 | 105 | 4.99/5.0 |
| Sara | 1 | $48,273 | 98 | 4.90/5.0 |
| Kim | 5 | $47,990 | 439 | 4.97/5.0 |
| Steve | 2 | $41,697 | 301 | 4.99/5.0 |
| Jared | 1 | $34,943 | 913 | 4.99/5.0 |
| Cory | 1 | $30,256 | 239 | 4.94/5.0 |
| Brittany | 1 | $20,158 | 118 | 4.90/5.0 |
| Kimberly | 2 | $19,164 | 59 | 5.00/5.0 |
| Patrick | 1 | $18,250 | 95 | 4.92/5.0 |
Analyzing the strategies of top hosts, such as their property selection, pricing, and guest communication, can offer valuable lessons for optimizing your own Airbnb operations in Urbana.
Dive Deeper: Advanced Urbana STR Market Data (2026)
Ready to unlock more insights? AirROI provides access to advanced metrics and comprehensive Airbnb data for Urbana. Explore detailed analytics beyond this report to refine your investment strategy, optimize pricing, and maximize your vacation rental profits.
Explore Advanced MetricsUrbana Short-Term Rental Market Composition (2026): Property & Room Types
Room Type Distribution
Property Type Distribution
Market Composition Insights for Urbana
- The Urbana Airbnb market composition is heavily skewed towards Entire Home/Apt listings, which make up 100% of the 21 active rentals. This indicates strong guest preference for privacy and space.
- Looking at the property type distribution in Urbana, Apartment/Condo properties are the most common (57.1%), reflecting the local real estate landscape.
- Houses represent a significant 28.6% portion, catering likely to families or larger groups.
- Smaller segments like others (combined 4.8%) offer potential for unique stay experiences.
Urbana Airbnb Room Capacity Analysis (2026): Bedroom Distribution
Distribution of Listings by Number of Bedrooms
Room Capacity Insights for Urbana
- The dominant room capacity in Urbana is 1 bedroom listings, making up 52.4% of the market. This suggests a strong demand for properties suitable for couples or solo travelers.
- Together, 1 bedroom and 2 bedrooms properties represent 85.7% of the active Airbnb listings in Urbana, indicating a high concentration in these sizes.
- With over half the market (52.4%) consisting of studios or 1-bedroom units, Urbana is particularly well-suited for individuals or couples.
- Listings with 3+ bedrooms (9.6%) represent a smaller niche, potentially indicating an underserved market for larger group accommodations in Urbana.
Urbana Vacation Rental Guest Capacity Trends (2026)
Distribution of Listings by Guest Capacity
Guest Capacity Insights for Urbana
- The most common guest capacity trend in Urbana vacation rentals is listings accommodating 4 guests (47.6%). This suggests the primary traveler segment is likely small families or groups.
- Properties designed for 4 guests and 2 guests dominate the Urbana STR market, accounting for 76.2% of listings.
- On average, properties in Urbana are equipped to host 3.8 guests.
Urbana Airbnb Booking Patterns (2026): Available vs. Booked Days
Available Days Distribution
Booked Days Distribution
Booking Pattern Insights for Urbana
- The most common availability pattern in Urbana falls within the 181-270 days range, representing 42.9% of listings. This suggests many properties have significant open periods on their calendars.
- Approximately 76.2% of listings show high availability (181+ days open annually), indicating potential for increased bookings or specific owner usage patterns.
- For booked days, the 91-180 days range is most frequent in Urbana (42.9%), reflecting common guest stay durations or potential owner blocking patterns.
- A notable 23.8% of properties secure long booking periods (181+ days booked per year), highlighting successful long-term rental strategies or significant owner usage.
Urbana Airbnb Minimum Stay Requirements Analysis
Distribution of Listings by Minimum Night Requirement
1 Night
6 listings
28.6% of total
2 Nights
10 listings
47.6% of total
30+ Nights
5 listings
23.8% of total
Key Insights
- The most prevalent minimum stay requirement in Urbana is 2 Nights, adopted by 47.6% of listings. This highlights the market's preference for shorter, flexible bookings.
- A strong majority (76.2%) of the Urbana Airbnb data shows acceptance of very short stays (1-2 nights), indicating a dynamic, high-turnover market.
- A significant segment (23.8%) caters to monthly stays (30+ nights) in Urbana, pointing to opportunities in the extended-stay market.
Recommendations
- Align with the market by considering a 2 Nights minimum stay, as 47.6% of Urbana hosts use this setting.
- If feasible, allowing 1-night stays, especially midweek or during low season, could capture last-minute bookings, as only 28.6% currently do.
- Explore offering discounts for stays of 30+ nights to attract the 23.8% of the market seeking extended stays.
- Adjust minimum nights based on seasonality – potentially shorter during low season and longer during peak demand periods in Urbana.
Urbana Airbnb Cancellation Policy Trends Analysis (2026)
Flexible
9 listings
42.9% of total
Moderate
7 listings
33.3% of total
Firm
4 listings
19% of total
Strict
1 listings
4.8% of total
Cancellation Policy Insights for Urbana
- The prevailing Airbnb cancellation policy trend in Urbana is Flexible, used by 42.9% of listings.
- The market strongly favors guest-friendly terms, with 76.2% of listings offering Flexible or Moderate policies. This suggests guests in Urbana may expect booking flexibility.
- Strict cancellation policies are quite rare (4.8%), potentially making listings with this policy less competitive unless justified by high demand or property type.
Recommendations for Hosts
- Consider adopting a Flexible policy to align with the 42.9% market standard in Urbana.
- Using a Strict policy might deter some guests, as only 4.8% of listings use it. Evaluate if potential revenue protection outweighs possible lower booking rates.
- Regularly review your cancellation policy against competitors and market demand shifts in Urbana.
Urbana STR Booking Lead Time Analysis (2026)
Average Booking Lead Time by Month
Booking Lead Time Insights for Urbana
- The overall average booking lead time for vacation rentals in Urbana is 44 days.
- Guests book furthest in advance for stays during July (average 70 days), likely coinciding with peak travel demand or local events.
- The shortest booking windows occur for stays in January (average 13 days), indicating more last-minute travel plans during this time.
- Seasonally, Summer (59 days avg.) sees the longest lead times, while Winter (33 days avg.) has the shortest, reflecting typical travel planning cycles.
Recommendations for Hosts
- Use the overall average lead time (44 days) as a baseline for your pricing and availability strategy in Urbana.
- For July stays, consider implementing length-of-stay discounts or slightly higher rates for bookings made less than 70 days out to capitalize on advance planning.
- During January, focus on last-minute booking availability and promotions, as guests book with very short notice (13 days avg.).
- Target marketing efforts for the Summer season well in advance (at least 59 days) to capture early planners.
- Monitor your own booking lead times against these Urbana averages to identify opportunities for dynamic pricing adjustments.
Popular & Essential Airbnb Amenities in Urbana (2026)
Amenity Prevalence
Amenity Insights for Urbana
- Essential amenities in Urbana that guests expect include: Coffee maker, Heating, Essentials, Wifi, TV, Dishes and silverware, Smoke alarm, Hot water, Air conditioning, Carbon monoxide alarm. Lacking these (any) could significantly impact bookings.
Recommendations for Hosts
- Ensure your listing includes all essential amenities for Urbana: Coffee maker, Heating, Essentials, Wifi, TV, Dishes and silverware, Smoke alarm, Hot water, Air conditioning, Carbon monoxide alarm.
- Prioritize adding missing essentials: Carbon monoxide alarm.
- Highlight unique or less common amenities you offer (e.g., hot tub, dedicated workspace, EV charger) in your listing description and photos.
- Regularly check competitor amenities in Urbana to stay competitive.
Urbana Airbnb Guest Demographics & Profile Analysis (2026)
Guest Profile Summary for Urbana
- The typical guest profile for Airbnb in Urbana consists of primarily domestic travelers (98%), often arriving from nearby Dayton, typically belonging to the Post-2000s (Gen Z/Alpha) group (50%), primarily speaking English or Spanish.
- Domestic travelers account for 97.5% of guests.
- Key international markets include United States (97.5%) and United Kingdom (0.8%).
- Top languages spoken are English (87.7%) followed by Spanish (5.7%).
- A significant demographic segment is the Post-2000s (Gen Z/Alpha) group, representing 50% of guests.
Recommendations for Hosts
- Target domestic marketing efforts towards travelers from Dayton and Columbus.
- Tailor amenities and listing descriptions to appeal to the dominant Post-2000s (Gen Z/Alpha) demographic (e.g., highlight fast WiFi, smart home features, local guides).
- Highlight unique local experiences or amenities relevant to the primary guest profile.
- Consider seasonal promotions aligned with peak travel times for key origin markets.
Nearby Short-Term Rental Market Comparison
How does the Urbana Airbnb market stack up against its neighbors? Compare key performance metrics like average monthly revenue, ADR, and occupancy rates in surrounding areas to understand the broader regional STR landscape.
| Market | Active Properties | Monthly Revenue | Daily Rate | Avg. Occupancy |
|---|---|---|---|---|
| Sugar Grove | 16 | $6,172 | $489.99 | 43% |
| Creola | 18 | $5,899 | $403.00 | 53% |
| Hocking County | 11 | $5,712 | $508.21 | 49% |
| Rockbridge | 229 | $5,257 | $400.48 | 46% |
| Huron Township | 17 | $5,053 | $484.21 | 40% |
| Berlin Township | 11 | $5,023 | $386.97 | 46% |
| Logan | 688 | $4,907 | $388.67 | 45% |
| Berne Township | 15 | $4,897 | $490.66 | 37% |
| Swan Township | 111 | $4,727 | $334.40 | 49% |
| South Bloomingville | 129 | $4,565 | $312.34 | 48% |