Del City Airbnb Market Analysis 2025: Short Term Rental Data & Vacation Rental Statistics in Oklahoma, United States
Is Airbnb profitable in Del City in 2025? Explore comprehensive Airbnb analytics for Del City, Oklahoma, United States to uncover income potential. This 2025 STR market report for Del City, based on AirROI data from October 2024 to September 2025, reveals key trends in the niche market of 18 active listings.
Whether you're considering an Airbnb investment in Del City, optimizing your existing vacation rental, or exploring rental arbitrage opportunities, understanding the Del City Airbnb data is crucial. Leveraging the low regulation environment is key to maximizing your short term rental income potential. Let's dive into the specifics.
Key Del City Airbnb Performance Metrics Overview
Monthly Airbnb Revenue Variations & Income Potential in Del City (2025)
Understanding the monthly revenue variations for Airbnb listings in Del City is key to maximizing your short term rental income potential. Seasonality significantly impacts earnings. Our analysis, based on data from the past 12 months, shows that the peak revenue month for STRs in Del City is typically May, while December often presents the lowest earnings, highlighting opportunities for strategic pricing adjustments during shoulder and low seasons. Explore the typical Airbnb income in Del City across different performance tiers:
- Best-in-class properties (Top 10%) achieve $3,595+ monthly, often utilizing dynamic pricing and superior guest experiences.
- Strong performing properties (Top 25%) earn $2,350 or more, indicating effective management and desirable locations/amenities.
- Typical properties (Median) generate around $1,633 per month, representing the average market performance.
- Entry-level properties (Bottom 25%) see earnings around $979, often with potential for optimization.
Average Monthly Airbnb Earnings Trend in Del City
Del City Airbnb Occupancy Rate Trends (2025)
Maximize your bookings by understanding the Del City STR occupancy trends. Seasonal demand shifts significantly influence how often properties are booked. Typically, Aprilsees the highest demand (peak season occupancy), while August experiences the lowest (low season). Effective strategies, like adjusting minimum stays or offering promotions, can boost occupancy during slower periods. Here's how different property tiers perform in Del City:
- Best-in-class properties (Top 10%) achieve 79%+ occupancy, indicating high desirability and potentially optimized availability.
- Strong performing properties (Top 25%) maintain 67% or higher occupancy, suggesting good market fit and guest satisfaction.
- Typical properties (Median) have an occupancy rate around 50%.
- Entry-level properties (Bottom 25%) average 35% occupancy, potentially facing higher vacancy.
Average Monthly Occupancy Rate Trend in Del City
Average Daily Rate (ADR) Airbnb Trends in Del City (2025)
Effective short term rental pricing strategy in Del City involves understanding monthly ADR fluctuations. The Average Daily Rate (ADR) for Airbnb in Del City typically peaks in September and dips lowest during February. Leveraging Airbnb dynamic pricing tools or strategies based on this seasonality can significantly boost revenue. Here's a look at the typical nightly rates achieved:
- Best-in-class properties (Top 10%) command rates of $182+ per night, often due to premium features or locations.
- Strong performing properties (Top 25%) achieve nightly rates of $134 or more.
- Typical properties (Median) charge around $95 per night.
- Entry-level properties (Bottom 25%) earn around $47 per night.
Average Daily Rate (ADR) Trend by Month in Del City
Get Live Del City Market Intelligence 👇

Explore Real-time Analytics
Airbnb Seasonality Analysis & Trends in Del City (2025)
Peak Season (May, July, June)
- Revenue averages $2,729 per month
- Occupancy rates average 54.4%
- Daily rates average $116
Shoulder Season
- Revenue averages $1,917 per month
- Occupancy maintains around 52.3%
- Daily rates hold near $111
Low Season (February, March, December)
- Revenue drops to average $1,485 per month
- Occupancy decreases to average 47.1%
- Daily rates adjust to average $103
Seasonality Insights for Del City
- The Airbnb seasonality in Del City shows highly seasonal trends requiring careful strategy. While the sections above show seasonal averages, it's also insightful to look at the extremes:
- During the high season, the absolute peak month showcases Del City's highest earning potential, with monthly revenues capable of climbing to $2,889, occupancy reaching a high of 64.1%, and ADRs peaking at $123.
- Conversely, the slowest single month of the year, typically falling within the low season, marks the market's lowest point. In this month, revenue might dip to $1,268, occupancy could drop to 39.5%, and ADRs may adjust down to $100.
- Understanding both the seasonal averages and these monthly peaks and troughs in revenue, occupancy, and ADR is crucial for maximizing your Airbnb profit potential in Del City.
Seasonal Strategies for Maximizing Profit
- Peak Season: Maximize revenue through premium pricing and potentially longer minimum stays. Ensure high availability.
- Low Season: Offer competitive pricing, special promotions (e.g., extended stay discounts), and flexible cancellation policies. Target off-season travelers like remote workers or budget-conscious guests.
- Shoulder Seasons: Implement dynamic pricing that balances peak and low rates. Target weekend travelers or specific events. Offer slightly more flexible terms than peak season.
- Regularly analyze your own performance against these Del City seasonality benchmarks and adjust your pricing and availability strategy accordingly.
Best Areas for Airbnb Investment in Del City (2025)
Exploring the top neighborhoods for short-term rentals in Del City? This section highlights key areas, outlining why they are attractive for hosts and guests, along with notable local attractions. Consider these locations based on your target guest profile and investment strategy.
| Neighborhood / Area | Why Host Here? (Target Guests & Appeal) | Key Attractions & Landmarks |
|---|---|---|
| Del City Center | The heart of Del City that offers access to shopping and dining. It's a convenient spot for visitors seeking to experience local culture and amenities. | Del City Community Center, Del City Skate Park, Shopping at Del City Plaza, Local restaurants and cafes |
| Southeast 29th Street | This area has a mix of residential and commercial properties, making it attractive for temporary stays and business trips. | Various dining options, Proximity to Tinker Air Force Base, Local parks and recreation areas |
| Midwest City | Adjacent to Del City, offering more amenities and attractions. Visitors can enjoy a variety of restaurants and shopping experiences. | The Marketplace at Midwest City, Midwest City Plaza, Sooner Rose Park, Historical museum |
| Parker Park | A quiet residential area that is family-friendly and ideal for guests looking for a homely atmosphere. | Parker Park activities, Local playgrounds, Nearby schools and libraries |
| Del Crest | A residential neighborhood with close proximity to major highways, appealing to travelers needing quick access to destinations. | Del Crest Park, Community events, Shopping options nearby |
| North Yorkshire Park | A peaceful neighborhood close to parks, making it ideal for families and leisure travelers. | North Yorkshire Park, Local walking trails, Community swimming pool |
| Tinker Air Force Base Area | Attracts military personnel and their families, making it a strategic investment for short-term rentals for temporary stays. | Tinker Air Force Base, Military museums, Veterans' memorials |
| I-40 Corridor | This highway corridor offers easy access to nearby cities and attractions, ideal for road-trippers and business travelers. | Route 66 attractions, Nearby entertainment venues, Shopping malls alongside the corridor |
Understanding Airbnb License Requirements & STR Laws in Del City (2025)
While Del City, Oklahoma, United States currently shows low STR regulations, specific Airbnb license requirements might still exist or change. Always verify the latest short term rental regulations and Airbnb license requirements directly with local government authorities for Del City to ensure full compliance before hosting.
(Source: AirROI data, 2025, finding no licensed listings among those analyzed)
Top Performing Airbnb Properties in Del City (2025)
Benchmark your potential! Explore examples of top-performing Airbnb properties in Del Citybased on Trailing Twelve Month (TTM) revenue. Analyze their characteristics, revenue, occupancy rate, and ADR to understand what drives success in this market.
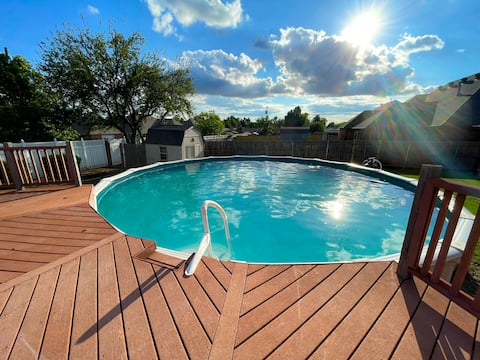
Expansive Summer Oasis w/Private Pool, Gathering
Entire Place • 5 bedrooms
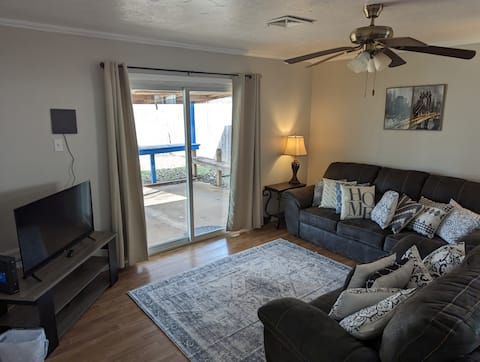
Cute 4 bedroom home in Del City
Entire Place • 4 bedrooms
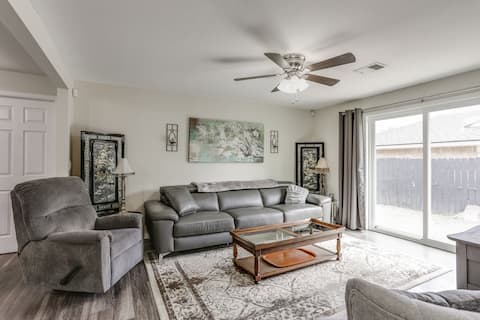
Capital House - World Tour
Entire Place • 3 bedrooms
"Urban Oasis: Chic Retreat"
Entire Place • 4 bedrooms
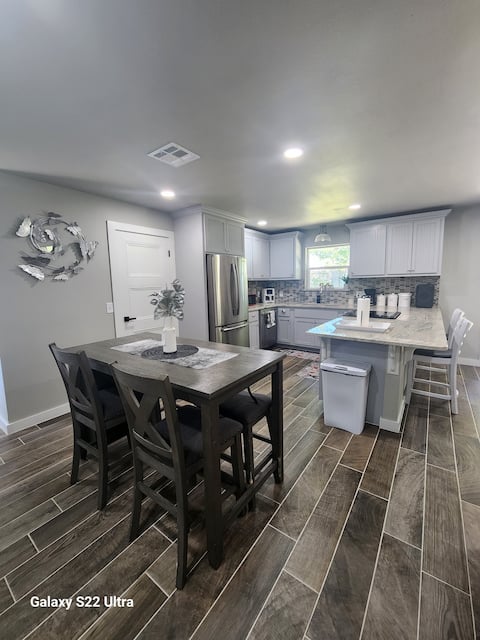
Peaceful Getaway: 3 Bedroom Oasis near Tinker AFB
Entire Place • 3 bedrooms
Royal Comfort Kane
Entire Place • 2 bedrooms
Note: Performance varies based on location, size, amenities, seasonality, and management quality. Data reflects the past 12 months.
Top Performing Airbnb Hosts in Del City (2025)
Learn from the best! This table showcases top-performing Airbnb hosts in Del City based on the number of properties managed and estimated total revenue over the past year. Analyze their scale and performance metrics.
| Host Name | Properties | Grossing Revenue | Stay Reviews | Avg Rating |
|---|---|---|---|---|
| Toshi Stay | 1 | $67,827 | 47 | 4.91/5.0 |
| Allen | 3 | $55,309 | 97 | 4.92/5.0 |
| Christina | 2 | $36,059 | 81 | 4.79/5.0 |
| Paul | 1 | $33,781 | 42 | 4.69/5.0 |
| Mylinda | 1 | $25,948 | 38 | 4.82/5.0 |
| Maria | 1 | $25,091 | 25 | 5.00/5.0 |
| Jessica | 1 | $17,923 | 45 | 4.89/5.0 |
| Aubrey | 1 | $17,833 | 35 | 4.89/5.0 |
| Amy | 1 | $15,621 | 3 | 4.33/5.0 |
| Sherrie | 1 | $9,825 | 6 | 5.00/5.0 |
Analyzing the strategies of top hosts, such as their property selection, pricing, and guest communication, can offer valuable lessons for optimizing your own Airbnb operations in Del City.
Dive Deeper: Advanced Del City STR Market Data (2025)
Ready to unlock more insights? AirROI provides access to advanced metrics and comprehensive Airbnb data for Del City. Explore detailed analytics beyond this report to refine your investment strategy, optimize pricing, and maximize your vacation rental profits.
Explore Advanced MetricsDel City Short-Term Rental Market Composition (2025): Property & Room Types
Room Type Distribution
Property Type Distribution
Market Composition Insights for Del City
- The Del City Airbnb market composition is heavily skewed towards Entire Home/Apt listings, which make up 77.8% of the 18 active rentals. This indicates strong guest preference for privacy and space.
- Looking at the property type distribution in Del City, House properties are the most common (100%), reflecting the local real estate landscape.
- Houses represent a significant 100% portion, catering likely to families or larger groups.
Del City Airbnb Room Capacity Analysis (2025): Bedroom Distribution
Distribution of Listings by Number of Bedrooms
Room Capacity Insights for Del City
- The dominant room capacity in Del City is 3 bedrooms listings, making up 38.9% of the market. This suggests a strong demand for properties suitable for families or small groups.
- Together, 3 bedrooms and 2 bedrooms properties represent 61.1% of the active Airbnb listings in Del City, indicating a high concentration in these sizes.
- A significant 55.6% of listings offer 3+ bedrooms, catering to larger groups and families seeking more space in Del City.
Del City Vacation Rental Guest Capacity Trends (2025)
Distribution of Listings by Guest Capacity
Guest Capacity Insights for Del City
- The most common guest capacity trend in Del City vacation rentals is listings accommodating 6 guests (38.9%). This suggests the primary traveler segment is likely larger groups.
- Properties designed for 6 guests and 4 guests dominate the Del City STR market, accounting for 55.6% of listings.
- 50.0% of properties accommodate 6+ guests, serving the market segment for larger families or group travel in Del City.
- On average, properties in Del City are equipped to host 4.4 guests.
Del City Airbnb Booking Patterns (2025): Available vs. Booked Days
Available Days Distribution
Booked Days Distribution
Booking Pattern Insights for Del City
- The most common availability pattern in Del City falls within the 91-180 days range, representing 38.9% of listings. This suggests many properties have significant open periods on their calendars.
- Approximately 61.1% of listings show high availability (181+ days open annually), indicating potential for increased bookings or specific owner usage patterns.
- For booked days, the 181-270 days range is most frequent in Del City (38.9%), reflecting common guest stay durations or potential owner blocking patterns.
- A notable 38.9% of properties secure long booking periods (181+ days booked per year), highlighting successful long-term rental strategies or significant owner usage.
Del City Airbnb Minimum Stay Requirements Analysis
Distribution of Listings by Minimum Night Requirement
1 Night
3 listings
16.7% of total
2 Nights
6 listings
33.3% of total
3 Nights
2 listings
11.1% of total
7-29 Nights
4 listings
22.2% of total
30+ Nights
3 listings
16.7% of total
Key Insights
- The most prevalent minimum stay requirement in Del City is 2 Nights, adopted by 33.3% of listings. This highlights the market's preference for shorter, flexible bookings.
- A significant segment (16.7%) caters to monthly stays (30+ nights) in Del City, pointing to opportunities in the extended-stay market.
Recommendations
- Align with the market by considering a 2 Nights minimum stay, as 33.3% of Del City hosts use this setting.
- If feasible, allowing 1-night stays, especially midweek or during low season, could capture last-minute bookings, as only 16.7% currently do.
- A 2-night minimum appears standard (33.3%). Consider this for weekends or peak periods.
- Explore offering discounts for stays of 30+ nights to attract the 16.7% of the market seeking extended stays.
- Adjust minimum nights based on seasonality – potentially shorter during low season and longer during peak demand periods in Del City.
Del City Airbnb Cancellation Policy Trends Analysis (2025)
Flexible
7 listings
38.9% of total
Moderate
4 listings
22.2% of total
Firm
3 listings
16.7% of total
Strict
4 listings
22.2% of total
Cancellation Policy Insights for Del City
- The prevailing Airbnb cancellation policy trend in Del City is Flexible, used by 38.9% of listings.
- There's a relatively balanced mix between guest-friendly (61.1%) and stricter (38.9%) policies, offering choices for different guest needs.
Recommendations for Hosts
- Consider adopting a Flexible policy to align with the 38.9% market standard in Del City.
- Regularly review your cancellation policy against competitors and market demand shifts in Del City.
Del City STR Booking Lead Time Analysis (2025)
Average Booking Lead Time by Month
Booking Lead Time Insights for Del City
- The overall average booking lead time for vacation rentals in Del City is 18 days.
- Guests book furthest in advance for stays during May (average 43 days), likely coinciding with peak travel demand or local events.
- The shortest booking windows occur for stays in December (average 8 days), indicating more last-minute travel plans during this time.
- Seasonally, Spring (26 days avg.) sees the longest lead times, while Winter (11 days avg.) has the shortest, reflecting typical travel planning cycles.
Recommendations for Hosts
- Use the overall average lead time (18 days) as a baseline for your pricing and availability strategy in Del City.
- For May stays, consider implementing length-of-stay discounts or slightly higher rates for bookings made less than 43 days out to capitalize on advance planning.
- During December, focus on last-minute booking availability and promotions, as guests book with very short notice (8 days avg.).
- Target marketing efforts for the Spring season well in advance (at least 26 days) to capture early planners.
- Monitor your own booking lead times against these Del City averages to identify opportunities for dynamic pricing adjustments.
Popular & Essential Airbnb Amenities in Del City (2025)
Amenity Prevalence
Amenity Insights for Del City
- Essential amenities in Del City that guests expect include: Kitchen, Washer, Air conditioning, Smoke alarm, Wifi, TV, Free parking on premises. Lacking these (any) could significantly impact bookings.
- Popular amenities like Hot water, Heating, Dryer are common but not universal. Offering these can provide a competitive edge.
Recommendations for Hosts
- Ensure your listing includes all essential amenities for Del City: Kitchen, Washer, Air conditioning, Smoke alarm, Wifi, TV, Free parking on premises.
- Consider adding popular differentiators like Hot water or Heating to increase appeal.
- Highlight unique or less common amenities you offer (e.g., hot tub, dedicated workspace, EV charger) in your listing description and photos.
- Regularly check competitor amenities in Del City to stay competitive.
Del City Airbnb Guest Demographics & Profile Analysis (2025)
Guest Profile Summary for Del City
- The typical guest profile for Airbnb in Del City consists of primarily domestic travelers (99%), often arriving from nearby Oklahoma City, typically belonging to the Post-2000s (Gen Z/Alpha) group (50%), primarily speaking English or Spanish.
- Domestic travelers account for 99.2% of guests.
- Key international markets include United States (99.2%) and Puerto Rico (0.8%).
- Top languages spoken are English (71.3%) followed by Spanish (17.2%).
- A significant demographic segment is the Post-2000s (Gen Z/Alpha) group, representing 50% of guests.
Recommendations for Hosts
- Target domestic marketing efforts towards travelers from Oklahoma City and Tulsa.
- Tailor amenities and listing descriptions to appeal to the dominant Post-2000s (Gen Z/Alpha) demographic (e.g., highlight fast WiFi, smart home features, local guides).
- Highlight unique local experiences or amenities relevant to the primary guest profile.
- Consider seasonal promotions aligned with peak travel times for key origin markets.
Nearby Short-Term Rental Market Comparison
How does the Del City Airbnb market stack up against its neighbors? Compare key performance metrics like average monthly revenue, ADR, and occupancy rates in surrounding areas to understand the broader regional STR landscape.
| Market | Active Properties | Monthly Revenue | Daily Rate | Avg. Occupancy |
|---|---|---|---|---|
| Bethany | 11 | $2,361 | $204.89 | 47% |
| Medicine Park | 98 | $2,276 | $181.86 | 41% |
| Sperry | 24 | $2,185 | $271.44 | 30% |
| Newcastle | 10 | $2,135 | $236.05 | 42% |
| Edmond | 187 | $2,071 | $161.91 | 48% |
| Norman | 410 | $1,948 | $233.36 | 37% |
| Madill | 10 | $1,934 | $212.40 | 41% |
| Skiatook | 12 | $1,927 | $218.80 | 32% |
| Mustang | 17 | $1,912 | $148.85 | 50% |
| Ardmore | 43 | $1,891 | $153.26 | 45% |